. 2022 Dec 7;12(12):1831.
doi: 10.3390/biom12121831.

Oxidative Stress-Induced HMGB1 Translocation in Myenteric Neurons Contributes to Neuropathy in Colitis

Affiliations

Oxidative Stress-Induced HMGB1 Translocation in Myenteric Neurons Contributes to Neuropathy in Colitis

Rhian Stavely et al. Biomolecules. .

Abstract

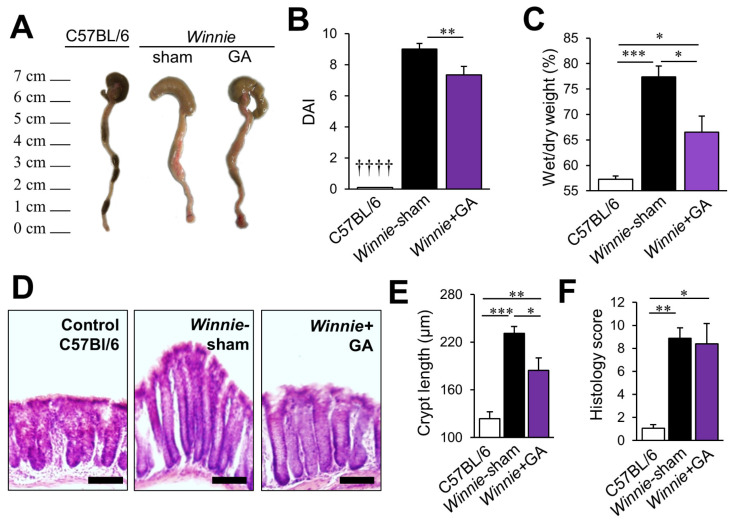
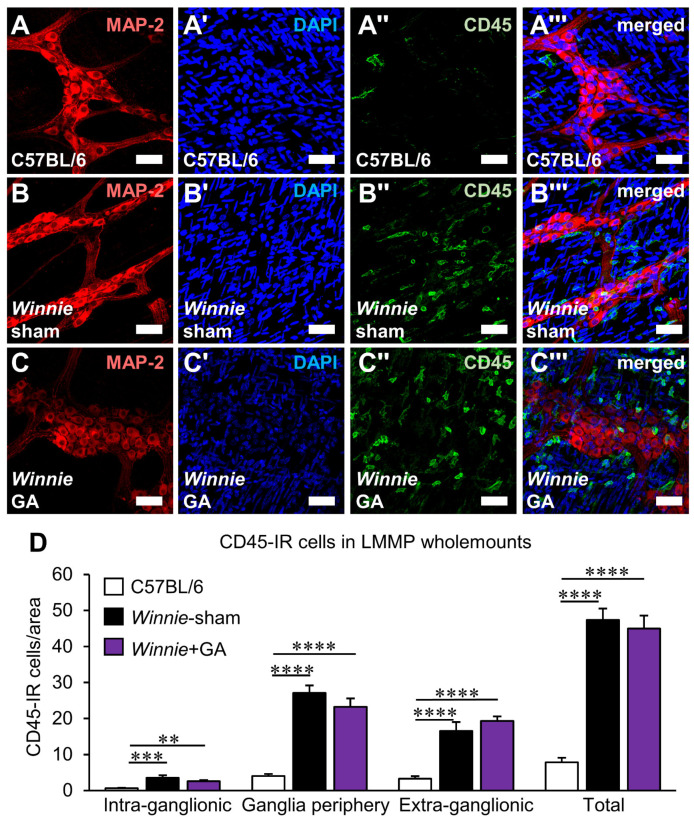
High-mobility group box 1 (HMGB1) is a damage-associated molecular pattern released by dying cells to stimulate the immune response. During cell death, HMGB1 is translocated from the nucleus to the cytoplasm and passively released. High levels of secreted HMGB1 are observed in the faeces of inflammatory bowel disease (IBD) patients, indicating its role in IBD pathophysiology and potential as a non-invasive IBD biomarker. HMGB1 is important in regulating neuronal damage in the central nervous system; its pathological activity is intertwined with oxidative stress and inflammation. In this study, HMGB1 expression in the enteric nervous system and its relevance to intestinal neuroinflammation is explored in organotypic cultures of the myenteric plexus exposed to oxidative stimuli and in Winnie mice with spontaneous chronic colitis. Oxidative stimuli induced cytoplasmic translocation of HMGB1 in myenteric neurons in organotypic preparations. HMGB1 translocation correlated with enteric neuronal loss and oxidative stress in the myenteric ganglia of Winnie mice. Inhibition of HMGB1 by glycyrrhizic acid ameliorated HMGB1 translocation and myenteric neuronal loss in Winnie mice. These data highlight modulation of HMGB1 signalling as a therapeutic strategy to reduce the consequences of enteric neuroinflammation in colitis, warranting the exploration of therapeutics acting on the HMGB1 pathway as an adjunct treatment with current anti-inflammatory agents.

Keywords: HMGB1; colitis; enteric neurons; inflammatory bowel disease; neuroinflammation; neuropathy; oxidative stress; plexitis.


Conflict of interest statement

The authors declare no conflict of interest.

Figures

Figure 1
Figure 1
HMGB1 is a candidate endogenous TLR signalling cytokine in enteric neuroinflammation. (A,A’) Neurons within the myenteric ganglia were observed by immunofluorescence using the neuronal marker MAP-2 in distal colon organotypic cultures. Tissues were cultured for 24 h in standard culture medium (A) or in the presence of LPS (scale bar = 50 µm). (A’’) Quantification of myenteric neuron density expressed as the number of neurons per ganglionated area. *** p < 0.001; control: n = 6 independent samples, LPS: n = 7 independent samples. (B) Protein-Protein Interaction network visualisation of proteins with validated experimental evidence of physical interactions with TLR2 and TLR4. (C) Gene expression scores of Hmgb1; neural-crest and glial cell marker, Sox10; neuronal marker, Elavl4; inhibitory motor neuron marker, Nos1; and excitatory neuron marker, Chat from mousebrain.org (accessed on 16 September 2021) [14] single cell database.
Figure 2
Figure 2
Neuronal translocation of HMGB1 associates with enteric neuropathy in Winnie mice. (A) HMGB1 in neurons within the myenteric ganglia was observed by immunofluorescence of HMGB1, the neuronal marker MAP-2 and the nuclear stain DAPI in fresh fixed LMMP wholemount preparations from the distal colon of C57BL/6 and Winnie mice. Magnified images demonstrate the unique staining patterns of HMGB1 observed in Winnie mice, including the translocation of HMGB1 to the neuronal cytoplasm and loss of nuclear HMGB1 in the neurons but not enteric glia. (scale bar = 50 µm). (BB’’) Quantification of the total number of cells (B), neurons (B’) and non-neuronal cells (B’’) with nuclear HMGB1 in the myenteric plexus expressed as cells per ganglionated area. (C) Percentage of neurons without HMGB1 in the nucleus. (C’) Linear correlation between neuronal density and the percentage of neurons without nuclear HMGB1 expression. (D) Percentage of neurons with HMGB1 translocated to the cytoplasm. (D’) Linear correlation between neuronal density and the percentage of neurons with cytoplasmic HMGB1 translocation. * p < 0.05; C57BL/6: n = 5 animals, Winnie: n = 7 animals.
Figure 3
Figure 3
Oxidative stress in the myenteric ganglia of Winnie mice. (AB’’’) DNA/RNA oxidative damage in neurons within the myenteric ganglia was visualised by immunofluorescence using the neuronal marker MAP-2 (A,B) and the DNA/RNA damage marker 8-OHdG (A’,B’). Adducts of 8-OHdG were observed in binary images of 8-OHdG immunofluorescence (A’’,B’’). Co-localisation of 8-OHdG adducts with MAP-2 was viewed in merged images in cross sections from the distal colon of C57BL/6 mice (AA’’’) and Winnie mice (BB’’’) (scale bar = 20 µm). (C) Quantification of 8-OHdG adducts as a percent of the area in the myenteric neurons in colonic cross sections. * p < 0.05; C57BL/6: n = 6 animals, Winnie: n = 7 animals. (D,D’) Mitochondria-derived superoxide (O2) in the myenteric ganglia was visualised by the fluorescent probe MitoSOX in LMMP wholemount preparations from the distal colon of C57BL/6 mice (D) and Winnie mice (D’) (scale bar = 50 µm). All images were taken using the same acquisition settings and are pseudo-coloured (LUT: ‘heat’, ImageJ) for greater visual distinction in this figure. (E) The mean fluorescence intensity of the myenteric ganglia in single-channel 16-bit images was quantified to determine the intensity of MitoSOX fluorescence. * p < 0.05; C57BL/6: n = 5 animals, Winnie n = 6 animals.
Figure 4
Figure 4
Effects of hyperoxia on HMGB1 expression in myenteric neurons after organotypic culture. (AC’’’’) HMGB1 expression within the myenteric ganglia in distal colon organotypic cultures. Myenteric neurons observed by immunofluorescence of the neuronal marker MAP-2 (AC), nuclear stain with DAPI (A’C’), HMGB1 (A’’C’’), merged images (A’’’C’’’) and ratio representations of HMGB1:DAPI (A’’’’C’’’’) for visual distinction. Tissues were cultured for 24 h in 5% CO2 and ambient O2 conditions (control) (A) or hyperoxic (↑O2) conditions (5% CO2, 95% O2) (B,C). Neurons without nuclear HMGB1 expression are denoted by arrows (BB’’’’), and neurons with HMGB1 translocation into the cytoplasm are denoted by stars (CC’’’’) (scale bar = 20 µm). (D,D’) Quantification of neurons with HMGB1 expressed in the nucleus (D) and translocated to the cytoplasm (D’) presented as neurons per ganglionated area. (E) Linear correlation between neuronal density and neurons with translocation of HMGB1 per area. (FF’’) Percentage of neurons with HMGB1 expressed in the nucleus (nuclear HMGB1+ve) (F), absent in the nucleus (nuclear HMGB1−ve) (F’) and translocated to the cytoplasm (F’’). (E) Linear correlation between neuronal density and the percentage of neurons with HMGB1 translocation. (H,H’) Quantification of non-neuronal cells with HMGB1 expressed in the nucleus (H) and translocated to the cytoplasm (H’) presented as cells per ganglionated area. * p < 0.05, ** p < 0.01; control: n = 8 independent samples, ↑O2: n = 7 independent samples.
Figure 5
Figure 5
Effects of hydrogen peroxide on HMGB1 expression in myenteric neurons after organotypic culture. (AC’’’’) HMGB1 expression within the myenteric ganglia in distal colon organotypic cultures. Myenteric neurons observed by immunofluorescence of the neuronal marker MAP-2 (AC), nuclear stain with DAPI (A’C’), HMGB1 (A’’C’’), merged images (A’’’C’’’) and ratio representations of HMGB1:DAPI (A’’’’C’’’’) for visual distinction. Tissues were cultured for 24 h in standard culture medium (A) or medium with 100 µM H2O2 (B,C). Neurons without nuclear HMGB1 expression are denoted by arrows (BB’’’’) and neurons with HMGB1 translocation into the cytoplasm are denoted by stars (CC’’’’) (scale bar = 20 µm). (D,D’) Quantification of neurons with HMGB1 expressed in the nucleus (D) and translocated to the cytoplasm (D’) presented as neurons per ganglionated area. (E) Linear correlation between neuronal density and neurons with translocation of HMGB1 per area. (FF’’) Percentage of neurons with HMGB1 expressed in the nucleus (F), absent in the nucleus (F’) and translocated to the cytoplasm (F’’). (E) Linear correlation between neuronal density and the percentage of neurons with HMGB1translocation. (H,H’) Quantification of non-neuronal cells with HMGB1 expressed in the nucleus (H) and translocated to the cytoplasm (H’) presented as cells per ganglionated area. * p < 0.05, *** p < 0.001, **** p < 0.0001; control: n = 8 independent samples, H2O2: n = 9 independent samples.
Figure 6
Figure 6
Effects of HMGB1 blocker, glycyrrhizic acid, on colon morphology and the disease activity in Winnie mice. (A) Representative photographs of the colons were obtained from C57BL/6 mice, sham-treated Winnie mice and Winnie mice treated with glycyrrhizic acid (GA). (B) Disease Activity Index (DAI) of colitis consisting of rectal bleeding, prolapse, colon morphology, diarrhoea and weight loss in C57BL/6 mice, Winnie mice treated with vehicle sham and Winnie mice treated with glycyrrhizic acid (GA). ** p < 0.01 between Winnie-sham and Winnie + GA, †††† p < 0.0001 between C57BL/6 and both Winnie-sham and Winnie + GA; n = 6 animals/group. (C) Faecal water content was determined by comparing the wet weight to the dry weight of faecal pellets from C57BL/6 mice, Winnie mice treated with vehicle sham and Winnie mice treated with glycyrrhizic acid. * p < 0.05, *** p < 0.001; n = 6 animals/group. (D) Representative images of haematoxylin and eosin staining (top row) of the cross-sections of the colons from C57BL/6 mice, Winnie mice treated with vehicle (sham) and Winnie mice treated with glycyrrhizic acid. Scale bars = 100 µm. (E) Quantification of the length (µm) of mucosal crypts and in the colon. * p < 0.05, ** p < 0.01, *** p < 0.001; C57BL/6 mice: n = 5; Winnie Sham and GA: n = 4 animals/group. (F) Quantification of histological grading of colitis in the colon. * p < 0.05, ** p < 0.01; n = 5 animals/group.
Figure 7
Figure 7
Effects of glycyrrhizic acid treatment on neuronal HMGB1 expression in wholemount LMMP preparations from the distal colon of Winnie mice. (AC’’’’) HMGB1 in neurons within the myenteric ganglia were observed by immunofluorescence of the neuronal marker MAP-2 (AC), the nuclear stain DAPI (A’C’), HMGB1 (A’’C’’), merged images (A’’’C’’’) and merged magnified images (A’’’’C’’’’) in LMMP wholemount preparations from the distal colon of C57BL/6 mice (AA’’’’), sham-treated Winnie mice (BB’’’’) and Winnie mice treated with glycyrrhizic acid (GA) (CC’’’’) (scale bar = 50 µm). (D) Quantification of myenteric neuronal density expressed as the number of neurons per ganglionated area. ** p < 0.01; n = 6 animals/group. (E) The total number of cells, neurons and non-neuronal cells with nuclear HMGB1 within the ganglia expressed as cells per ganglionated area. (F) Percentage of neurons without HMGB1 in the nucleus. (G) Percentage of neurons with HMGB1 translocated to the cytoplasm. * p < 0.05, ** p < 0.01, *** p < 0.001; n = 5 animals/group.
Figure 8
Figure 8
Effects of glycyrrhizic acid treatments on leukocyte numbers in proximity to myenteric neurons in the distal colon of Winnie mice. (AC’’’) Leukocytes in proximity to the myenteric ganglia were observed by immunofluorescence of the neuronal marker MAP-2 (AC), nuclear stain DAPI (A’C’), the pan-leukocyte marker CD-45 (A’’C’’) and merged images (A’’’C’’’) in LMMP wholemount preparations from the distal colon of C57BL/6 mice (AA’’’), sham-treated Winnie mice (BB’’’) and Winnie mice treated with glycyrrhizic acid (GA) (CC’’’) (scale bar = 50 µm). (D) Quantification of CD-45-IR cells per area. Leukocytes were categorised as residing in the intra-ganglionic region, the periphery of the ganglia or the extra-ganglionic region. ** p < 0.01, *** p < 0.001, **** p < 0.0001; n = 6 animals/group.

Similar articles

Cited by

References

    1. Voss U., Ekblad E. Lipopolysaccharide-Induced Loss of Cultured Rat Myenteric Neurons—Role of AMP-Activated Protein Kinase. PLoS ONE. 2014;9:e114044. doi: 10.1371/journal.pone.0114044. - DOI - PMC - PubMed
    1. Gong G., Xiang L., Yuan L., Hu L., Wu W., Cai L., Yin L., Dong H. Protective effect of glycyrrhizin, a direct HMGB1 inhibitor, on focal cerebral ischemia/reperfusion-induced inflammation, oxidative stress, and apoptosis in rats. PLoS ONE. 2014;9:e89450. doi: 10.1371/journal.pone.0089450. - DOI - PMC - PubMed
    1. Stavely R., Fraser S., Sharma S., Rahman A.A., Stojanovska V., Sakkal S., Apostolopoulos V., Bertrand P., Nurgali K. The onset and progression of chronic colitis parallels increased mucosal serotonin release via enterochromaffin cell hyperplasia and downregulation of the serotonin reuptake transporter. Inflamm. Bowel Dis. 2018;24:1021–1034. doi: 10.1093/ibd/izy016. - DOI - PubMed
    1. Filippone R.T., Dargahi N., Eri R., Uranga J.A., Bornstein J.C., Apostolopoulos V., Nurgali K. Potent CCR3 Receptor Antagonist, SB328437, Suppresses Colonic Eosinophil Chemotaxis and Inflammation in the Winnie Murine Model of Spontaneous Chronic Colitis. Int. J. Mol. Sci. 2022;23:7780. doi: 10.3390/ijms23147780. - DOI - PMC - PubMed
    1. Robinson A.M., Rahman A.A., Carbone S.E., Randall-Demllo S., Filippone R., Bornstein J.C., Eri R., Nurgali K. Alterations of colonic function in the Winnie mouse model of spontaneous chronic colitis. Am. J. Physiol. Gastrointest. Liver Physiol. 2017;312:G85–G102. doi: 10.1152/ajpgi.00210.2016. - DOI - PubMed

Publication types

MeSH terms