

Joint Action Toxicity of Arsenic (As) and Lead (Pb) Mixtures in Developing Zebrafish
- PMID: 36551261
- PMCID: PMC9776292
- DOI: 10.3390/biom12121833
Joint Action Toxicity of Arsenic (As) and Lead (Pb) Mixtures in Developing Zebrafish
Abstract
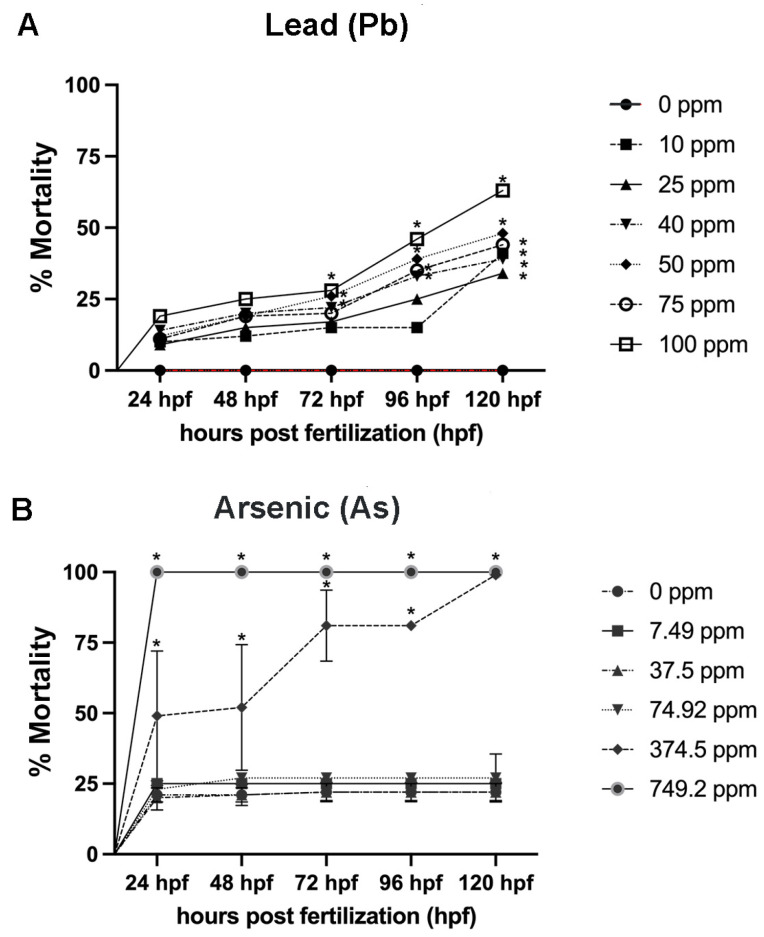
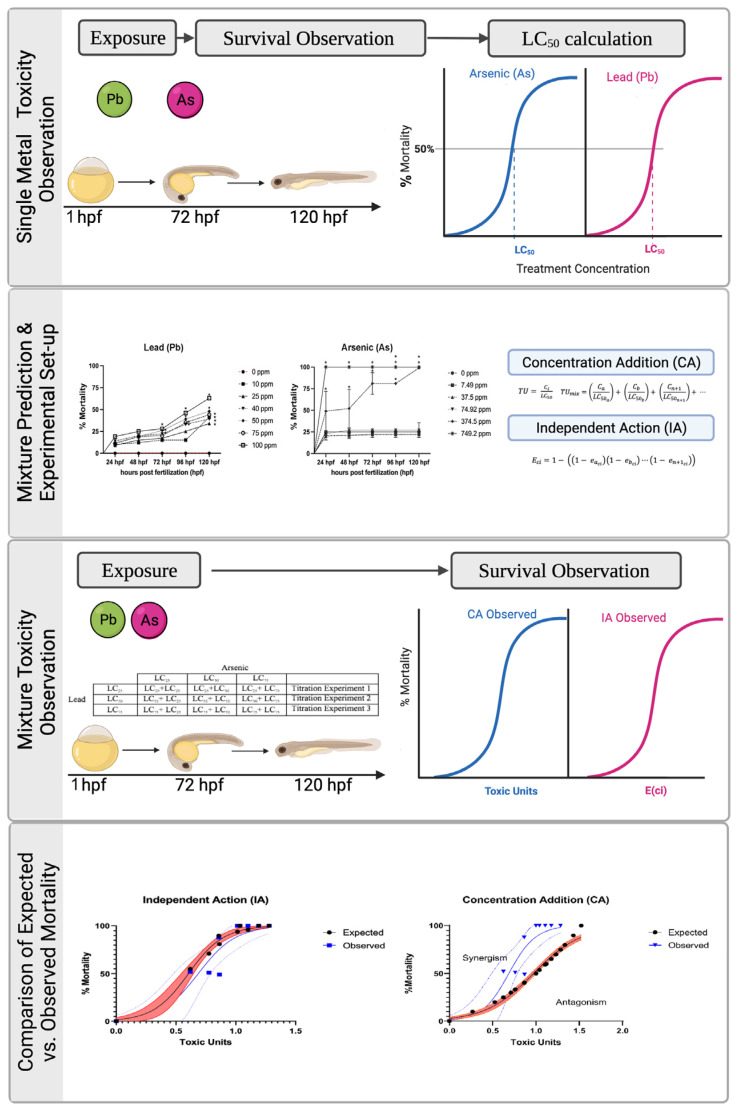
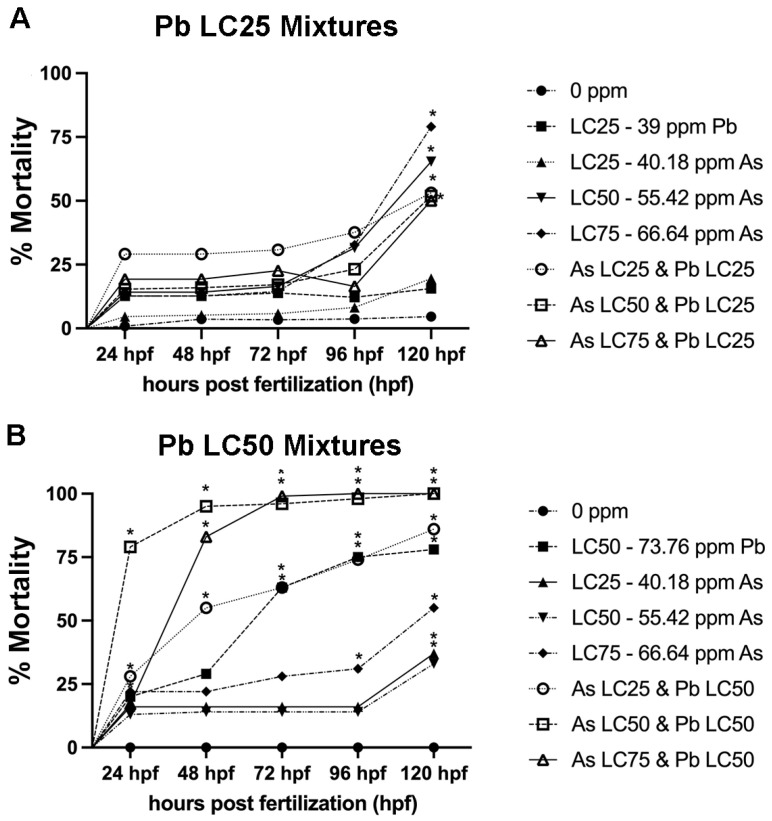
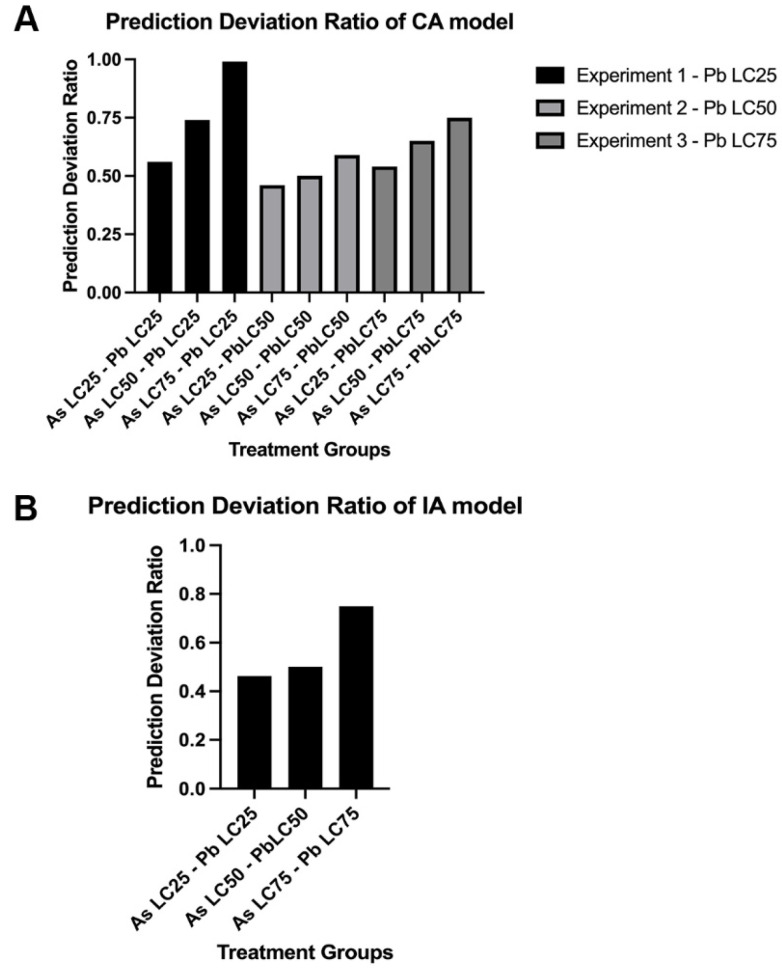
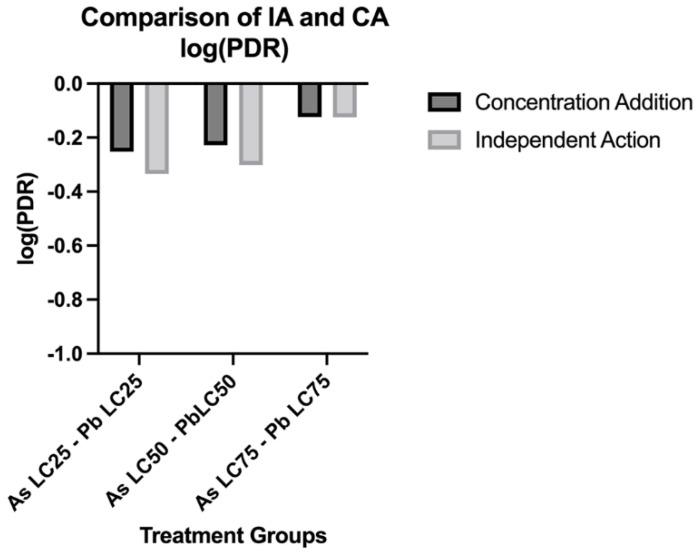
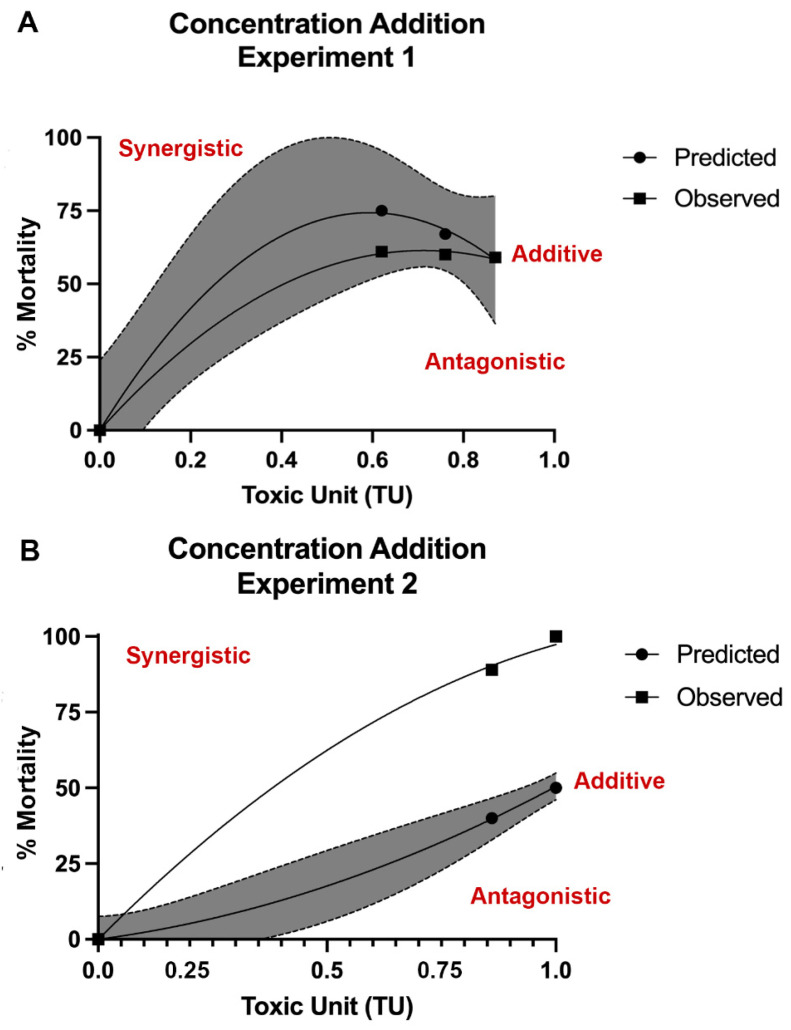
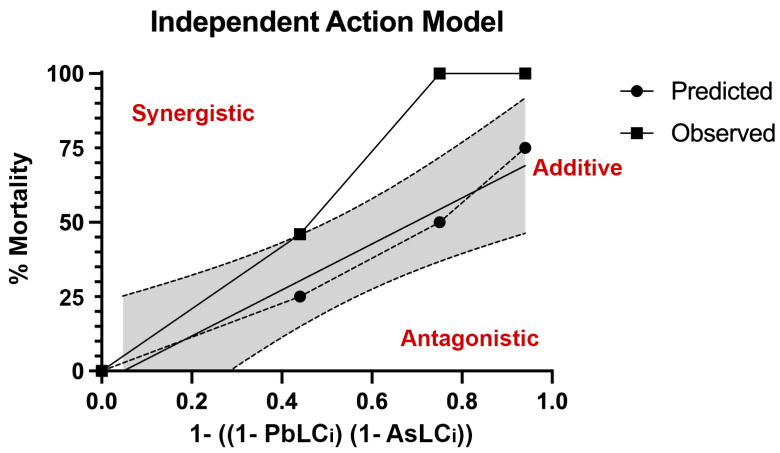
Arsenic (As) and lead (Pb) are environmental pollutants found in common sites and linked to similar adverse health effects. Multiple studies have investigated the toxicity of each metal individually or in complex mixtures. Studies defining the joint interaction of a binary exposure to As and Pb, especially during the earliest stages of development, are limited and lack confirmation of the predicted mixture interaction. We hypothesized that a mixture of As (iAsIII) and Pb will have a concentration addition (CA) interaction informed by common pathways of toxicity of the two metals. To test this hypothesis, developing zebrafish (1-120 h post fertilization; hpf) were first exposed to a wide range of concentrations of As or Pb separately to determine 120 hpf lethal concentrations. These data were then used in the CA and independent action (IA) models to predict the type of mixture interaction from a co-exposure to As and Pb. Three titration mixture experiments were completed to test prediction of observed As and Pb mixture interaction by keeping the Pb concentration constant and varying As concentrations in each experiment. The prediction accuracy of the two models was then calculated using the prediction deviation ratio (PDR) and Chi-square test and regression modeling applied to determine type of interaction. Individual metal exposures determined As and Pb concentrations at which 25% (39.0 ppm Pb, 40.2 ppm As), 50% (73.8 ppm Pb, 55.4 ppm As), 75% (99.9 ppm Pb, 66.6 ppm As), and 100% (121.7 ppm Pb, 77.3 ppm As) lethality was observed at 120 hpf. These data were used to graph the predicted mixture interaction using the CA and IA models. The titration experiments provided experimental observational data to assess the prediction. PDR values showed the CA model approached 1, whereas all PDR values for the IA model had large deviations from predicted data. In addition, the Chi-square test showed most observed results were significantly different from the predictions, except in the first experiment (Pb LC25 held constant) with the CA model. Regression modeling for the IA model showed primarily a synergistic response among all exposure scenarios, whereas the CA model indicated additive response at lower exposure concentrations and synergism at higher exposure concentrations. The CA model was a better predictor of the Pb and As binary mixture interaction compared to the IA model and was able to delineate types of mixture interactions among different binary exposure scenarios.
Keywords: arsenic; developmental toxicity; lead; metal; mixtures; zebrafish.
Conflict of interest statement
The authors declare no conflict of interest.
Figures
Similar articles
-
Concentration addition and independent action model: Which is better in predicting the toxicity for metal mixtures on zebrafish larvae.Sci Total Environ. 2018 Jan 1;610-611:442-450. doi: 10.1016/j.scitotenv.2017.08.058. Epub 2017 Sep 14. Sci Total Environ. 2018. PMID: 28820978
-
A new effect residual ratio (ERR) method for the validation of the concentration addition and independent action models.Environ Sci Pollut Res Int. 2010 Jun;17(5):1080-9. doi: 10.1007/s11356-009-0265-7. Epub 2009 Dec 1. Environ Sci Pollut Res Int. 2010. PMID: 19949878
-
Observed and predicted embryotoxic and teratogenic effects of organic and inorganic environmental pollutants and their mixtures in zebrafish (Danio rerio).Aquat Toxicol. 2022 Jul;248:106175. doi: 10.1016/j.aquatox.2022.106175. Epub 2022 Apr 25. Aquat Toxicol. 2022. PMID: 35523058
-
Heavy metals (Pb, Cd, As and MeHg) as risk factors for cognitive dysfunction: A general review of metal mixture mechanism in brain.Environ Toxicol Pharmacol. 2016 Dec;48:203-213. doi: 10.1016/j.etap.2016.09.016. Epub 2016 Sep 26. Environ Toxicol Pharmacol. 2016. PMID: 27816841 Review.
-
Mixture toxicity and its modeling by quantitative structure-activity relationships.Environ Toxicol Chem. 2003 Aug;22(8):1900-15. doi: 10.1897/01-386. Environ Toxicol Chem. 2003. PMID: 12924589 Review.
Cited by
-
Glutamate-Mediated Neural Alterations in Lead Exposure: Mechanisms, Pathways, and Phenotypes.Toxics. 2025 Jun 21;13(7):519. doi: 10.3390/toxics13070519. Toxics. 2025. PMID: 40710964 Free PMC article. Review.
-
Effects of arsenic exposure on blood trace element levels in rats and sex differences.Biometals. 2024 Oct;37(5):1099-1111. doi: 10.1007/s10534-024-00594-1. Epub 2024 Apr 3. Biometals. 2024. PMID: 38568319
-
Cerebral Vascular Toxicity after Developmental Exposure to Arsenic (As) and Lead (Pb) Mixtures.Toxics. 2024 Aug 24;12(9):624. doi: 10.3390/toxics12090624. Toxics. 2024. PMID: 39330552 Free PMC article.
-
Neurotoxicity of Combined Exposure to the Heavy Metals (Pb and As) in Zebrafish (Danio rerio).Toxics. 2024 Apr 11;12(4):282. doi: 10.3390/toxics12040282. Toxics. 2024. PMID: 38668505 Free PMC article.
References
-
- Styblo M., Del Razo L.M., Vega L., Germolec D.R., LeCluyse E., Hamilton G.A., Reed W., Wang C., Cullen W.R., Thomas D.J. Comparative toxicity of trivalent and pentavalent inorganic and methylated arsenicals in rat and human cells. [(accessed on 11 April 2018)];Arch. Toxicol. 2000 74:289–299. Available online: http://www.ncbi.nlm.nih.gov/pubmed/11005674. - PubMed
Publication types
MeSH terms
Substances
Grants and funding
LinkOut - more resources
Full Text Sources
Medical
Research Materials
