Review
. 2022 Dec 8;12(12):1837.
doi: 10.3390/biom12121837.

Systems Biology Analysis of Temporal Dynamics That Govern Endothelial Response to Cyclic Stretch

Affiliations
Review

Systems Biology Analysis of Temporal Dynamics That Govern Endothelial Response to Cyclic Stretch

Michael W Lai et al. Biomolecules. .

Abstract

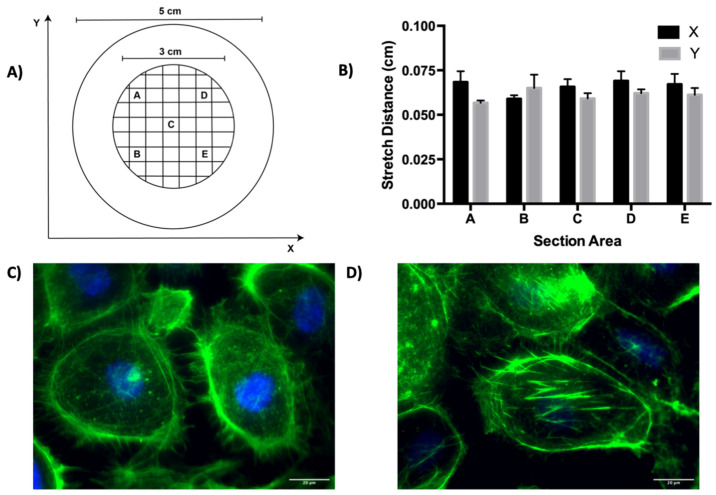
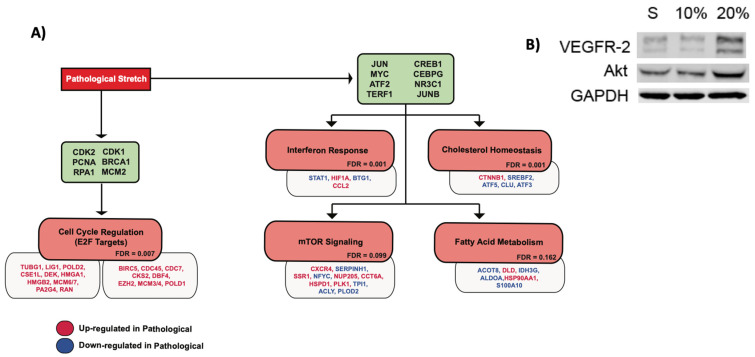
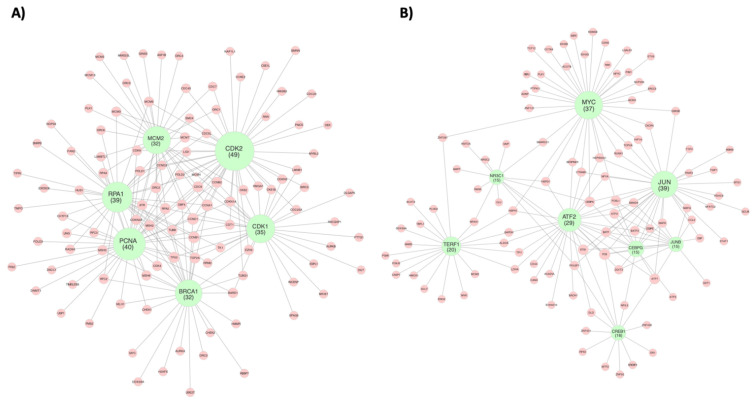
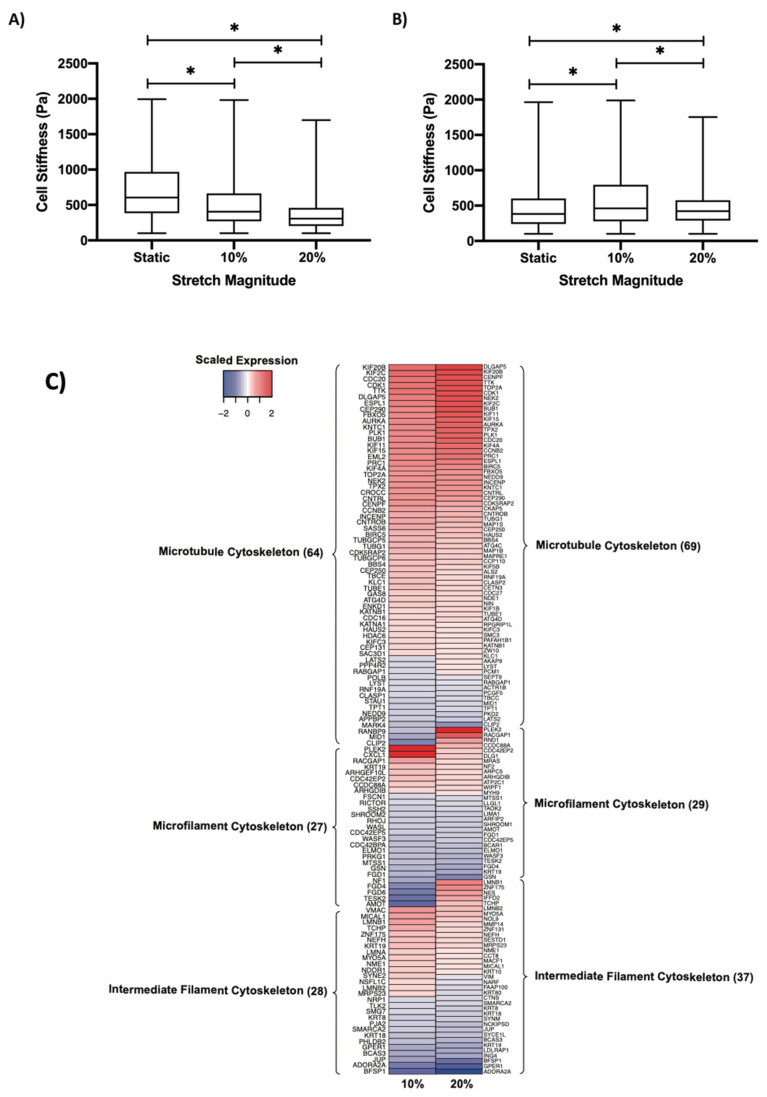
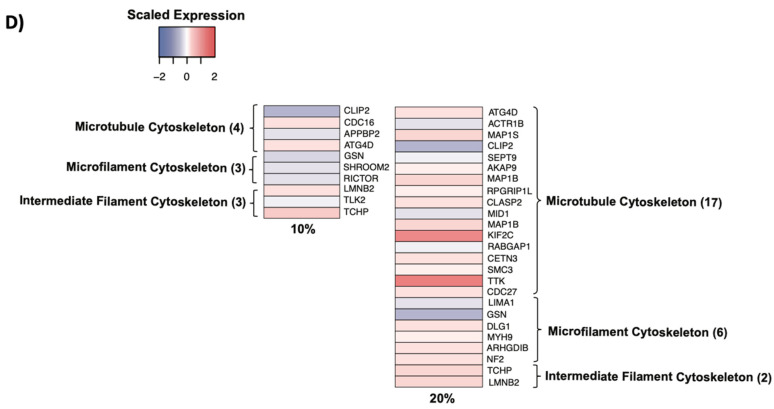
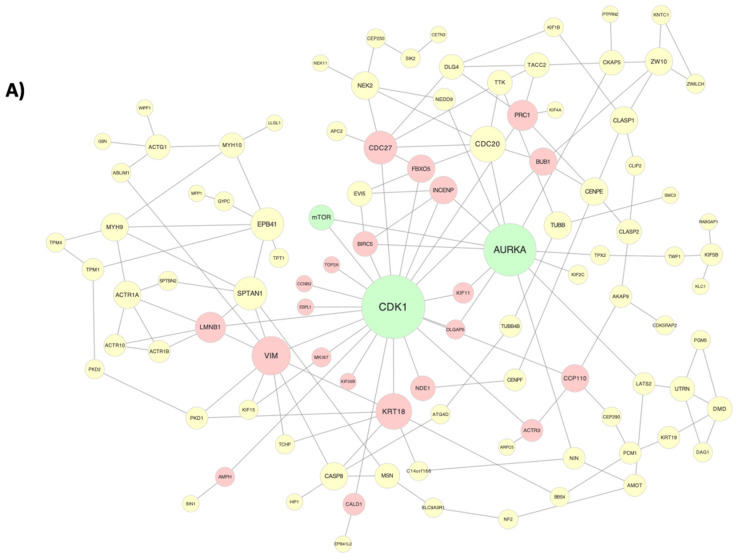
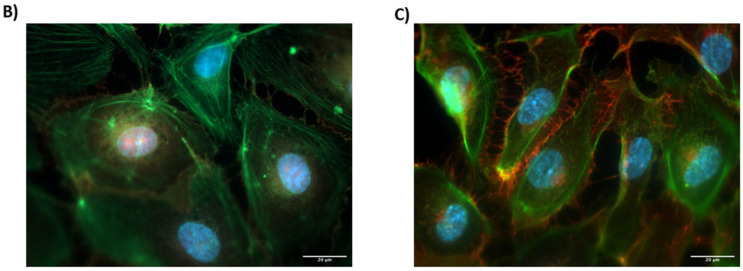
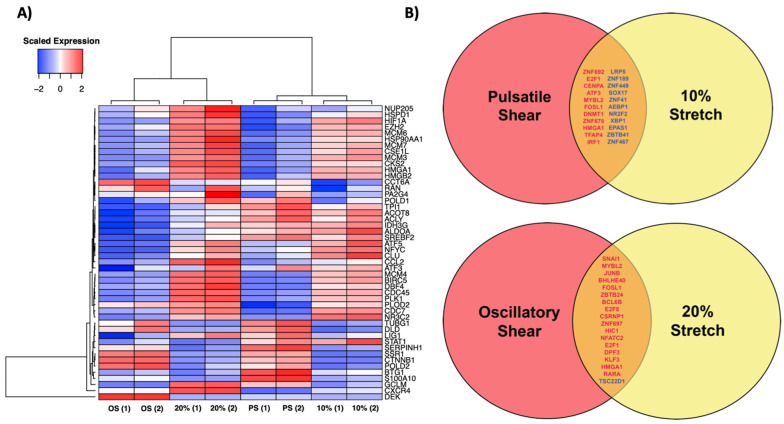
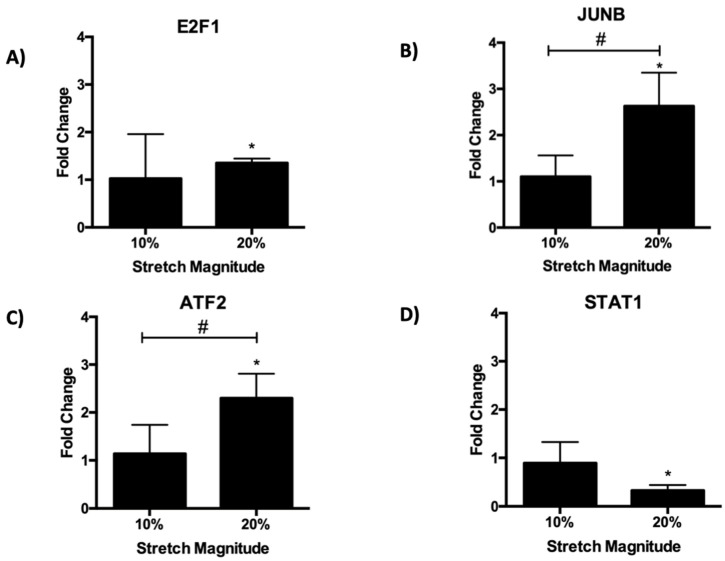
Endothelial cells in vivo are subjected to a wide array of mechanical stimuli, such as cyclic stretch. Notably, a 10% stretch is associated with an atheroprotective endothelial phenotype, while a 20% stretch is associated with an atheroprone endothelial phenotype. Here, a systems biology-based approach is used to present a comprehensive overview of the functional responses and molecular regulatory networks that characterize the transition from an atheroprotective to an atheroprone phenotype in response to cyclic stretch. Using primary human umbilical vein endothelial cells (HUVECs), we determined the role of the equibiaxial cyclic stretch in vitro, with changes to the radius of the magnitudes of 10% and 20%, which are representative of physiological and pathological strain, respectively. Following the transcriptome analysis of next-generation sequencing data, we identified four key endothelial responses to pathological cyclic stretch: cell cycle regulation, inflammatory response, fatty acid metabolism, and mTOR signaling, driven by a regulatory network of eight transcription factors. Our study highlights the dynamic regulation of several key stretch-sensitive endothelial functions relevant to the induction of an atheroprone versus an atheroprotective phenotype and lays the foundation for further investigation into the mechanisms governing vascular pathology. This study has significant implications for the development of treatment modalities for vascular disease.

Keywords: RNA-seq; endothelial cells; mechanotransduction; vascular biology.


Conflict of interest statement

The authors declare no potential conflict of interest.

Figures

Figure 1
Figure 1
Calibration of the biaxial stretch system. (A) Schematic of the sectioned PDMS membrane utilized for calibration. Each box (A–E) is 0.25 cm × 0.25 cm. (B) Membrane displacement after stretch at each of the five locations indicated in (A). (C) Fluorescent image demonstrating staining of actin (green) and DAPI counterstain (blue) after 24 h of static culture on a PDMS membrane at 43× magnification. (D) Fluorescent image demonstrating actin staining (green) and DAPI counterstain (blue) after 24 h of biaxial stretch at 43× magnification. Scale bar represents 20 µm.
Figure 2
Figure 2
Endothelial response to pathological cyclic stretch. (A) Schematic summarizing the endothelial response to pathological magnitudes of cyclic stretch (20%). Green nodes list sets of upstream regulatory genes that correspond to the downstream cellular responses subsequently listed in red nodes. Downstream cellular responses were identified by GSEA analysis. The false discovery rate (FDR) of each identified gene set is listed. An FDR < 0.25 was utilized as the threshold for further investigation. Relevant target genes within each response are listed below the respective node. Target genes colored red are upregulated at 20% stretch while genes colored blue are downregulated at 20% stretch, relative to the static (no stretch) control. (B) Western blot analysis of protein modulators involved in the E2F response to pathological cyclic stretch. S represents expression after 24 h of static culture, 10% represents expression after 24 h of 10% cyclic stretch, and 20% represents expression after 24 h of 20% cyclic stretch.
Figure 3
Figure 3
Regulatory gene networks governing the endothelial response to cyclic stretch. Networks represent (A) endothelial cell cycle regulation and (B) endothelial transcriptional regulation in response to pathological magnitudes of cyclic stretch (20%). Green nodes represent regulatory genes that were identified due to their high number of network connections, which in turn are signified by red nodes representing target genes. Node size of regulatory genes correlates with the number of direct network connections for the respective node. Network was constructed using the GeneMANIA Cytoscape plugin, which utilizes a guilt-by-association approach to map physical interactions between input genes. The input gene list was curated from gene sets identified by GSEA analysis. Only direct first neighbor connections to the regulatory genes are shown here. The full network maps can be seen in Supplementary Figures S1 and S2.
Figure 4
Figure 4
Regulation of the cytoskeleton by cyclic stretch. Cell stiffness of (A) HUVECs and (B) rapamycin-treated HUVECs as determined through AFM. * indicates p < 0.05 between respective groups. (C) Heatmap demonstrating the expression of cytoskeletal component genes grouped into their respective classifications in response to 10% and 20% stretch. (D) Heatmap demonstrating the expression of cytoskeletal mTOR-target genes grouped into their respective classifications in response to 10% and 20% stretch. For both (C,D), expression was normalized to the static (no stretch) control. Cytoskeletal genes were identified through the Molecular Signatures Database.
Figure 4
Figure 4
Regulation of the cytoskeleton by cyclic stretch. Cell stiffness of (A) HUVECs and (B) rapamycin-treated HUVECs as determined through AFM. * indicates p < 0.05 between respective groups. (C) Heatmap demonstrating the expression of cytoskeletal component genes grouped into their respective classifications in response to 10% and 20% stretch. (D) Heatmap demonstrating the expression of cytoskeletal mTOR-target genes grouped into their respective classifications in response to 10% and 20% stretch. For both (C,D), expression was normalized to the static (no stretch) control. Cytoskeletal genes were identified through the Molecular Signatures Database.
Figure 5
Figure 5
Cytoskeletal activation by cyclic stretch. (A) Regulatory network highlighting the connections between cytoskeletal component genes in response to 20% stretch. Green nodes represent central regulators, while red and yellow nodes represent first and second degree connections downstream of CDK1, respectively. (B) Fluorescent image demonstrating staining of actin (green), VE-cadherin staining (red), and DAPI counterstain (blue) after 24 h of static culture on a PDMS membrane at 43× magnification. Scale bar represents 20 µm. (C) Fluorescent image demonstrating actin staining (green), VE-cadherin staining (red), and DAPI counterstain (blue) after 24 h of biaxial stretch at 43× magnification.
Figure 5
Figure 5
Cytoskeletal activation by cyclic stretch. (A) Regulatory network highlighting the connections between cytoskeletal component genes in response to 20% stretch. Green nodes represent central regulators, while red and yellow nodes represent first and second degree connections downstream of CDK1, respectively. (B) Fluorescent image demonstrating staining of actin (green), VE-cadherin staining (red), and DAPI counterstain (blue) after 24 h of static culture on a PDMS membrane at 43× magnification. Scale bar represents 20 µm. (C) Fluorescent image demonstrating actin staining (green), VE-cadherin staining (red), and DAPI counterstain (blue) after 24 h of biaxial stretch at 43× magnification.
Figure 6
Figure 6
Comparison of gene expression changes in response to shear stress and cyclic stretch. (A) Heatmap profiling expression changes of network target genes identified in Figure 3 in response to oscillatory shear, pulsatile shear (PS), 20% stretch, and 10% stretch. OS and PS expression data were compiled from previously published data by Ajami et al., GEO Accession Number GSE103672. For each condition, expression was normalized to the static (no shear/stretch) control and scaled by row. Hierarchical clustering analysis was performed on each column and row. (B) Identification of transcription factors that demonstrated changes in expression between both pulsatile shear and 10% stretch and between both oscillatory shear and 20% stretch. Transcription factors colored in red are upregulated in response to the respective conditions, while transcription factors colored in blue are downregulated.
Figure 7
Figure 7
qPCR validation of RNA-seq. Gene expression of (A) E2F1, (B) JUNB, (C) ATF2, and (D) STAT1 was determined in response to 24 h of 10% and 20% cyclic stretch. Fold change was calculated by normalizing expression to static controls (fold change = 1). * indicates p < 0.05 relative to the static control using one-way ANOVA followed by a post-hoc Fisher’s LSD multiple comparison test, while # indicates p < 0.05 between stretch groups.

References

    1. Charbonier F., Zamani M., Huang N. Endothelial Cell Mechanotransduction in the Dynamic Vascular Environment. Adv. Biosyst. 2018;3:1800252. doi: 10.1002/adbi.201800252. - DOI - PMC - PubMed
    1. Alberio L., Dale G.L. Platelet-collagen interactions: Membrane receptors and intracellular signalling pathways. Eur. J. Clin. Investig. 1999;29:1066–1076. doi: 10.1046/j.1365-2362.1999.00570.x. - DOI - PubMed
    1. Ma J., Ward E., Siegel R., Jemal A. Temporal Trends in Mortality in the United States, 1969–2013. JAMA. 2015;314:1731. doi: 10.1001/jama.2015.12319. - DOI - PubMed
    1. Baeyens N., Bandyopadhyay C., Coon B., Yun S., Schwartz M. Endothelial fluid shear stress sensing in vascular health and disease. J. Clin. Investig. 2016;126:821–828. doi: 10.1172/JCI83083. - DOI - PMC - PubMed
    1. Chistiakov D., Orekhov A., Bobryshev Y. Effects of shear stress on endothelial cells: Go with the flow. Acta Physiol. 2016;219:382–408. doi: 10.1111/apha.12725. - DOI - PubMed

Publication types

Substances

LinkOut - more resources