. 2022 Dec 16;12(12):1890.
doi: 10.3390/biom12121890.

Identification and Validation of Cuproptosis-Related LncRNA Signatures in the Prognosis and Immunotherapy of Clear Cell Renal Cell Carcinoma Using Machine Learning

Affiliations

Identification and Validation of Cuproptosis-Related LncRNA Signatures in the Prognosis and Immunotherapy of Clear Cell Renal Cell Carcinoma Using Machine Learning

Zhixun Bai et al. Biomolecules. .

Abstract

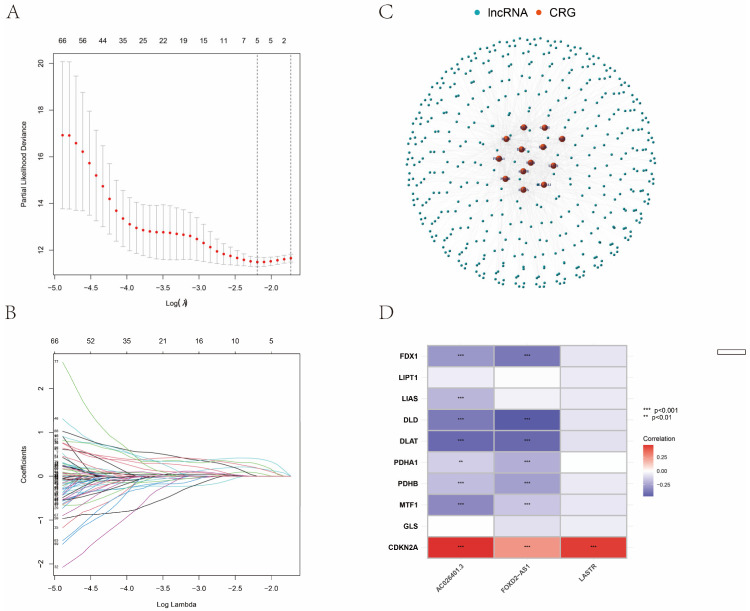
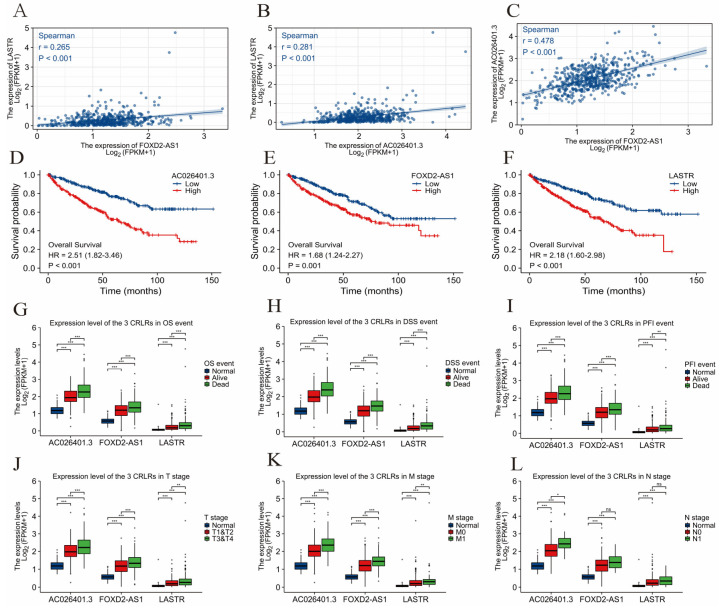
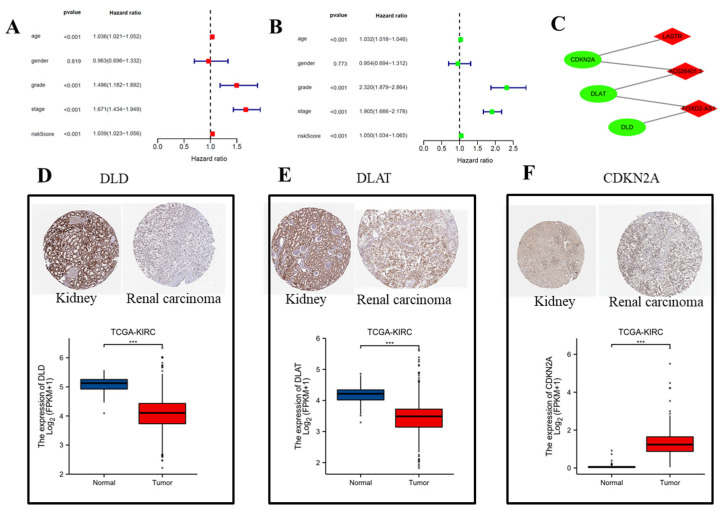
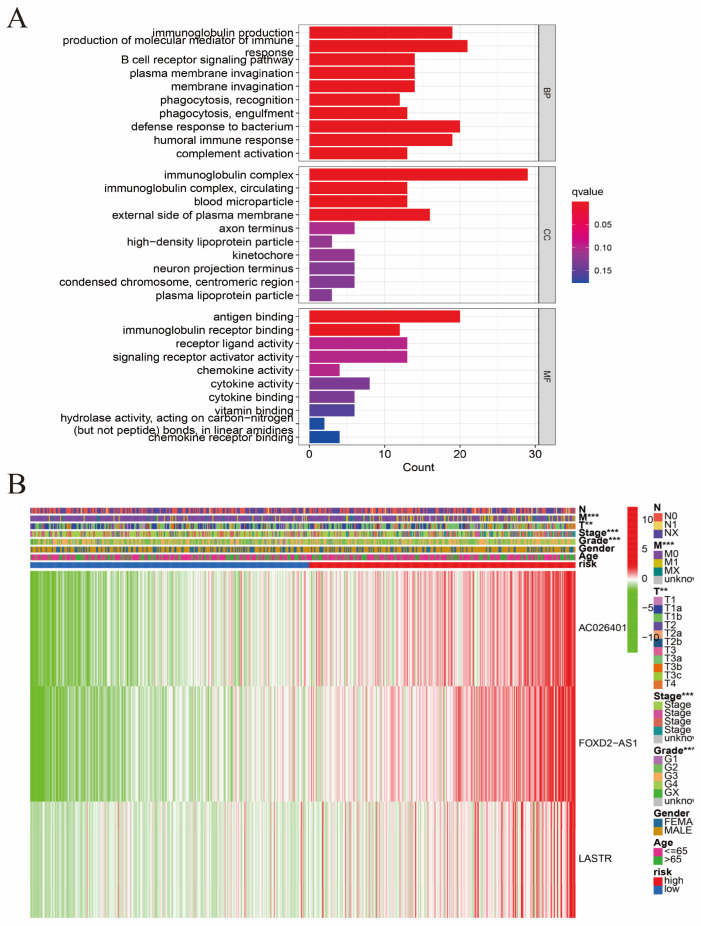
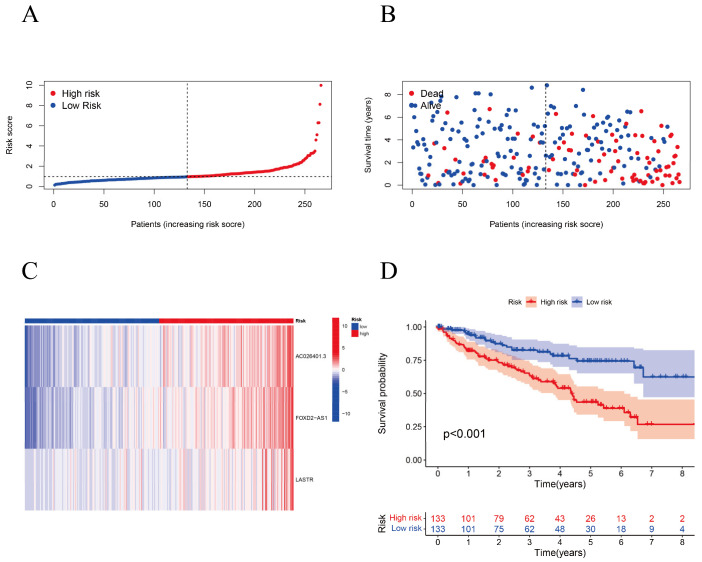
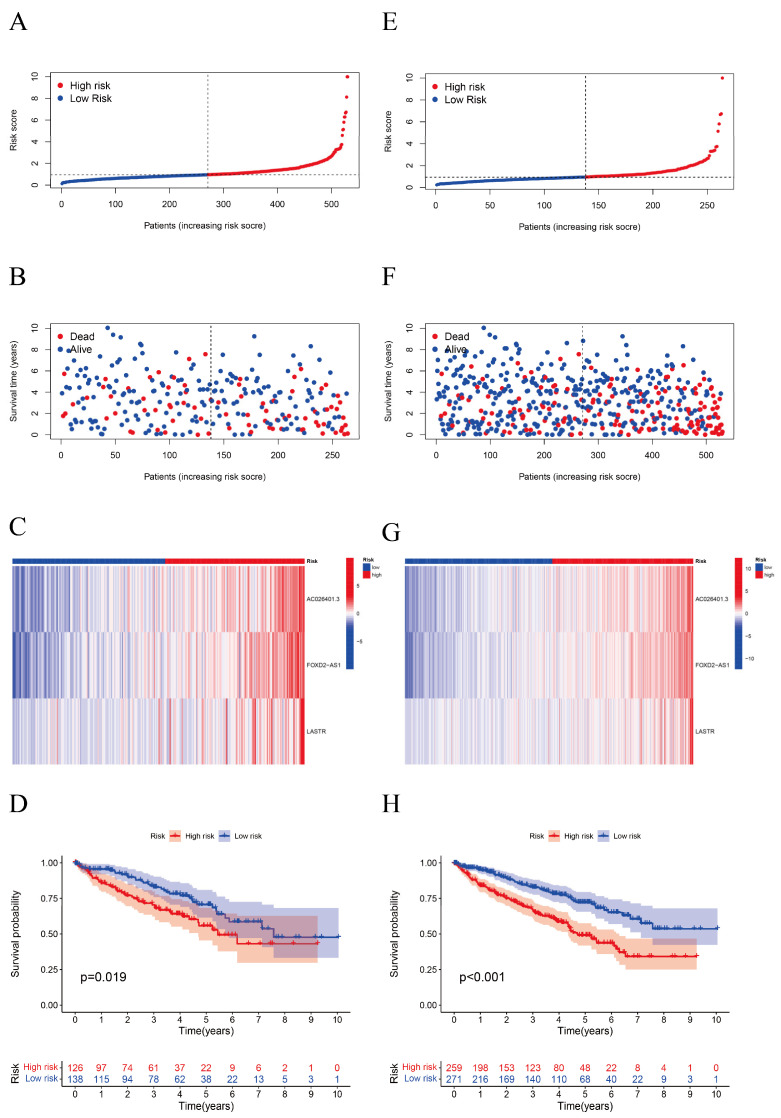
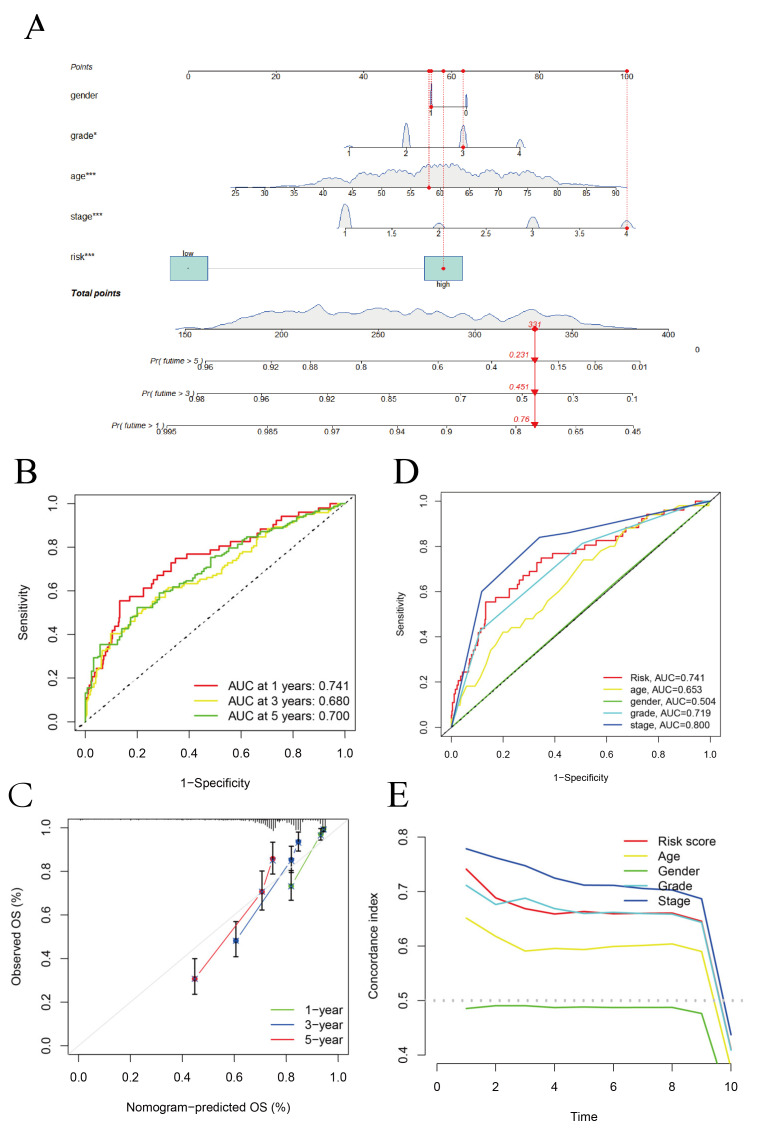
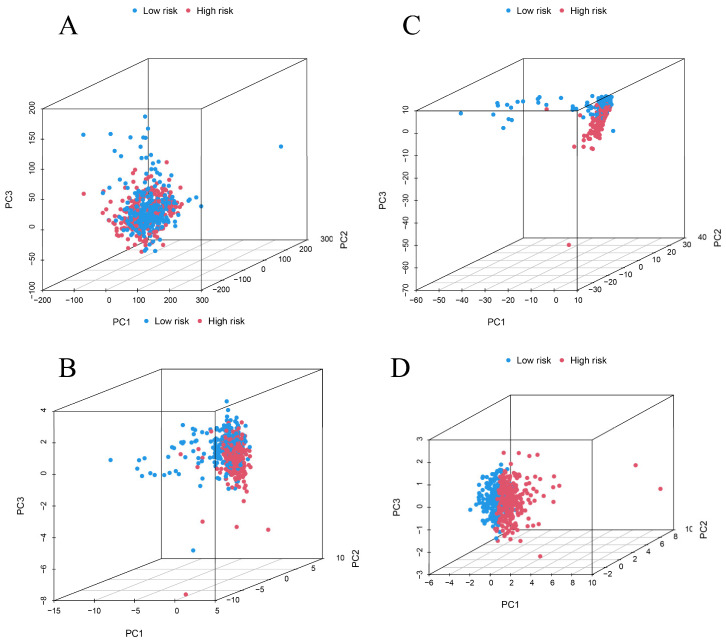
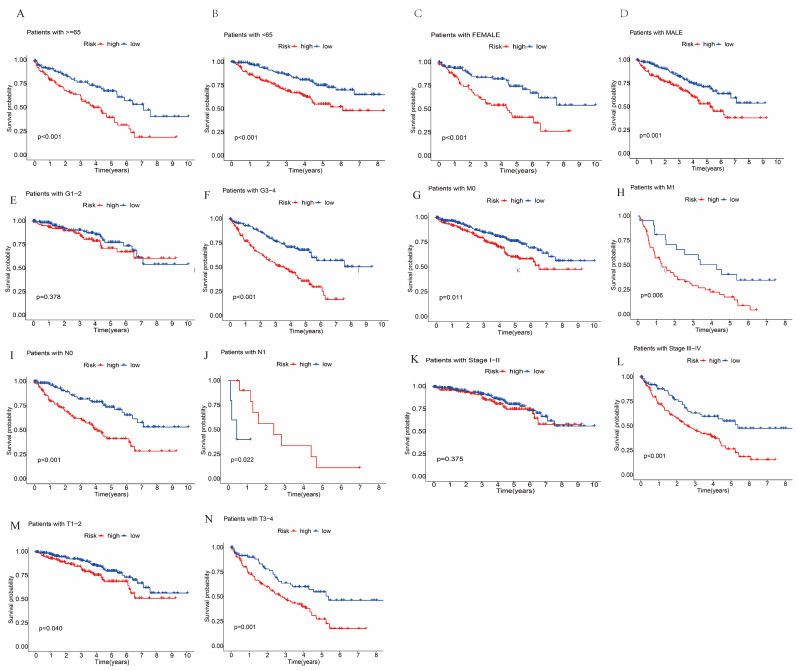
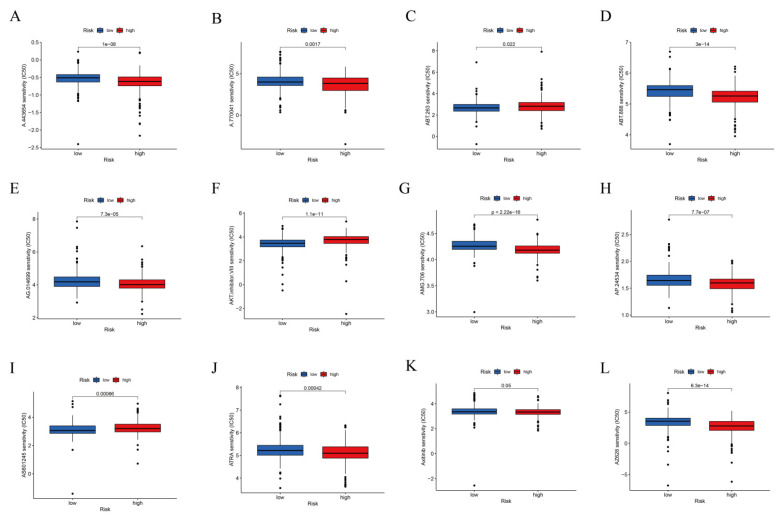
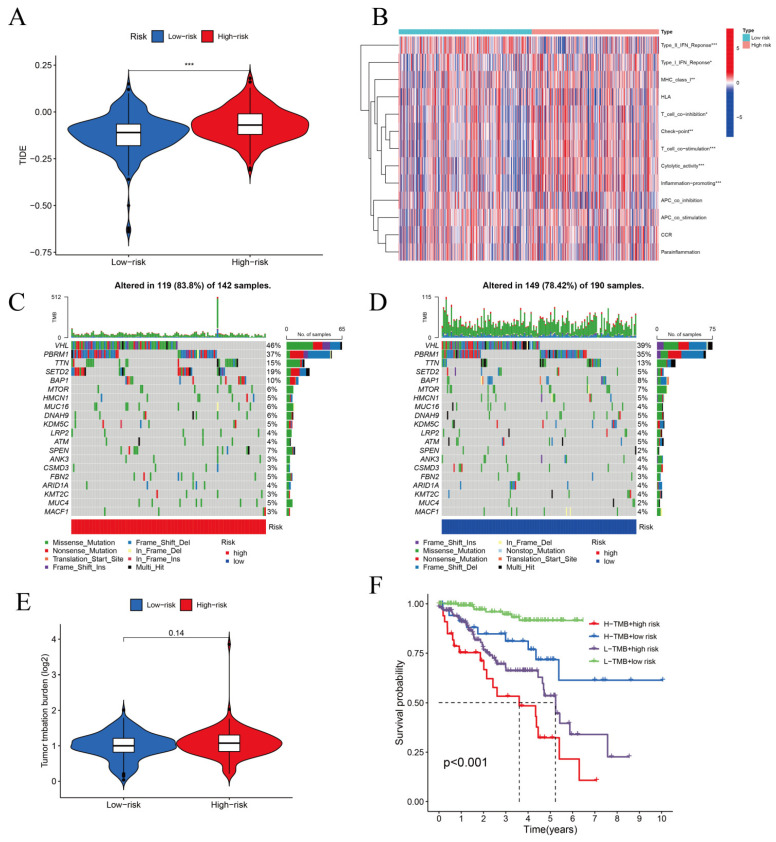
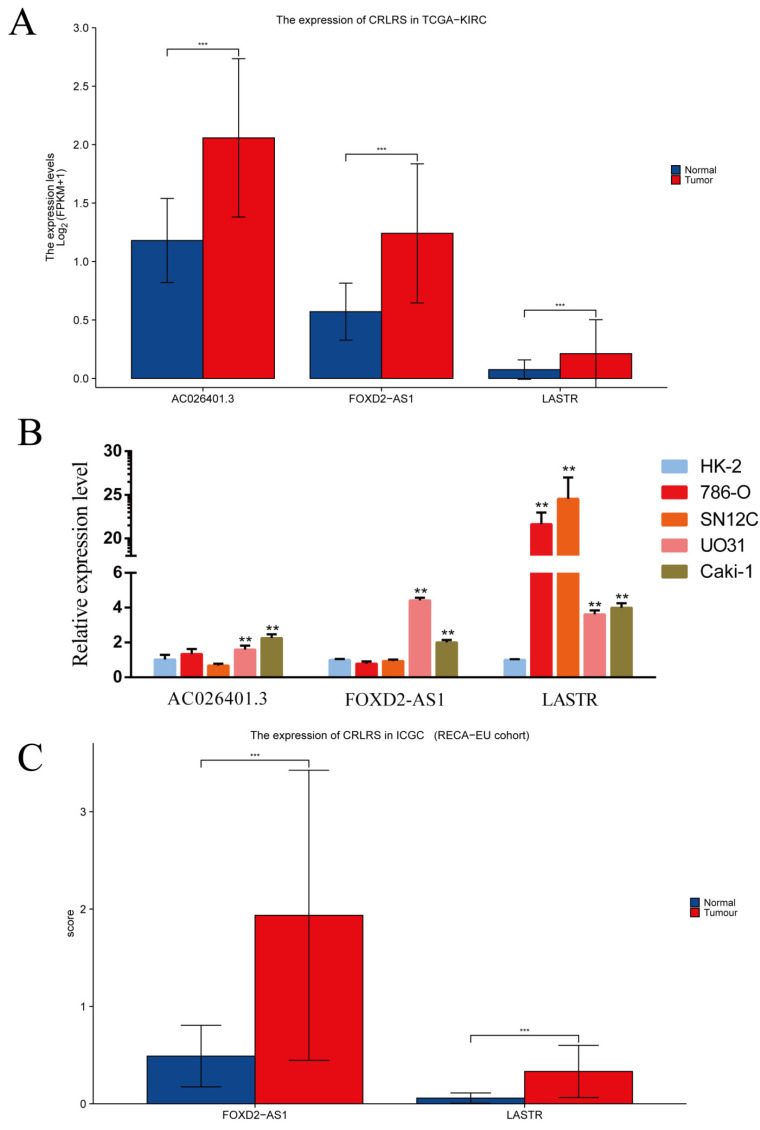
(1) Objective: We aimed to mine cuproptosis-related LncRNAs with prognostic value and construct a corresponding prognostic model using machine learning. External validation of the model was performed in the ICGC database and in multiple renal cancer cell lines via qPCR. (2) Methods: TCGA and ICGC cohorts related to renal clear cell carcinoma were included. GO and KEGG analyses were conducted to determine the biological significance of differentially expressed cuproptosis-related LncRNAs (CRLRs). Machine learning (LASSO), Kaplan-Meier, and Cox analyses were conducted to determine the prognostic genes. The tumor microenvironment and tumor mutation load were further studied. TIDE and IC50 were used to evaluate the response to immunotherapy, a risk model of LncRNAs related to the cuproptosis genes was established, and the ability of this model was verified in an external independent ICGC cohort. LncRNAs were identified in normal HK-2 cells and verified in four renal cell lines via qPCR. (3) Results: We obtained 280 CRLRs and identified 66 LncRNAs included in the TCGA-KIRC cohort. Then, three hub LncRNAs (AC026401.3, FOXD2-AS1, and LASTR), which were over-expressed in the four ccRCC cell lines compared with the human renal cortex proximal tubule epithelial cell line HK-2, were identified. In the ICGC database, the expression of FOXD2-AS1 and LASTR was consistent with the qPCR and TCGA-KIRC. The results also indicated that patients with low-risk ccRCC-stratified by tumor-node metastasis stage, sex, and tumor grade-had significantly better overall survival than those with high-risk ccRCC. The predictive algorithm showed that, according to the three CRLR models, the low-risk group was more sensitive to nine target drugs (A.443654, A.770041, ABT.888, AG.014699, AMG.706, ATRA, AP.24534, axitinib, and AZ628), based on the estimated half-maximal inhibitory concentrations. In contrast, the high-risk group was more sensitive to ABT.263 and AKT inhibitors VIII and AS601245. Using the CRLR models, the correlation between the tumor immune microenvironment and cancer immunotherapy response revealed that high-risk patients are more likely to respond to immunotherapy than low-risk patients. In terms of immune marker levels, there were significant differences between the high- and low-risk groups. A high TMB score in the high-risk CRLR group was associated with worse survival, which could be a prognostic factor for KIRC. (4) Conclusions: This study elucidates the core cuproptosis-related LncRNAs, FOXD2-AS1, AC026401.3, and LASTR, in terms of potential predictive value, immunotherapeutic strategy, and outcome of ccRCC.

Keywords: TMB score; ccRCC; cuproptosis; immunotherapy; lncRNA.


Conflict of interest statement

The authors declare that they have no known competing financial interest or personal relationships that could have appeared to influence the work reported in this paper.

Figures

Figure 1
Figure 1
Research process flowchart.
Figure 2
Figure 2
Identification of CRLRs. (A) The LASSO tuning parameters. (B) The CRLR LASSO coefficient profile. (C) Diagram of the coexpression network for cuproptosis genes and cuproptosis-related LncRNAs. (D) The heatmap for 10 cuproptosis genes with 3 cuproptosis-related LncRNAs. (** p < 0.01, *** p < 0.001).
Figure 3
Figure 3
The clinical correlations analysis of the three CRLRs. (A) The molecular correlation of LASTR and FOXD2-AS1 in TCGA-KIRC. (B) The molecular correlation of LASTR and AC026401.3 in TCGA-KIRC. (C) The molecular correlation of FOXD2-AS1 and AC026401.3 in TCGA-KIRC. (D) K–M curves of AC026401.3 between the different expression level groups in TCGA-KIRC. (E) K–M curves of FOXD2-AS1 between the different expression level groups in TCGA-KIRC. (F) K–M curves of LASTR between the different expression level groups in TCGA-KIRC. (G) Expression level of three CRLRs in OS event. (H) Expression level of three CRLRs in DSS event. (I) Expression level of three CRLRs in PFI event. (J) Expression level of three CRLRs in T stage. (K) Expression level of three CRLRs in M stage. (L) Expression level of three CRLRs in N stage. (* p < 0.05, ** p < 0.01, *** p < 0.001).
Figure 4
Figure 4
Independent prognostic analysis and validation of the effect of expression of real hub genes on transcriptional and translational level using TCGA database and The Human Protein Atlas database. (A) Univariate Cox with clinical variables and CRLRs. (B) Multivariate Cox with clinical variables and CRLRs. (C) Correlations between CRLRs and CRGs (p < 0.05). (D) Comparison of DLD in TCGA-KIRC tumor and normal kidney tissue. (E) Comparison of DLAT in TCGA-KIRC tumor and normal kidney tissue. (F) Comparison of CDKNA2 in TCGA-KIRC tumor and normal kidney tissue. (*** p < 0.001).
Figure 5
Figure 5
Enrichment analysis for CRLRs obtained from GO and correlation analysis. (A) GO enrichment analysis. (B) Heatmap of clinicopathological and biological characteristics of two different risk group subtypes of samples divided by the CRLR model. Differences in clinicopathologic features and expression levels of CRLRs between the two different risk groups. Red represents the high-risk group and blue represents the low-risk group. High lncRNA expression levels are shown in red and low lncRNA expression levels are shown in green. The three CRLRs showed a high expression trend in the high-risk group. CRLRs, cuproptosis-related lncRNAs. (** p < 0.01, *** p < 0.001).
Figure 6
Figure 6
Development of a CRLR risk model in ccRCC. (A) The distribution of the risk grades between the low- and high-risk groups. (B) The survival statistics and survival times of the patients in the two risk groups. (C) The relative expression standards for the three CRLRs. (D) K–M survival curves of ccRCC in the low-risk group and the high-risk group (p < 0.001).
Figure 7
Figure 7
Validation of a CRLR risk model using the testing data set and the entire TCGA-KIRC data set. (A) Risk score distribution in the testing set. The red dots represent the high-risk group and the blue dots represent the low-risk group. (B) OS status for the testing set. The red dots represent dead patients and the blue dots represent living patients. (C) Heatmap for the testing set. (D) Kaplan–Meier curve for OS for the testing set. (E) Risk score distribution for the entire data set. (F) OS status for the entire TCGA-KIRC data set. (G) Heatmap for the entire TCGA-KIRC data set. (H) Kaplan–Meier curve for OS for the entire TCGA-KIRC data set. The red and blue lines represent high and low expressions, respectively. All p values are shown in Figure 7.
Figure 8
Figure 8
Nomogram, AUC, and DCA analysis. (A) Based on the selected CRLR prognostic signature and independent factors in ccRCC (* p < 0.05, *** p < 0.001). (B) The OS of AUC predictive for 1 year, 3 years, and 5 years. (C) Calibration plot of the CRLR nomogram. (D) The AUC of CRLRs and traditional clinical variables. (E) DCA plot of the CRLRs and traditional clinical variables.
Figure 9
Figure 9
PCA analysis. (A) PCA of all genes. (B) PCA of 10 cuproptosis genes. (C) PCA of 280 CRLR genes. (D) PCA of three CRLRs.
Figure 10
Figure 10
K–M curves of different clinical variables between the high-risk and low-risk groups of ccRCC patients in TCGA. (A) K–M curves for age ≥ 65 for the different risk groups of ccRCC patients. (B) K–M curves for age < 65 years for the different risk groups of ccRCC patients. (C) K–M curves for female for the different risk groups of ccRCC patients. (D) K–M curves for male for the different risk groups of ccRCC patients. (E) K–M curves for stages G1–2 for the different risk groups of ccRCC patients. (F) K–M curves for stages G3–4 for the different risk groups of ccRCC patients. (G) K–M curves for stage M0 for the different risk groups of ccRCC patients. (H) K–M curves for stage M1 for the different risk groups of ccRCC patients. (I) K–M curves for stage N0 for the different risk groups of ccRCC patients. (J) K–M curves for stage N1 for the different risk groups of ccRCC patients. (K) K–M curves for stages I–II for the different risk groups of ccRCC patients. (L) K–M curves for stages III–IV for the different risk groups of ccRCC patients. (M) K–M curves for stages T1–2 for the different risk groups of ccRCC patients. (N) K–M curves for stages T3–4 for the different risk groups of ccRCC patients.
Figure 11
Figure 11
IC50 and therapeutic response analysis. The low-risk group is shown in blue on the abscissa, and the high-risk group is shown in red. The IC50 value of drug target sensitivity is shown on the ordinate. (A) A.443654. (B) A.770041. (C) ABT.263. (D) ABT.888. (E) AG.014699. (F) AKT inhibitor VIII. (G) AMG.706. (H) AP.24534. (I) AS601245. (J) ATRA. (K) Axitinib. (L) AZ628. The detailed p values are shown in Figure 11.
Figure 12
Figure 12
TIDE, Immunotherapy, Mutations, TMB, and Kaplan–Meier survival analysis. (A) TIDE analysis for the high- and low-risk groups (*** p < 0.001). (B) Immune indicators for the high- and low-risk groups. (C) Top 20 driver genes for the high-risk group. (D) Top 20 driver genes for the low-risk group. (E) TMB analysis for the two risk groups. (F) Kaplan–Meier survival with TMB status and risk level.
Figure 13
Figure 13
Validation of CRLRs in renal cancer. (A) Expression of CRLRs in TCGA-KIRC. (B) qPCR validation of CRLR expression levels in normal and renal cancer cells and expression levels of three CRLRs in HK-2, UO31, 786-O, SN12C, and Caki-1 cells (** p < 0.01, *** p < 0.001). (C) Expression of CRLRs in the ICGC (RECA-EU) cohort.

Similar articles

Cited by

References

    1. Hyuna S., Jacques F., Siegel R.L., Mathieu L., Isabelle S., Ahmedin J., Freddie B. Global Cancer Statistics 2020: GLOBOCAN Estimates of Incidence and Mortality Worldwide for 36 Cancers in 185 Countries. CA A Cancer J. Clin. 2021;71:209–249. doi: 10.3322/caac.21660. - DOI - PubMed
    1. Signoretti S., Flaifel A., Chen Y., Reuter V.E. Renal Cell Carcinoma in the Era of Precision Medicine: From Molecular Pathology to Tissue-Based Biomarkers. J. Clin. Oncol. 2018;36:3553–3559. doi: 10.1200/JCO.2018.79.2259. - DOI - PMC - PubMed
    1. Peter T., Shannon C., Boryana P., Margaret D., Ana V., Mai A., Jordan R., Lena J., Ranad H., Spangler R.D., et al. Copper induces cell death by targeting lipoylated TCA cycle proteins. Science. 2022;375:1254–1261. doi: 10.1126/science.abf0529. - DOI - PMC - PubMed
    1. Daolin T., Xin C., Guido K. Cuproptosis: A copper-triggered modality of mitochondrial cell death. Cell Res. 2022;32:417–418. doi: 10.1038/s41422-022-00653-7. - DOI - PMC - PubMed
    1. Zhang H., Yu L., Chen J., Liu L., Yang X., Cui H., Yue G. Role of Metabolic Reprogramming of Long non-coding RNA in Clear Cell Renal Cell Carcinoma. J. Cancer. 2022;13:691–705. doi: 10.7150/jca.62683. - DOI - PMC - PubMed

Publication types