. 2022 Dec 7;14(24):6019.
doi: 10.3390/cancers14246019.

A Critical Role of the IL-22-IL-22 Binding Protein Axis in Hepatocellular Carcinoma

Affiliations

A Critical Role of the IL-22-IL-22 Binding Protein Axis in Hepatocellular Carcinoma

Anastasios D Giannou et al. Cancers (Basel). .

Abstract

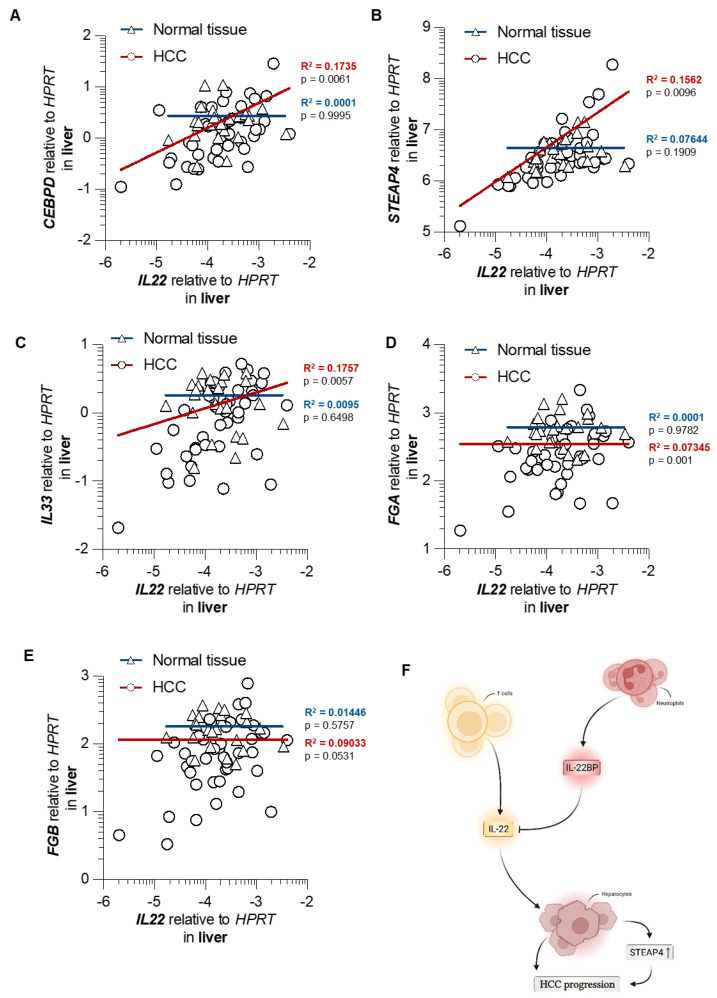
Hepatocellular carcinoma (HCC) ranks among the five most common cancer entities worldwide and leads to hundred-thousands of deaths every year. Despite some groundbreaking therapeutical revelations during the last years, the overall prognosis remains poor. Although the immune system fights malignant transformations with a robust anti-tumor response, certain immune mediators have also been shown to promote cancer development. For example, interleukin (IL)-22 has been associated with HCC progression and worsened prognosis in multiple studies. However, the underlying mechanisms of the pathological role of IL-22-signaling as well as the role of its natural antagonist IL-22 binding protein (IL-22BP) in HCC remain elusive. Here, we corroborate the pathogenic role of IL-22 in HCC by taking advantage of two mouse models. Moreover, we observed a protective role of IL-22BP during liver carcinogenesis. While IL-22 was mainly produced by CD4+ T cells in HCC, IL-22BP was abundantly expressed by neutrophils during liver carcinogenesis. Hepatocytes could be identified as a major target of this pathological IL-22-signaling. Moreover, abrogation of IL-22 signaling in hepatocytes in IL22ra1flox/flox × AlbCre+ mice reduced STEAP4 expression-a known oncogene-in HCC in vivo. Likewise, STEAP4 expression correlated with IL22 levels in human HCC samples, but not in healthy liver specimens. In conclusion, these data encourage the development of therapeutical approaches that target the IL-22-IL-22BP axis in HCC.

Keywords: IL-22; IL-22BP; Th22; hepatocellular carcinoma; neutrophils.


Conflict of interest statement

The authors declare no conflict of interest. The funders had no role in the design of the study; in the collection, analyses, or interpretation of data; in the writing of the manuscript, or in the decision to publish the results.

Figures

Figure 1
Figure 1
IL-22 and IL-22BP display contrary effects in a chemical mouse model of HCC. (A) A schematic timeline describing chemical HCC induction with DEN and TCPOBOP in mice; (B) left: number of macroscopic tumor lesions in livers of 6 -month-old mice that were either wild type (C57BL/6, left, black, n = 7), IL22-deficient (IL22-/-, middle, blue, n = 14) or IL22bp-deficient (IL22bp-/-, right, red, n = 12); right: representative macroscopic pictures; (C) left: tumor volume (in mm3) assessed by MRI in livers of 6 month-old mice after HCC induction that were either wild type (C57BL/6, left, black, n = 7), IL22-deficient (IL22-/-, middle, blue, n = 14) or IL22bp-deficient (IL22bp-/-, right, red, n = 12); right: representative macroscopic pictures; (D) liver weight of 6 -month-old mice after HCC induction that were either wild type (C57BL/6, left, black), IL22-deficient (IL22-/-, middle, blue) or IL22bp-deficient (IL22bp-/-, right, red); (E) serum ALT levels (in U/l) of 6-month-old mice after HCC induction that were either wild type (C57BL/6, left, black), IL22-deficient (IL22-/-, middle, blue) or IL22bp-deficient (IL22bp-/-, right, red). Data are pooled from 2 independent experiments. Data presented as mean ± SEM. ns: p > 0.05; *: p < 0.05; **: p ≤ 0.01; ***: p ≤ 0.001 as assessed by Mann–Whitney U test.
Figure 2
Figure 2
IL-22 and IL-22BP display contrary effects in a nutrition-based mouse model for HCC. (A) A schematic timeline describing the used nutrition-based HCC induction with CD-HFD in mice; (B) left: number of macroscopic tumor lesions in livers of 6 -month-old mice that were either wild type (C57BL/6, left, black, n = 5), IL22-deficient (IL22-/-, middle, blue, n = 7) or IL22bp-deficient (IL22bp-/-, right, red, n = 6); right: representative macroscopic pictures; (C) left: tumor volume (in mm3) assessed by MRI in livers of month-old mice after CD-HFD feeding that were either wild type (C57BL/6, left, black, n = 5), IL22-deficient (IL22-/-, middle, blue, n = 7) or IL22bp-deficient (IL22bp-/-, right, red, n = 6); right: representative macroscopic pictures; (D) liver weight of 6 -month-old mice after CD-HFD feeding that were either wild type (C57BL/6, left, black), IL22-deficient (IL22-/-, middle, blue) or IL22bp-deficient (IL22bp-/-, right, red); (E) serum ALT levels (in U/l) of 6-month-old mice after CD-HFD feeding that were either wild type (C57BL/6, left, black), IL22-deficient (IL22-/-, middle, blue) or IL22bp-deficient (IL22bp-/-, right, red). Data are pooled from 2 independent experiments. Data presented as mean ± SEM. ns: p > 0.05; *: p < 0.05; **: p ≤ 0.01; ***: p ≤ 0.001 as assessed by Mann–Whitney U test.
Figure 3
Figure 3
Th22 cells and neutrophils comprise the major cellular sources of IL-22 and IL-22BP in HCC, respectively. (A) A schematic timeline describing chemical HCC induction with DEN and TCPOBOP in mice; (B) unbiased tSNE-analysis of CD45+ leucocytes analyzed with FACS isolated from the healthy murine liver (upper panel, n = 5) or murine liver after chemical induction of HCC (lower panel, n = 5), color change indicates levels of IL-22 (left panels) or IL-17A (right panels); (C) left: representative FACS dot plots of CD45+ CD3+ CD4+ Foxp3- leucocytes analyzed with FACS isolated from the healthy murine liver (left) or murine liver after chemical induction of HCC (right); right: percentage of IL-17A+IL-22- (left), IL-17A+IL-22+ (middle) and IL-17A-IL-22+ (right) CD45+ CD3+ CD4+ Foxp3- leucocytes analyzed with FACS isolated from the healthy murine liver (black, n = 5) or murine liver after chemical induction of HCC (red, n = 5); (D) relative expression of IL22 in comparison to HPRT of indicated leucocyte subsets isolated from either healthy murine liver (black, n = 3 pooled samples of sorted cells, for each pooled sample 4 mice were used) or murine liver after chemical induction of HCC (red, n = 3 pooled samples of sorted cells, for each pooled sample 4 mice were used). (E) relative expression of IL22bp in comparison to HPRT of indicated leucocyte subsets isolated from either healthy murine liver (black, n = 12) or murine liver after chemical induction of HCC (red, n = 12). Leucocytes were all cell-sorted on CD45+ and then on indicated markers. Data are pooled from 2 independent experiments. Data presented as mean ± SEM. ns: p > 0.05; *: p < 0.05; **: p ≤ 0.01 as assessed by Mann–Whitney U test.
Figure 4
Figure 4
IL-22 signaling in hepatocytes promotes HCC development. (A) A schematic timeline describing chemical HCC induction with DEN and TCPOBOP in mice; (B) left: number of macroscopic tumor lesions in livers of 6-month-old mice that were either wild type (C57BL/6, left, black, n = 9), or IL22ra1-deficient (IL22ra1-/-, right, blue, n = 8); middle: representative macroscopic pictures; right: representative MRI pictures; (C) left: number of macroscopic tumor lesions in livers of 6-month-old mice that were either controls (IL22ra1+/+;AlbCre+, left, black, n = 9), or deficient for IL22ra1 on hepatocytes (IL22ra1flox/flox; AlbCre+, right, blue, n = 8); middle: representative macroscopic pictures; right: representative MRI pictures; (D) left: number of macroscopic tumor lesions in livers of 6-month-old mice that were either controls (IL22ra1+/+;Cdh5Cre+, left, black, n = 9), or deficient for IL22ra1 on endothelial cells (IL22ra1flox/flox; Cdh5Cre+, right, blue, n = 8); middle: representative macroscopic pictures; right: representative MRI pictures. Data are pooled from 2 independent experiments. Data presented as mean ± SEM. ns: p > 0.05; ***: p ≤ 0.001 as assessed by Mann–Whitney U test.
Figure 5
Figure 5
IL-22 signaling induces transcriptional changes in murine hepatocytes. (A) A schematic picture describing the experimental setup; (B) volcano-plot depicting the differently expressed genes in hepatocytes upon in vitro PBS-stimulation (left, n = 3) versus rIL-22 stimulation (right, n = 3); (C) heatmap and hierarchical clustering of differentially expressed genes in hepatocytes upon in vitro IL-22 stimulation (left, n = 3) versus PBS-stimulation (right, n = 3); (D) relative expression of STEAP4, IL33, FGA, FGB and CEBPD in comparison to HPRT in murine hepatocytes that were either stimulated with 0.1% BSA as control (black, n = 6) or rIL-22 (red, n = 10); (E) relative expression of STEAP4, IL33, FGA, FGB and CEBPD in comparison to HPRT in the livers of IL22ra1+/+; AlbCre+ (black, n = 9) or IL22ra1flox/flox; AlbCre+ (red, n = 8) 6-month-old mice that underwent chemical HCC induction as outlined above; (F) relative expression of STEAP4, IL33, FGA, FGB and CEBPD in comparison to HPRT in the livers of IL22ra1+/+;Cdh5Cre+ (black, n = 9) or IL22ra1flox/flox; Cdh5Cre+ (red, n = 8) mice 6 months after chemical HCC induction. Data are pooled from 2 independent experiments. Data presented as mean ± SEM. ns: p > 0.05; *: p < 0.05; **: p ≤ 0.01; ***: p ≤ 0.001 as assessed by Mann–Whitney U test.
Figure 6
Figure 6
IL22 expression is associated with the expression of CEBPD, STEAP4, and IL33 in HCC but not in healthy livers. (A) correlation of relative expression of IL22 and CEBPD in comparison to HPRT in liver samples with HCC (red, n = 42) and in normal liver tissue (blue, n = 24); (B) correlation of relative expression of IL22 and STEAP4 in comparison to HPRT in liver samples with HCC (red, n = 42) and in normal liver tissue (blue, n = 24); (C) correlation of relative expression of IL22 and IL33 in comparison to HPRT in liver samples with HCC (red, n = 42) and in normal liver tissue (blue, n = 24); (D) correlation of relative expression of IL22 and FGA in comparison to HPRT in liver samples with HCC (red, n = 42) and in normal liver tissue (blue, n = 24). (E) correlation of relative expression of IL22 and FGB in comparison to HPRT in liver samples with HCC (red, n = 42) and in normal liver tissue (blue, n = 24). Displayed are all samples with detectable IL22 expression from 60 samples analyzed of HCC and 37 samples analyzed of healthy livers. Each data point represents one patient sample. (F) graphical representation depicting the role of the IL-22−IL-22BP axis in HCC.

Similar articles

Cited by

References

    1. Pinter M., Trauner M., Peck-Radosavljevic M., Sieghart W. Cancer and liver cirrhosis: Implications on prognosis and management. ESMO Open. 2016;1:e000042. doi: 10.1136/esmoopen-2016-000042. - DOI - PMC - PubMed
    1. Bray F., Ferlay J., Soerjomataram I., Siegel R.L., Torre L.A., Jemal A. Global cancer statistics 2018: GLOBOCAN estimates of incidence and mortality worldwide for 36 cancers in 185 countries. CA Cancer J. Clin. 2018;68:394–424. doi: 10.3322/caac.21492. - DOI - PubMed
    1. Park J.W., Chen M., Colombo M., Roberts L.R., Schwartz M., Chen P.J., Kudo M., Johnson P., Wagner S., Orsini L.S., et al. Global patterns of hepatocellular carcinoma management from diagnosis to death: The BRIDGE Study. Liver Int. 2015;35:2155–2166. doi: 10.1111/liv.12818. - DOI - PMC - PubMed
    1. Villanueva A. Hepatocellular Carcinoma. N. Engl. J. Med. 2019;380:1450–1462. doi: 10.1056/NEJMra1713263. - DOI - PubMed
    1. Huang A., Yang X.R., Chung W.Y., Dennison A.R., Zhou J. Targeted therapy for hepatocellular carcinoma. Signal Transduct. Target. Ther. 2020;5:146. doi: 10.1038/s41392-020-00264-x. - DOI - PMC - PubMed

LinkOut - more resources