. 2022 Dec 13;14(24):6154.
doi: 10.3390/cancers14246154.

Prostacyclin Released by Cancer-Associated Fibroblasts Promotes Immunosuppressive and Pro-Metastatic Macrophage Polarization in the Ovarian Cancer Microenvironment

Affiliations

Prostacyclin Released by Cancer-Associated Fibroblasts Promotes Immunosuppressive and Pro-Metastatic Macrophage Polarization in the Ovarian Cancer Microenvironment

Leah Sommerfeld et al. Cancers (Basel). .

Abstract

Metastasis of high-grade ovarian carcinoma (HGSC) is orchestrated by soluble mediators of the tumor microenvironment. Here, we have used transcriptomic profiling to identify lipid-mediated signaling pathways encompassing 41 ligand-synthesizing enzymes and 23 cognate receptors in tumor, immune and stroma cells from HGSC metastases and ascites. Due to its strong association with a poor clinical outcome, prostacyclin (PGI2) synthase (PTGIS) is of particular interest in this signaling network. PTGIS is highly expressed by cancer-associated fibroblasts (CAF), concomitant with elevated PGI2 synthesis, whereas tumor-associated macrophages (TAM) exhibit the highest expression of its surface receptor (PTGIR). PTGIR activation by PGI2 agonists triggered cAMP accumulation and induced a mixed-polarization macrophage phenotype with altered inflammatory gene expression, including CXCL10 and IL12A repression, as well as reduced phagocytic capability. Co-culture experiments provided further evidence for the interaction of CAF with macrophages via PGI2, as the effect of PGI2 agonists on phagocytosis was mitigated by cyclooxygenase inhibitors. Furthermore, conditioned medium from PGI2-agonist-treated TAM promoted tumor adhesion to mesothelial cells and migration in a PTGIR-dependent manner, and PTGIR activation induced the expression of metastasis-associated and pro-angiogenic genes. Taken together, our study identifies a PGI2/PTGIR-driven crosstalk between CAF, TAM and tumor cells, promoting immune suppression and a pro-metastatic environment.

Keywords: carcinoma-associated fibroblasts; high-grade serous ovarian carcinoma; pro-metastatic phenotype; prostacyclin; signaling network; tumor-associated macrophages.


Conflict of interest statement

The authors declare no conflict of interest.

Figures
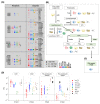
Figure 1
Figure 1
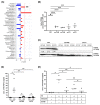
Cell-type-selective biosynthesis of lipid mediators and their targets in the omental TME. (A) Schematic representation of expression patterns of genes coding for key enzymes involved in lipid mediator synthesis or encoding lipid receptors in 8 different cell types as indicated (red: ascTU; pink: omTU; blue: ascTAM; cyan: omTAM; green: ascTAT; yellow: adipocytes; brown: mesothelial cells; black: CAFs after short-term culture in the presence of ascites). The sizes of the filled squares indicate the level of expression determined by RNA-Seq (high: median TPM > 100; intermediate: median TPM 10–100; low: median TPM 0.3–10). ENPP: autotaxin; FFAs: free fatty acids; LIPE: lipase E; LPA: lysophosphatidic acid; PLA2: phospholipase A2; PTG: prostaglandin; PGI2: prostacyclin. (B) Schematic summary of cell-type-selective steps in the biosynthesis of lipid mediators. The AA-PGH2-PGI2 pathways driven by COX1/2 and PTGIS is highlighted as green shaded areas. (C) Cell-type-selectivity of PGI2 receptor gene (PTGIR) expression. (D) Expression of genes involved in PGI2/prostacyclin synthesis (PTGS1, PTGS2, PTGIS) and signaling (PTGIR) based on RNA-Seq data. Protein names are shown at the top. The same samples as in Figure 1A were analyzed. The arrows indicate the selective expression of PTGIS in CAF and MESO, and the elevated expression of PTGIR in ascTAM.
Figure 2
Figure 2
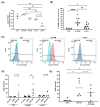
Validation of cell-type-selective PTGIS expression and PGI2 synthesis. (A) Association of PTGIS expression with overall survival (OS) for different cancer entities based on the PRECOG database [34]. Red: positive z-scores (hazard ratio > 1); blue: negative z-scores (hazard ratio < 1). A z-score of |1.96| equals a p value of 0.05. Significance thresholds are indicated by dashed blue and red lines. (B) RT-qPCR analysis of PTGIS mRNA expression in CAF, TAM (ascTAM, omTAM) and tumor cells (ascTU, omTU) from n = 3 different patients (patients are distinguished by different symbols). *** p < 0.001; **** p < 0.0001 by unpaired t test. (C) Detection of PTGIS protein in CAF, ascTAM and ascTU by immunoblot (n = 3; patient; OC…: patient identifiers). β-actin was used as loading control. (D) MS-based quantification of 6k-PGF (stable degradation product of PGI2) in conditioned media (CM) from CAF, ascTAM, and ascTU after serum deprivation in the presence of 50 µM AA for 24 h. Controls without AA are included for each cell type. * p < 0.05; ** p < 0.01 by unpaired t test (Comparison of different cell types) and paired t test (Ctrl vs. AA-treated cells). (E) Effect of COX1/2 inhibitors on PGI2 biosynthesis by CAF. Concentrations of 6k-PGF were measured by MS in CM of CAF under serum-free conditions in the presence of 50 µM AA and either 1 µM COX1 inhibitor SC-560 and/or 10 µM COX2 inhibitor celecoxib for 24 h. * p < 0.05; ** p < 0.01 by paired t test. Horizontal bars show the mean.
Figure 3
Figure 3
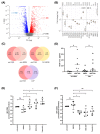
PTGIR expression and signaling in cell types of the HGSC TME. (A) RT-qPCR analysis of PTGIS mRNA expression in CAF, TAM (ascTAM, omTAM) and tumor cells (ascTU, omTU) from n = 3 different patients (patients are distinguished by different symbols). * p < 0.05; ** p < 0.01 by unpaired t test (Comparison of different cell types) and paired t test (matched pairs of omental and ascites-derived cells). (B) Detection of surface expression of PTGIR by flow cytometry in CAF, ascTAM and ascTU. Percentage of positive cells are indicated. Symbols represent different patients (n = 8 for CAF; n = 10 for ascTAM; n = 9 for ascTU). * p < 0.05; ** p < 0.01, **** p < 0.0001 by unpaired t test. (C) Exemplary histograms of PTGIR staining. (D) Analysis of intracellular cAMP accumulation upon stimulation of CAF, ascTAM and ascTU with 100 nM MRE-269 for 15 min under serum-free conditions. Untreated cells and solvent-treated cells (DMSO) were included as controls. Symbols represent different patients (n = 4 for CAF; n = 6 for ascTAM; n = 3 for ascTU). * p < 0.05 by paired t test. (E) Repression of cAMP accumulation in asc-MDM pretreated with 1 µM PTGIR antagonist CAY10449 (1 h) before stimulation with MRE-269. Symbols represent different patients (n = 6). * p < 0.05 by paired t test. Horizontal bars show the mean.
Figure 4
Figure 4
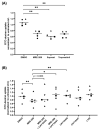
Regulation of the transcriptome and polarization state of macrophages by PGI2 analogs. (A), Volcano plot depicts genes regulated by MRE-269. ascTAM were treated with 1 µM MRE-269 or solvent control (DMSO) for 5 h and analyzed by RNA-Seq. Red: sites upregulated by MRE-269 relative to solvent control (FC > 1 and FDR < 0.05). Blue: downregulated sites (FC < 1 and FDR < 0.05). Grey: FDR ≥ 0.05. (B) Expression of M1 and M2 marker genes, expressed as the fold change of MRE-269-treated cells relative to solvent control (RNA-Seq data; n = 4 biological replicates). Boxplots show the median (line), upper and lower quartiles (box), range (whiskers) and outliers (circles). * FDR < 0.05; ** FDR < 0.01; *** FDR < 0.001; **** FDR < 0.0001; ns, not significant by EdgeR paired test. (C) Venn diagrams illustrating the overlaps of gene sets upregulated by MRE-269 in ascTAM, TAM-like MDM differentiated in the presence of ascites (asc-MDM) and M1-polarized MDM (top 100 genes by FDR in each case). (D) Secretion of VEGF by ascTAM and asc-MDM after stimulation with 100 nM MRE-269 under serum-free conditions measured by ELISA. DMSO: solvent control. Horizontal bars indicate the mean. * p < 0.05 by paired t test. (E,F) Flow cytometry analysis CD86 (E) and CD206/MRC1 (F) on asc-MDM treated with 100 nM of the PGI2 analogs MRE-269, iloprost or trepostinil for 24 h. MFI was expressed relative to untreated controls. Horizontal bars show the mean. * p < 0.05; ns: non-significant by paired t test.
Figure 5
Figure 5
Functions of genes regulated by the PGI2 analog MRE-269. (A) Functional annotation of MRE-269-regulated genes (as in Figure 4A) using the over-representation tool of ConsensusPathDB [32]. The plot depicts the top 12 (by FDR) specific terms. Overlap: percentage of genes in the query set compared to the set representing the respective term. (B) Cytokine genes associated with the term “metastasis” in the genecards.org database and upregulated by MRE-269 (FDR < 0.05). (C) Metastasis-associated genes coding for ECM components and proteases of the TME significantly upregulated by MRE-269. (D) Cytokine genes significantly downregulated by MRE-269. (E) Genes involved in prostaglandin synthesis significantly upregulated by MRE-269. Boxplots show the median (line), upper and lower quartiles (box), range (whiskers) and outliers (circles). * FDR < 0.05; ** FDR < 0.01; *** FDR < 0.001; **** FDR < 0.0001; ns, not significant by EdgeR paired test.
Figure 6
Figure 6
Influence of PGI2 analogs on macropinocytotic activity of asc-MDM. (A) Macropinocytosis was determined by FITC-dextran uptake by asc-MDM after stimulation with 100 nM MRE-269, iloprost or trepostinil or DMSO (solvent control) for 30 min (n = 5; donors are distinguished by different symbols). Results were normalized to untreated controls. (B) Macropinocytosis of asc-MDM treated with 1 µM PTGIR antagonist (CAY10449 or CAY10441) prior to stimulation with MRE-269 or DMSO. To test for a role of PPARβ/δ in inhibiting macropinocytosis, asc-MDM were stimulated with 1 µM L165041. * p < 0.05, ** p < 0.01 by paired t test. Horizontal bars show the mean.
Figure 7
Figure 7
Pro-tumorigenic functions of PGI2-induced TAM secretomes. (A) Migration of primary ascTU pretreated for 24 h with conditioned media (CM) from ascTAM stimulated with MRE-269 (100 nM), MRE-269 (100 nM) + CAY10449 (1 µM) or PPARβ/δ agonist L165041 (1 µM). CM from ascTAM treated with DMSO was included as control. Migration was assessed in a Transwell format with 10% FCS as chemoattractant after 24 h and quantified relative to CM from DMSO control with primary ascTU from n = 2 patients (different colors) and TAM-conditioned medium from n = 6 patients (different symbols). (B) Representative microscopic pictures of migrated tumor cells after 24 h exposure to CM from ascTAM. (C) Adhesion of primary ascTU cells to a confluent monolayer of peritoneal mesothelial cells (MESO). ascTU (from n = 2 patients, indicated by different colors) were preincubated with CM from ascTAM (from n = 6 patients) stimulated as described above and labeled with CellTracker Green. Adhesion of ascTU to the MESO layer was evaluated in comparison to CM from ascTAM stimulated with DMSO as solvent control after 2 h of co-culture. (D) Representative microscopic pictures of tumor cell adhesion to MESO monolayer after 2 h exposure. Tumor cells were pretreated with CM from ascTAM pretreated with different ligands as indicated. Intactness of the MESO monolayer was verified by staining for the tight junctions scaffolding protein zonula occludens 1 (ZO1) (Supplementary Figure S1). One of the samples analyzed was a low-grade mucinous carcinoma (black triangles in A and C), which was not known at the time of the analysis (OC233 in Table S1). All other samples were isolated from HGSC patients. The data suggest that the effect of MRE-269 is not limited to HGSC. * p < 0.05, ** p < 0.01, by paired t test. Horizontal bars show the mean.
Figure 8
Figure 8
Schematic summary of the PGI2-mediated crosstalk in the OC microenvironment.

Similar articles

Cited by

References

    1. Reinartz S., Lieber S., Pesek J., Brandt D.T., Asafova A., Finkernagel F., Watzer B., Nockher W.A., Nist A., Stiewe T., et al. Cell type-selective pathways and clinical associations of lysophosphatidic acid biosynthesis and signaling in the ovarian cancer microenvironment. Mol. Oncol. 2019;13:185–201. doi: 10.1002/1878-0261.12396. - DOI - PMC - PubMed
    1. Reinartz S., Finkernagel F., Adhikary T., Rohnalter V., Schumann T., Schober Y., Nockher W.A., Nist A., Stiewe T., Jansen J.M., et al. A transcriptome-based global map of signaling pathways in the ovarian cancer microenvironment associated with clinical outcome. Genome Biol. 2016;17:108. doi: 10.1186/s13059-016-0956-6. - DOI - PMC - PubMed
    1. Dietze R., Hammoud M.K., Gómez-Serrano M., Unger A., Bieringer T., Finkernagel F., Sokol A.M., Nist A., Stiewe T., Reinartz S., et al. Phosphoproteomics identify arachidonic-acid-regulated signal transduction pathways modulating macrophage functions with implications for ovarian cancer. Theranostics. 2021;11:1377–1395. doi: 10.7150/thno.52442. - DOI - PMC - PubMed
    1. Hammoud M.K., Dietze R., Pesek J., Finkernagel F., Unger A., Bieringer T., Nist A., Stiewe T., Bhagwat A.M., Nockher W.A., et al. Arachidonic acid, a clinically adverse mediator in the ovarian cancer microenvironment, impairs JAK-STAT signaling in macrophages by perturbing lipid raft structures. Mol. Oncol. 2022;16:3146–3166. doi: 10.1002/1878-0261.13221. - DOI - PMC - PubMed
    1. Kobayashi K., Omori K., Murata T. Role of prostaglandins in tumor microenvironment. Cancer Metastasis Rev. 2018;37:347–354. doi: 10.1007/s10555-018-9740-2. - DOI - PubMed

LinkOut - more resources