. 2022 Dec 15;14(24):6193.
doi: 10.3390/cancers14246193.

Characterization of Glioblastoma Cells Response to Regorafenib

Affiliations

Characterization of Glioblastoma Cells Response to Regorafenib

Maria Patrizia Mongiardi et al. Cancers (Basel). .

Abstract

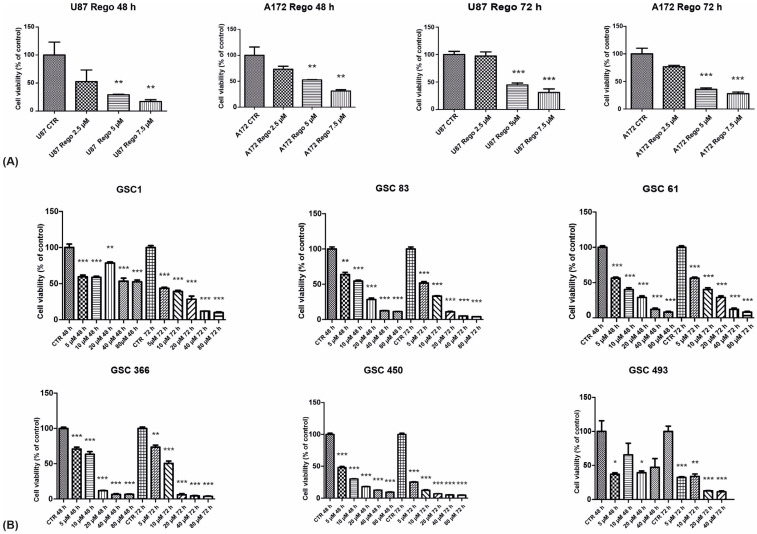
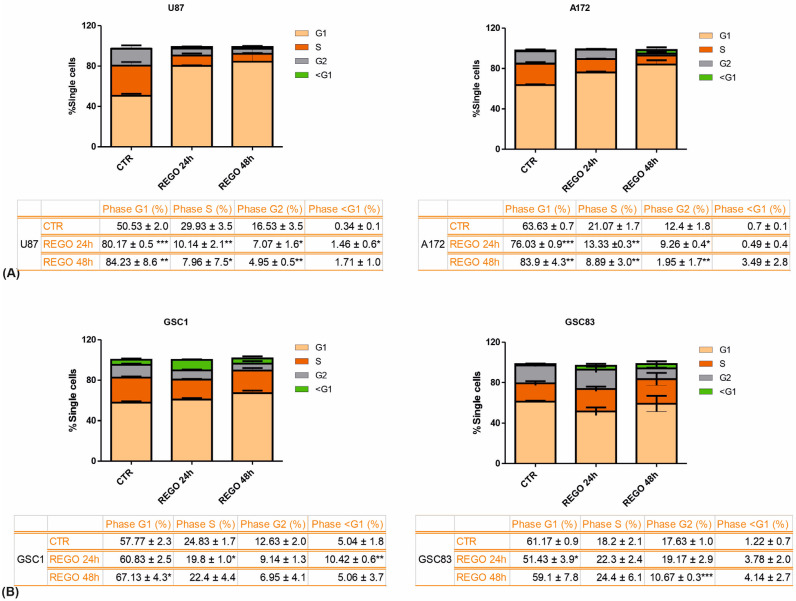
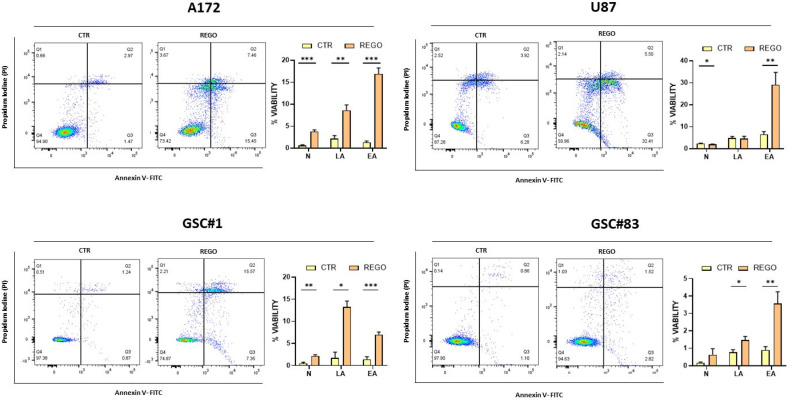
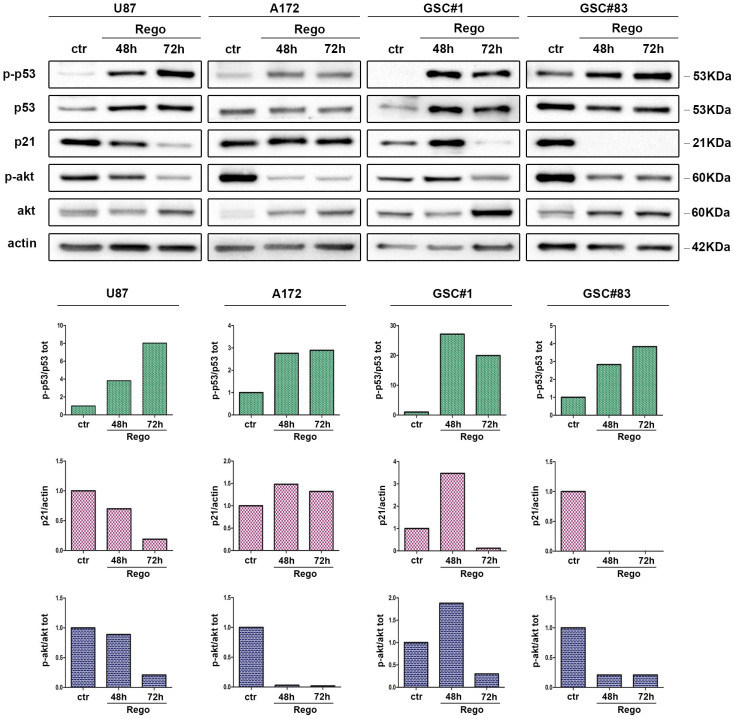
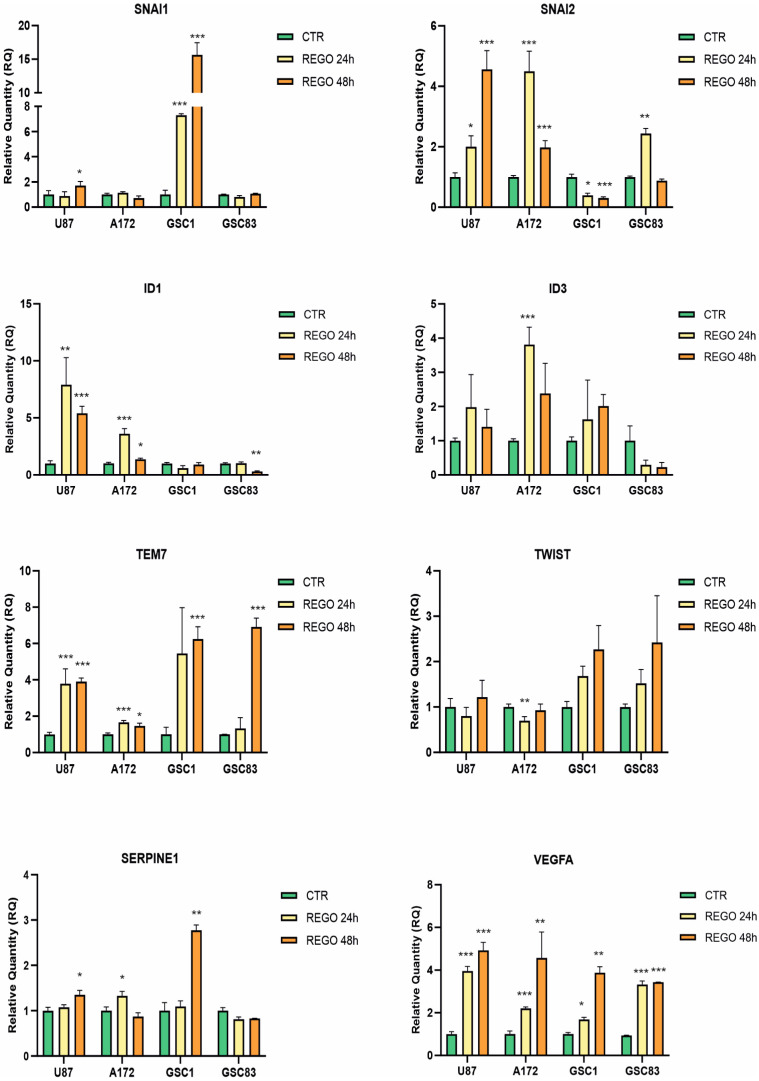
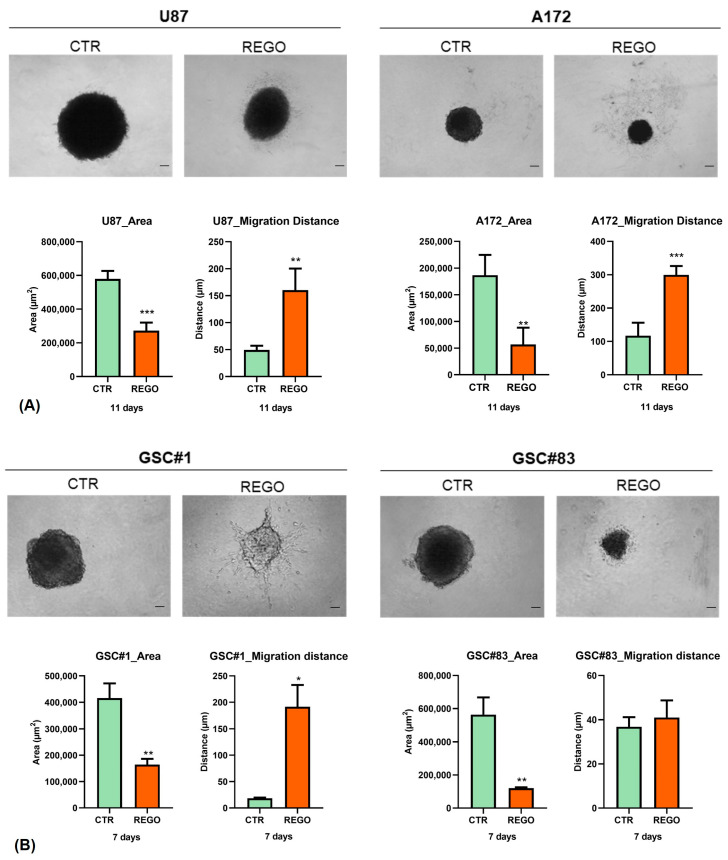
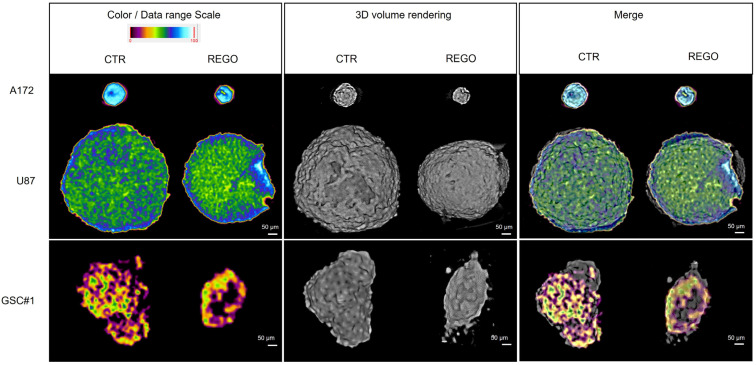
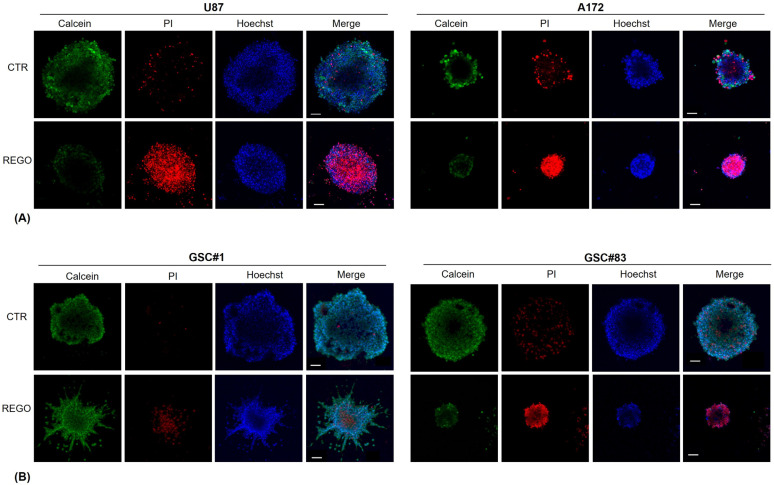
Glioblastoma (GBM), the most malignant primary brain tumor in adults. Although not frequent, it has a relevant social impact because the peak incidence coincides with the age of professional maturity. A number of novel treatments have been proposed, yet clinical trials have been disappointing. Recently, a phase II clinical trial (REGOMA) demonstrated that the multikinase inhibitor regorafenib significantly increased the median overall survival (OS) of GBM patients when compared to lomustine-treated patients. On this basis, the National Comprehensive Cancer Network (NCCN) 2020 Guidelines included regorafenib as a preferred regimen in relapsed GBM treatment. Despite the use in GBM patients' therapy, little is known about the molecular mechanisms governing regorafenib effectiveness on the GBM tumor. Here we report an in vitro characterization of GBM tumor cells' response to regorafenib, performed both on cell lines and on patient-derived glioma stem cells (GSCs). Overall, regorafenib significantly reduced cell growth of 2D tumor cell cultures and of 3D tumor spheroids. Strikingly, this effect was accompanied by transcriptional regulation of epithelial to mesenchymal transition (EMT) genes and by an increased ability of surviving tumor cells to invade the surrounding matrix. Taken together, our data suggest that regorafenib limits cell growth, however, it might induce an invasive phenotype.

Keywords: epithelial to mesenchymal transition (EMT); glioblastoma; glioma stem cells (GSCs); regorafenib; therapy.


Conflict of interest statement

The authors declare no conflict of interest.

Figures

Figure 1
Figure 1
Cell viability assay of regorafenib-treated cells. U87 and A172 cells were vehicle-treated (CTR) or treated with regorafenib concentrations in the range 2.5–7.5 µM for 48 and 72 h before cell viability assay (A). Patient-derived GSCs were treated with regorafenib concentrations in the range 5–40 µM for 48 and 72 h before cell viability assay (B). n = 3 biological replicates. * p value < 0.05; ** p value < 0.01; *** p value < 0.001.
Figure 2
Figure 2
FACS analyses of cell cycle upon regorafenib treatment. Established cell lines (A) and patient-derived GSCs (B) were vehicle-treated (CTR) or treated with 7.5 µM regorafenib for 24 or 48 h before fixation, propidium iodide staining, and FACS analysis. n = 3 biological replicates. * p value < 0.05; ** p value < 0.01; *** p value < 0.001.
Figure 3
Figure 3
Annexin staining of cells treated with regorafenib for 48 h. Cells were double stained by annexin V and by propidium iodide, for apoptotic and dead-cell labeling, respectively. N: necrotic cells; LA: late apoptosis; EA: early apoptosis. n = 3 biological replicates. * p value < 0.05; ** p value < 0.01; *** p value < 0.001.
Figure 4
Figure 4
Protein expression of apoptosis-related proteins in regorafenib-treated GBM cells. U87, A172, GSC#1, and GSC#83 were treated with regorafenib for 48 and 72 h. Figure shows a representative Western Blot analysis of total and phosphorylated p53 protein, of p21, and of phosphorylated AKT, analyzed as an indirect strategy to confirm regorafenib effectiveness in our cells. Actin was used as protein-loading control (Original western blot can be found in Supplementary Figure S4). Graphs report quantitation of the proteins levels as addressed by Image Lab Software. Experiments were repeated three times.
Figure 5
Figure 5
Gene-expression changes upon regorafenib treatment. Real-time PCR analyses of a pool of EMT-related genes, performed on both GBM cell lines and patient-derived GSCs. Cells were treated with 7.5 µM regorafenib for 24 and 48 h. Relative quantities were calculated normalizing for TBP and are given relative to control (vehicle-treated) cells. n = 3 biological replicates. * p value < 0.05; ** p value < 0.01; *** p value < 0.001.
Figure 6
Figure 6
Regorafenib effect on 3D spheroid cultures. Regorafenib, besides limiting spheroid growth, has a pronounced effect on the invading phenotype, visible as the induction of thin branches at spheroid edges ((A,B), upper panels). Spheroid area is negatively affected by regorafenib. Migration distance, which is a measure of the invading ability of tumor cells, is increased by regorafenib ((A,B), lower panels). n = 5 biological replicates. * p value < 0.05; ** p value < 0.01; *** p value < 0.001. Magnification 4×, scale bar 100 µm.
Figure 7
Figure 7
MicroCT analysis of 3D tumor spheroids. Left panels show the sectioning of spheroids in the central transverse plane. Samples were treated with a contrast agent and the color/data range scale indicates the difference in density related to the contrast absorption rate. Middle panels show the three-dimensional images of spheroids, highlighting, in particular, the spheroids’ outer surface. All regorafenib-treated spheroids are modified in shape and angularity compared to control spheroids. Scale bar: 50 µM; resolution of 4.8 µM voxel/size.
Figure 8
Figure 8
Combined fluorescence images of 3D tumor U87 and A172 (A) and GSCs (B) spheroids. Tumor spheroids were stained with calcein, propidium and Hoechst, for staining metabolically active cells, dead cells, and cell nuclei, respectively, and analyzed by confocal microscope. Magnification 10×, scale bar 100 µm.

References

    1. Stupp R., Mason W.P., van den Bent M.J., Weller M., Fisher B., Taphoorn M.J., Belanger K., Brandes A.A., Marosi C., Bogdahn U., et al. Radiotherapy plus concomitant and adjuvant temozolomide for glioblastoma. N. Engl. J. Med. 2005;352:987–996. doi: 10.1056/NEJMoa043330. - DOI - PubMed
    1. Singh S.K., Hawkins C., Clarke I.D., Squire J.A., Bayani J., Hide T., Henkelman R.M., Cusimano M.D., Dirks P.B. Identification of human brain tumour initiating cells. Nature. 2004;432:396–401. doi: 10.1038/nature03128. - DOI - PubMed
    1. Krause M., Dubrovska A., Linge A., Baumann M. Cancer stem cells: Radioresistance, prediction of radiotherapy outcome and specific targets for combined treatments. Adv. Drug Deliv. Rev. 2017;109:63–73. doi: 10.1016/j.addr.2016.02.002. - DOI - PubMed
    1. Chinot O.L., Wick W., Mason W., Henriksson R., Saran F., Nishikawa R., Carpentier A.F., Hoang-Xuan K., Kavan P., Cernea D., et al. Bevacizumab plus radiotherapy-temozolomide for newly diagnosed glioblastoma. N. Engl. J. Med. 2014;370:709–722. doi: 10.1056/NEJMoa1308345. - DOI - PubMed
    1. Reardon D.A., Turner S., Peters K.B., Desjardins A., Gururangan S., Sampson J.H., McLendon R.E., Herndon J.E., Jones L.W., Kirkpatrick J.P., et al. A review of VEGF/VEGFR-targeted therapeutics for recurrent glioblastoma. J. Natl. Compr. Canc Netw. 2011;9:414–427. doi: 10.6004/jnccn.2011.0038. - DOI - PMC - PubMed

LinkOut - more resources