Review
. 2022 Dec 16;14(24):6217.
doi: 10.3390/cancers14246217.

Implementation of Non-Invasive Quantitative Ultrasound in Clinical Cancer Imaging

Affiliations
Review

Implementation of Non-Invasive Quantitative Ultrasound in Clinical Cancer Imaging

Deepa Sharma et al. Cancers (Basel). .

Abstract

Quantitative ultrasound (QUS) is a non-invasive novel technique that allows treatment response monitoring. Studies have shown that QUS backscatter variables strongly correlate with changes observed microscopically. Increases in cell death result in significant alterations in ultrasound backscatter parameters. In particular, the parameters related to scatterer size and scatterer concentration tend to increase in relation to cell death. The use of QUS in monitoring tumor response has been discussed in several preclinical and clinical studies. Most of the preclinical studies have utilized QUS for evaluating cell death response by differentiating between viable cells and dead cells. In addition, clinical studies have incorporated QUS mostly for tissue characterization, including classifying benign versus malignant breast lesions, as well as responder versus non-responder patients. In this review, we highlight some of the important findings of previous preclinical and clinical studies and expand the applicability and therapeutic benefits of QUS in clinical settings. We summarized some recent clinical research advances in ultrasound-based radiomics analysis for monitoring and predicting treatment response and characterizing benign and malignant breast lesions. We also discuss current challenges, limitations, and future prospects of QUS-radiomics.

Keywords: cell death; chemotherapy; locally advanced breast cancer (LABC); quantitative ultrasound (QUS); radiotherapy; treatment response.


Conflict of interest statement

The authors declare no conflict of interest.

Figures
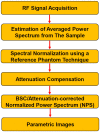
Figure 1
Figure 1
A summary of QUS spectroscopy workflow. QUS spectroscopy extracts scattering components from the RF signal that uniquely characterize tissue samples. The spectral normalization procedure removes instrument-dependent components from the RF signal, while the attenuation correction procedure compensates loss in the acoustic signal as it propagates through intervening tissue layers. Parametrization of the attenuation-corrected NPS or the BSC allows for tumors characterization, providing diagnostic and prognostic values. These parameters can then be utilized to develop a classification model for diagnostic and prognostic purposes. BSC: backscatter coefficient, NPS: normalized power spectrum, QUS: quantitative ultrasound.
Figure 2
Figure 2
Representative QUS spectral parametric images from benign and malignant group. (A) benign breast lesions (left columns) (B) malignant breast lesions (right columns). The color bars present the range for ASD of 160 μm, AAC of 70 dB/cm3, MBF of 44 dB, SS of 10 dB/MHz, and SI of 70 dB. Scale bar: 1 cm. ASD: average scatterer diameter, AAC: average acoustic concentration, MBF: mid-band fit, SS: spectral slope, SI: 0-MHz intercept. Reprinted with permission from: (Figure 1) [61].
Figure 3
Figure 3
Representative texture maps representing local quantification of image texture. (A) benign breast lesions (left columns) (B) malignant breast lesions (right columns). Scale bar: 1 cm. MBF: mid-band fit. Reprinted with permission from: (Figure 2) [61].
Figure 4
Figure 4
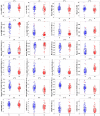
Box and scatter plots of representative radiomics features that demonstrate statistically significant differences. Statistical significant, are represented as (* p < 0.05), (** p < 0.01), and (*** p < 0.001). B: benign breast lesions, M: malignant breast lesions, ASD: average scatterer diameter, AAC: average acoustic concentration, MBF: mid-band fit, SS: spectral slope, SI: 0-MHz intercept, CON: contrast, COR: correlation, ENE: energy, HOM: homogeneity. Reprinted with permission from: (Figure 3) [61].
Figure 5
Figure 5
The root means square deviation of differences in QUS parameters: MBF and SS, MBF-texture parameters: MBF-CON, MBF-COR, MBF-ENE, and MBF-HOM due to measurement uncertainty, variations in ultrasound systems, and tissue heterogeneity. These results suggest that the inherent tissue heterogeneity was the most dominant contributor to variations in the estimated radiomics features of QUS spectral parametric images. Overall, measurement uncertainty and variations in clinical ultrasound systems contribute less than the tissue heterogeneity component. MBF: mid-band fit, SS: spectral slope, CON: contrast, COR: correlation, ENE: energy, HOM: homogeneity. Reprinted with permission from: (Figure 3) [20].
Figure 6
Figure 6
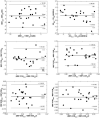
Bland-Altman plots comparing radiomics features obtained using an Ultrasonix-RP (Ultrasonix Medical Corp., Richmond, BC, Canada) and a GEGE-LOGIQ E9 (General Electric Healthcare, Milwaukee, WI, USA) ultrasound system. The limits of agreement were indicated by the mean difference and ± standard deviation. MBF: mid-band fit, SS: spectral slope, CON: contrast, COR: correlation, ENE: energy, HOM: homogeneity, ULX: ultrasonix RP L14-5/60, GE: GE-LOGIQ 9 L-D. Reprinted with permission from: (Figure 6) [20].
Figure 7
Figure 7
A representative nonlinear decision boundary obtained from an SVM model using the RBF kernel to separate complete responders from those with partial/non-responders. The model consisted of the best combination of three radiomics features obtained through a forward sequential feature selection with cross-validation. SVM: support vector machines, RBF: radial basis functions, MBF: mid-band fit, CON: contrast, ENE: energy, HOM: homogeneity. Reprinted with permission from: (Figure 3) [19].

Similar articles

Cited by

References

    1. Fass L. Imaging and cancer: A review. Mol. Oncol. 2008;2:115–152. doi: 10.1016/j.molonc.2008.04.001. - DOI - PMC - PubMed
    1. Frangioni J.V. New Technologies for Human Cancer Imaging. J. Clin. Oncol. 2008;26:4012–4021. doi: 10.1200/JCO.2007.14.3065. - DOI - PMC - PubMed
    1. Oelze M.L., Mamou J. Review of Quantitative Ultrasound: Envelope Statistics and Backscatter Coefficient Imaging and Contributions to Diagnostic Ultrasound. IEEE Trans. Ultrason. Ferroelectr. Freq. Control. 2016;63:336–351. doi: 10.1109/TUFFC.2015.2513958. - DOI - PMC - PubMed
    1. Sadeghi-Naini A., Papanicolau N., Falou O., Tadayyon H., Lee J., Zubovits J., Sadeghian A., Karshafian R., Al-Mahrouki A., Giles A., et al. Low-frequency quantitative ultrasound imaging of cell death in vivo. Med. Phys. 2013;40:082901. doi: 10.1118/1.4812683. - DOI - PubMed
    1. Sadeghi-Naini A., Papanicolau N., Falou O., Zubovits J., Dent R., Verma S., Trudeau M., Boileau J.F., Spayne J., Iradji S., et al. Quantitative Ultrasound Evaluation of Tumor Cell Death Response in Locally Advanced Breast Cancer Patients Receiving Chemotherapy. Clin. Cancer Res. 2013;19:2163–2174. doi: 10.1158/1078-0432.CCR-12-2965. - DOI - PubMed

LinkOut - more resources