. 2022 Dec 11;10(12):3214.
doi: 10.3390/biomedicines10123214.

Fibrosis-Associated Signaling Molecules Are Differentially Expressed in Palmar Connective Tissues of Patients with Carpal Tunnel Syndrome and Dupuytren's Disease

Affiliations

Fibrosis-Associated Signaling Molecules Are Differentially Expressed in Palmar Connective Tissues of Patients with Carpal Tunnel Syndrome and Dupuytren's Disease

Ivo Tripković et al. Biomedicines. .

Abstract

Carpal tunnel syndrome (CTS) and Dupuytren's disease (DD) are fibrotic conditions that affect the connective tissue of the hand and limit its functionality. The exact molecular mechanism underlying the fibrosis is unknown, and only some profibrotic factors have been investigated. In this cross-sectional study, we analyzed the expression of FGF signaling pathway molecules associated with fibrotic changes in the palmar fascia and the flexor retinaculum of 15 CTS patients and both clinically affected and unaffected palmar fascia of 15 DD patients, using immunofluorescence techniques. The expression of FGFR1, FGFR2, and CTGF in the blood vessel walls and surrounding connective tissue cells differed significantly between the analyzed groups, with changes in expression present even in clinically unremarkable tissues from DD patients. We also found altered expression of the analyzed factors, as well as TGF-β1 and syndecan-1 in DD-associated sweat glands, possibly implicating their role in the pathophysiology of the disease. The increased expression of profibrotic factors in the clinically unaffected palmar fascia of DD patients may indicate that more extensive excision is needed during surgical treatment, while the profibrotic factors could be potential targets for developing pharmacological therapeutic strategies against DD-associated fibrosis.

Keywords: CTGF; FGFR1; FGFR2; Syndecan-1; TGF-beta; carpal tunnel syndrome; dupuytren contracture.


Conflict of interest statement

The authors declare no conflict of interest.

Figures

Figure 1
Figure 1
Haematoxylin and eosin staining of connective tissues of CTS and DD patients. Rectangles mark the area presented at a higher magnification in the following image. Control samples of healthy palmar fascia (CTRL) consist of dense connective tissue (dct) with bundles of collagen fibers (cf) with fibroblasts (f) and areas of loose connective tissue (lct) where blood vessels (v) and nerves (n) can be seen (a); in the flexor retinaculum of CTS patients, dense connective tissue (dct) has more densely packed collagen fibers (cf) and is separated by loose connective tissue (lct) in which blood vessels (v) and fibrinogen deposits (fd) can be observed (b); clinically unaffected palmar fascia of DD patients (DUF) displays areas of dense connective tissue (dct) with thick strands of collagen fibers (cf), separated by areas of loose connective tissue (lct) containing blood vessels (v) (c); samples of affected palmar fascia of DD patients (DAF) show large areas of dense connective tissue (dct) containing dense collagen fibers (cf) with many fibroblasts (f), separated by loose connective tissue (lct) containing blood vessels (v) and adipocytes (a); at places, ducts (d) and secretory portions (s) of sweat glands are seen (d); 1st column, 40× magnification, scale bar 200 µm; 2nd column, 100× magnification, scale bar 100 µm; 3rd column, 200× magnification, scale bar 50 µm; 4th column, 400× magnification, scale bar 20 µm.
Figure 2
Figure 2
Mallory trichrome staining of connective tissues of CTS and DD patients. Rectangles mark the area presented at a higher magnification in the following image. Healthy palmar fascia samples show dark blue staining of collagen fibers (cf) in dense connective tissue (dct), with lighter blue areas of loose connective tissue (lct) containing blood vessels (v) and fibroblasts (f) (a); the flexor retinaculum of CTS patients contains more areas of darker staining dense connective tissue (dct) with collagen fiber bundles (cf), while in areas of loose connective tissue (lct), blood vessels (v) are observed (b); the clinically unaffected palmar fascia of DD patients (DUF) also contains areas of dense connective tissue (dct) made up of mostly collagen fibers (cf) and areas of loose connective tissue (lct) with blood vessels (v). Some regions of loose connective tissue display darker blue staining (asterisks), signifying denser collagen packing (c); in samples of affected palmar fascia of DD patients (DAF), dark blue staining of collagen fibers (cf) characterizes areas of dense (dct) and loose connective tissue (lct), also surrounding blood vessels (v), adipocytes (a), and secretory parts (s) and ducts (d) of sweat glands (d); 1st column, 40× magnification, scale bar 200 µm; 2nd column, 100× magnification, scale bar 100 µm; 3rd column, 200× magnification, scale bar 50 µm; 4th column, 400× magnification, scale bar 20 µm.
Figure 3
Figure 3
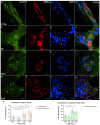
Co-expression of Ki-67 and α-SMA in connective tissues of patients with CTS and DD. CTRL–palmar fascia of CTS patients (ad); RF–flexor retinaculum of CTS patients (eh); DUF–clinically unaffected palmar fascia of DD patients (il); DAF–clinically affected palmar fascia of DD patients (mp). Nuclear Ki-67 expression (a,d,e,h,i,l,m,p) is seen in blood vessels (arrows) and surrounding connective tissue cells (arrowheads); α-SMA staining shows sections through blood vessels (b,f,j,n). DAPI staining displays all cell nuclei (c,g,k,o). Double immunofluorescence staining to Ki-67, α-SMA, and DAPI, 1000× magnification, scale bar 50 µm. Statistically significant differences in proliferation rate are displayed by graphs for both blood vessels (q) and connective tissue cells (r). Error bars show standard deviation; * p < 0.05, ** p < 0.01, *** p < 0.001, **** p < 0.001.
Figure 4
Figure 4
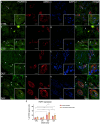
Co-expression of FGFR1 and α-SMA in connective tissues of patients with CTS and DD. CTRL–palmar fascia of CTS patients (ad); RF–flexor retinaculum of CTS patients (eh); DUF–clinically unaffected palmar fascia of DD patients (il); DAF–clinically affected palmar fascia of DD patients (mp). FGFR1 expression (a,d,e,h,i,l,m,p) is seen in blood vessels (arrows) and surrounding connective tissue cells (arrowheads); α-SMA staining shows sections through blood vessels (b,f,j,n). DAPI staining displays all cell nuclei (c,g,k,o). Insets (ap) reveal the distribution of FGFR1 staining in blood vessels. Double immunofluorescence staining to FGFR1, α-SMA, and DAPI, 400× magnification, scale bar 100 µm. The graph displays statistically significant differences in FGFR1 expression of blood vessel and connective tissue cells (q). Error bars show standard deviation; * p < 0.05, ** p < 0.01, **** p < 0.001.
Figure 5
Figure 5
Co-expression of FGFR2 and α-SMA in connective tissues of patients with CTS and DD. CTRL–palmar fascia of CTS patients (ad); RF–flexor retinaculum of CTS patients (eh); DUF–clinically unaffected palmar fascia of DD patients (il); DAF–clinically affected palmar fascia of DD patients (mp). FGFR2 expression (a,d,e,h,i,l,m,p) is seen in blood vessels (arrows) and surrounding connective tissue cells (arrowheads); α-SMA staining shows sections through blood vessels (b,f,j,n). DAPI staining displays all cell nuclei (c,g,k,o). Insets (ap) reveal the distribution of FGFR2 staining in blood vessels. Double immunofluorescence staining to FGFR2, α-SMA, and DAPI, 400× magnification, scale bar 100 µm. The graph displays statistically significant differences in FGFR2 expression of blood vessel and connective tissue cells (q). Error bars show standard deviation; * p < 0.05, ** p < 0.01, *** p < 0.001.
Figure 6
Figure 6
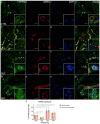
Co-expression of CTGF and α-SMA in connective tissues of patients with CTS and DD. CTRL–palmar fascia of CTS patients (ad); RF–flexor retinaculum of CTS patients (eh); DUF–clinically unaffected palmar fascia of DD patients (il); DAF–clinically affected palmar fascia of DD patients (mp). CTGF expression (a,d,e,h,i,l,m,p) is seen in blood vessels (arrows) and surrounding connective tissue cells (arrowheads); α-SMA staining shows sections through blood vessels (b,f,j,n). DAPI staining displays all cell nuclei (c,g,k,o). Insets (ap) reveal the distribution of CTGF staining in blood vessels. Double immunofluorescence staining to CTGF, α-SMA, and DAPI, 400× magnification, scale bar 100 µm. The graph displays statistically significant differences in CTGF expression of blood vessel and connective tissue cells (q). Error bars show standard deviation; * p < 0.05, *** p < 0.001, **** p < 0.001.
Figure 7
Figure 7
Expression of syndecan-1 and co-expression of Ki-67 and α-SMA in eccrine sweat glands of healthy controls and patients with DD. CTRL–normal skin of healthy individuals (a,b,e,f); DAF–clinically affected palmar fascia of DD patients (c,d,g,h). Syndecan-1 expression is seen in eccrine sweat gland cells (arrows) of secretory portions (a,c) and ducts (b,d). Nuclear Ki-67 expression is also seen in eccrine sweat gland cells (arrows) of secretory portions (e,g) and ducts (f,h); α-SMA staining shows myoepithelial cells of sweat gland secretory portions and sections through surrounding blood vessels (eh). DAPI staining displays all cell nuclei (ah). Immunofluorescence staining to syndecan-1 and DAPI, and double immunofluorescence staining to Ki-67, α-SMA, and DAPI, 1000× magnification, scale bar 50 µm. Statistically significant differences in syndecan-1 expression (i) and proliferation rate (j) are displayed by graphs. Error bars show standard deviation; **** p < 0.001.
Figure 8
Figure 8
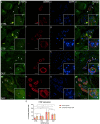
Co-expression of FGFR1/FGFR2/CTGF/TGF-β and α-SMA in eccrine sweat glands of healthy controls and patients with DD. CTRL–normal skin of healthy individuals (a,b,e,f,i,j,m,n); DAF–clinically affected palmar fascia of DD patients (c,d,g,h,k,l,o,p). FGFR1 expression is seen in sweat gland cells (arrows) of secretory portions (a,c) and ducts (b,d). FGFR2 expression is also seen in sweat gland cells (arrows) of secretory portions (e,g) and ducts (f,h). CTGF is expressed in sweat gland cells (arrows) of secretory portions (i,k) and ducts (j,l). TGF-β is also expressed in sweat gland cells (arrows) of secretory portions (m,o) and ducts (n,p); α-SMA staining shows myoepithelial cells of sweat gland secretory portions and sections through surrounding blood vessels (ap). DAPI staining displays all cell nuclei (ap). Double immunofluorescence staining to FGFR1/FGFR2/CTGF/TGF-β, α-SMA and DAPI, 1000× magnification, scale bar 50 µm. Graphs display statistically significant differences in FGFR1 (q), FGFR2 (r), CTGF (s), and TGF-β expression (t) between the analyzed samples. Error bars show standard deviation; * p < 0.05, ** p < 0.01, **** p < 0.001.

Similar articles

Cited by

References

    1. Keith M.W., Masear V., Chung K.C., Maupin K., Andary M., Amadio P.C., Watters W.C., 3rd, Goldberg M.J., Haralson R.H., 3rd, Turkelson C.M., et al. American Academy of Orthopaedic Surgeons Clinical Practice Guideline on diagnosis of carpal tunnel syndrome. J. Bone Jt. Surg. 2009;91:2478–2479. doi: 10.2106/JBJS.I.00643. - DOI - PMC - PubMed
    1. El-Helaly M., Balkhy H.H., Vallenius L. Carpal tunnel syndrome among laboratory technicians in relation to personal and ergonomic factors at work. J. Occup. Health. 2017;59:513–520. doi: 10.1539/joh.16-0279-OA. - DOI - PMC - PubMed
    1. Schnetzler K.A. Acute carpal tunnel syndrome. J. Am. Acad. Orthop. Surg. 2008;16:276–282. doi: 10.5435/00124635-200805000-00006. - DOI - PubMed
    1. Atroshi I., Gummesson C., Johnsson R., Ornstein E., Ranstam J., Rosen I. Prevalence of carpal tunnel syndrome in a general population. JAMA. 1999;282:153–158. doi: 10.1001/jama.282.2.153. - DOI - PubMed
    1. Stecco C., Giordani F., Fan C., Biz C., Pirri C., Frigo A.C., Fede C., Macchi V., Masiero S., De Caro R. Role of fasciae around the median nerve in pathogenesis of carpal tunnel syndrome: Microscopic and ultrasound study. J. Anat. 2020;236:660–667. doi: 10.1111/joa.13124. - DOI - PMC - PubMed