

Development and Evaluation of Automated Tools for Auditory-Brainstem and Middle-Auditory Evoked Potentials Waves Detection and Annotation
- PMID: 36552135
- PMCID: PMC9775187
- DOI: 10.3390/brainsci12121675
Development and Evaluation of Automated Tools for Auditory-Brainstem and Middle-Auditory Evoked Potentials Waves Detection and Annotation
Abstract
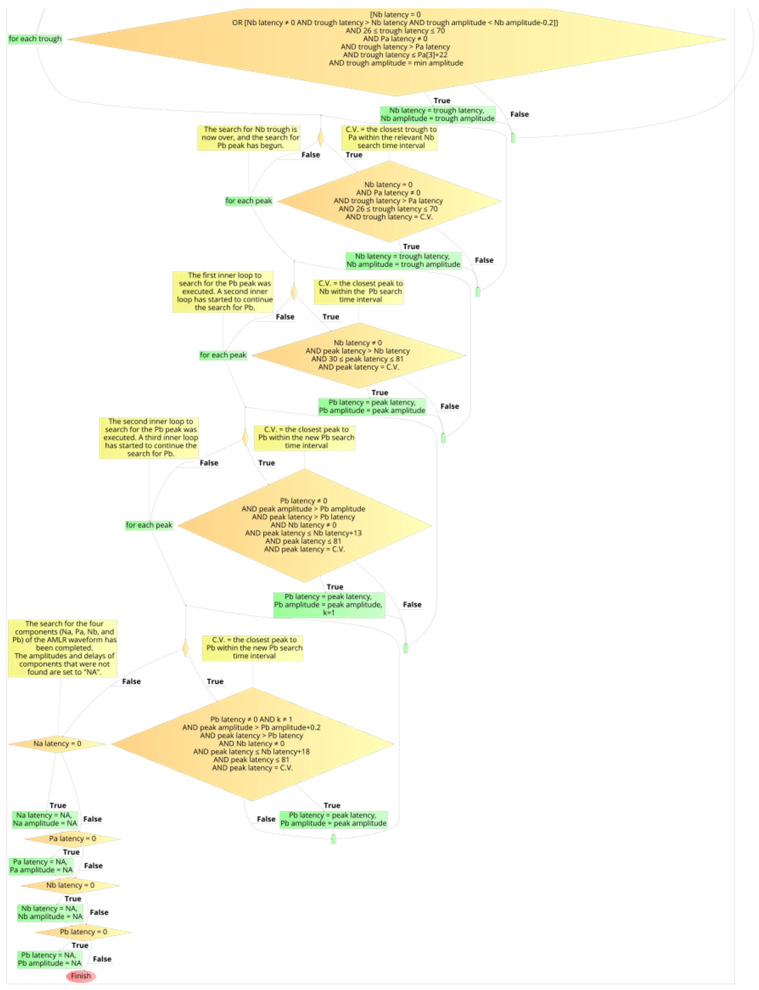
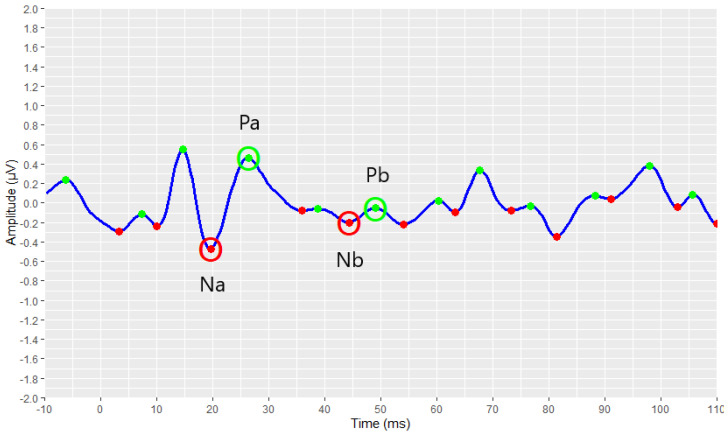
Auditory evoked potentials (AEPs) are brain-derived electrical signals, following an auditory stimulus, utilised to examine any obstructions along the brain neural-pathways and to diagnose hearing impairment. The clinical evaluation of AEPs is based on the measurements of the latencies and amplitudes of waves of interest; hence, their identification is a prerequisite for AEP analysis. This process has proven to be complex, as it requires relevant clinical experience, and the existing software for this purpose has little practical use. The aim of this study was the development of two automated annotation tools for ABR (auditory brainstem response)- and AMLR (auditory middle latency response)-tests. After the acquisition of 1046 raw waveforms, appropriate pre-processing and implementation of a four-stage development process were performed, to define the appropriate logical conditions and steps for each algorithm. The tools' detection and annotation results, regarding the waves of interest, were then compared to the clinicians' manual annotation, achieving match rates of at least 93.86%, 98.51%, and 91.51% respectively, for the three ABR-waves of interest, and 93.21%, 92.25%, 83.35%, and 79.27%, respectively, for the four AMLR-waves. The application of such tools in AEP analysis is expected to assist towards an easier interpretation of these signals.
Keywords: auditory brainstem response (ABR); auditory evoked potential (AEP); auditory middle latency response (AMLR); automated wave-annotation; waveforms.
Conflict of interest statement
The authors declare no conflict of interest.
Figures


Similar articles
-
Signal verification of middle latency auditory evoked potentials by automated detection of the brainstem response.Anesthesiology. 2004 Aug;101(2):321-6. doi: 10.1097/00000542-200408000-00012. Anesthesiology. 2004. PMID: 15277914 Clinical Trial.
-
Auditory evoked potentials in multiple sclerosis: correlation with magnetic resonance imaging.J Basic Clin Physiol Pharmacol. 1996;7(3):245-78. doi: 10.1515/jbcpp.1996.7.3.245. J Basic Clin Physiol Pharmacol. 1996. PMID: 8910140
-
Electrophysiological changes in auditory evoked potentials in rats with salicylate-induced tinnitus.Brain Res. 2019 Jul 15;1715:235-244. doi: 10.1016/j.brainres.2019.04.004. Epub 2019 Apr 5. Brain Res. 2019. PMID: 30958992
-
Brainstem evoked auditory potentials in tinnitus: A best-evidence synthesis and meta-analysis.Front Neurol. 2022 Aug 22;13:941876. doi: 10.3389/fneur.2022.941876. eCollection 2022. Front Neurol. 2022. PMID: 36071905 Free PMC article.
-
[Auditory evoked potentials: basics and clinical applications].Laryngorhinootologie. 2014 Sep;93(9):625-37. doi: 10.1055/s-0034-1385868. Epub 2014 Aug 25. Laryngorhinootologie. 2014. PMID: 25152975 Review. German.
Cited by
-
Universal Recommendations on Planning and Performing the Auditory Brainstem Responses (ABR) with a Focus on Mice and Rats.Audiol Res. 2023 Jun 2;13(3):441-458. doi: 10.3390/audiolres13030039. Audiol Res. 2023. PMID: 37366685 Free PMC article.
-
Musical training does not enhance neural sound encoding at early stages of the auditory system: A large-scale multisite investigation.bioRxiv [Preprint]. 2024 Sep 4:2024.09.02.610856. doi: 10.1101/2024.09.02.610856. bioRxiv. 2024. PMID: 39282463 Free PMC article. Preprint.
-
Phenotypic spectrum of tinnitus patients bearing rare ANK2 gene variants.Eur Arch Otorhinolaryngol. 2024 Aug;281(8):4071-4080. doi: 10.1007/s00405-024-08561-9. Epub 2024 Mar 20. Eur Arch Otorhinolaryngol. 2024. PMID: 38507076 Free PMC article.
-
Development of Machine-Learning Models for Tinnitus-Related Distress Classification Using Wavelet-Transformed Auditory Evoked Potential Signals and Clinical Data.J Clin Med. 2023 Jun 4;12(11):3843. doi: 10.3390/jcm12113843. J Clin Med. 2023. PMID: 37298037 Free PMC article.
-
Large-scale multi-site study shows no association between musical training and early auditory neural sound encoding.Nat Commun. 2025 Aug 8;16(1):7152. doi: 10.1038/s41467-025-62155-5. Nat Commun. 2025. PMID: 40781070 Free PMC article.
References
-
- Manta O., Sarafidis M., Schlee W., Consoulas C., Kikidis D., Koutsouris D. Electrophysiological Differences in Distinct Hearing Threshold Level Individuals with and without Tinnitus Distress; Proceedings of the 2022 44th Annual International Conference of the IEEE Engineering in Medicine & Biology Society (EMBC); Glasgow, UK. 11–15 July 2022; pp. 1630–1633. - DOI - PubMed
-
- Hall J.W. In: Handbook of Auditory Evoked Responses. Hall M. III, editor. Pearson Education, Inc.; London, UK: 2015.
LinkOut - more resources
Full Text Sources
