. 2022 Nov 24;11(12):1694.
doi: 10.3390/biology11121694.

PIP2 Interacts Electrostatically with MARCKS-like Protein-1 and ENaC in Renal Epithelial Cells

Affiliations

PIP2 Interacts Electrostatically with MARCKS-like Protein-1 and ENaC in Renal Epithelial Cells

Qiang Yue et al. Biology (Basel). .

Abstract

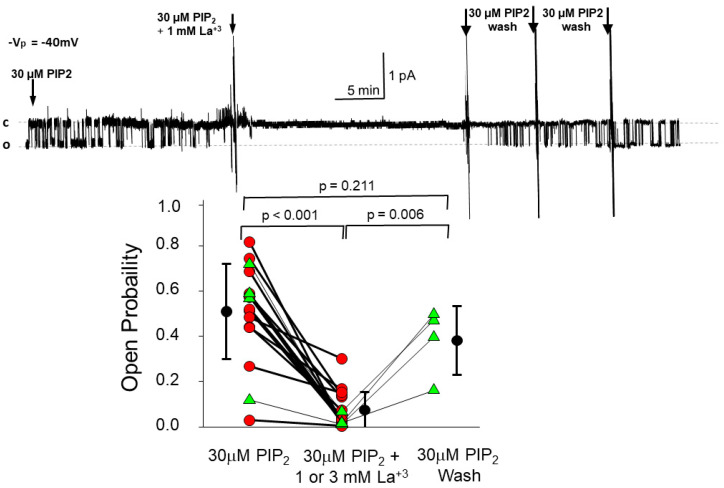
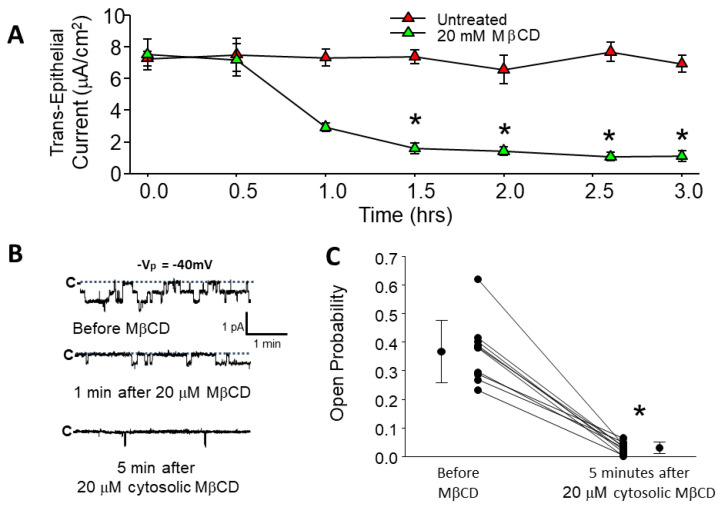
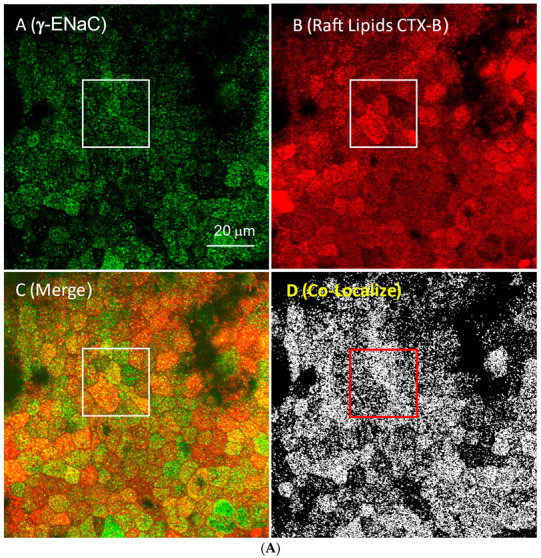
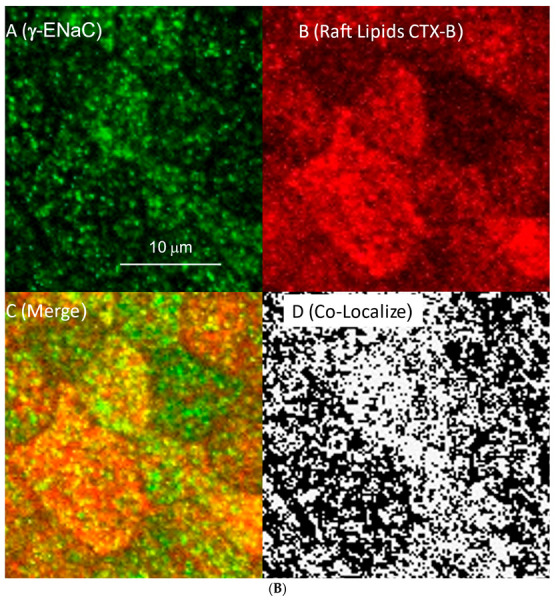
We examined the interaction of a membrane-associated protein, MARCKS-like Protein-1 (MLP-1), and an ion channel, Epithelial Sodium Channel (ENaC), with the anionic lipid, phosphatidylinositol 4, 5-bisphosphate (PIP2). We found that PIP2 strongly activates ENaC in excised, inside-out patches with a half-activating concentration of 21 ± 1.17 µM. We have identified 2 PIP2 binding sites in the N-terminus of ENaC β and γ with a high concentration of basic residues. Normal channel activity requires MLP-1's strongly positively charged effector domain to electrostatically sequester most of the membrane PIP2 and increase the local concentration of PIP2. Our previous data showed that ENaC covalently binds MLP-1 so PIP2 bound to MLP-1 would be near PIP2 binding sites on the cytosolic N terminal regions of ENaC. We have modified the charge structure of the PIP2 -binding domains of MLP-1 and ENaC and showed that the changes affect membrane localization and ENaC activity in a way consistent with electrostatic theory.

Keywords: ENaC; MARCKS-like protein-1; MARCKS-like-1; PIP2; mpkCCD cells.


Conflict of interest statement

The authors declare no conflict of interest.

Figures

Figure 1
Figure 1
Sequences of the N-terminal regions of human and mouse β and γ ENaC with PIP2 binding domains and transmembrane-spanning domains marked.
Figure 2
Figure 2
PIP2 activates ENaC. (A). Single channel record from an excised cell-free patch from an H441 epithelial cell. After excising the patch bathed in a solution that mimics the intracellular ion composition, we added increasing doses of PIP2 to the cytosolic surface of the patch. Mean closed time decreases. This implies an increase in the opening rate as shown in Panel (B) (slope = 7.97 × 10⁻⁶ ± 1.63 × 10⁻⁶ ms−1 × mM−1 p = 0.0165). There was also a smaller increase in open time (Pane (C)), implying a decrease in closing rate, although the slope may not be significant (slope = −1.01 × 10⁻⁴ ± 3.27 × 10⁻⁵ ms−1 × mM−1 p = 0.0539). Data is from 11 patches with 56, 1076, 418, 233, 327 events at 0, 10, 20, 30, and 50 mM PIP2 concentrations, respectively.
Figure 3
Figure 3
Dose-response relationship for PIP2 activation of ENaC and current-voltage relationship for ENaC in excised patches from H441 cells. In Panel (A), we fit the open probability vs. PIP2 concentration to the Hill equation (see text). The half-activating concentration of PIP2 was 22 ± 0.66 μM with a maximal open probability of 0.411 ± 0.0156. The Hill coefficient is 2.5 ± 0.55 (r2 = 0.949). In Panel (B), we show representative single-channel events at ten different voltages. The vertical scale bars are the same in all records except +40. The horizontal scale bars vary among records. Channel openings (inward current) are downward. Open and closed levels are indicated with dashed lines labeled “o” and “c,” respectively. Panel (C) shows the single-channel current-voltage relationship of 4l channels from excised patches. We fit the single channel current to the Goldman Current Equation [34] that gave a unit conductance of 6.6 ± 1.4 pS between −120 and −40 mV. It also predicted the observed inward rectification at positive potentials and a reversal potential of 83 ± 3.1 mV. These numbers are consistent with ENaC exposed to high 140 mM LiCl in the pipette and low 3 mM Na+ on the cytosolic surface.
Figure 4
Figure 4
Lanthanum, a trivalent cation, reduces PIP2 activity. We excised patches from H441 cells and added 30 μM PIP2 in PBS to the cytosolic surface to activate ENaC. After 12 min, we added 1 mM La3+Cl3 which rapidly reduced PIP2-induced ENaC activity. In four experiments, we washed away the La3+ with PIP2 -containing PBS, which rapidly reversed the reduction in ENaC activity. The Po of the channel before adding lanthanum is significantly different from after lanthanum (p < 0.001) but is not different than after wash out (p = 0.211); however, wash out is also significantly different from the lanthanum treated patch (p = 0.006). (by repeated measures ANOVA).
Figure 5
Figure 5
Sensitivity to methyl-β-cyclodextrin (MβCD) is asymmetric. (A) To inhibit sodium transport in cells in monolayer cultures on permeable supports required treatment with high concentrations (20 mM) of MβCD on the apical surface. * indicates significant difference from untreated. (B) In contrast, low concentrations of MβCD on the cytosolic surface of an excised, cell-free patch treated with 20 μM PIP2 rapidly reduces ENaC Po in excised, cell-free patches. We excised membrane patches from mpkCCD cells in the presence of 20 μM PIP2 and applied 20 μM MβCD to the cytosolic surface of the membrane, where it presumably would have direct access to the cholesterol in the inner leaflet of lipid rafts. (C) At a concentration 1000 times lower than what we had applied to the luminal surface (20 μM instead of 20 mM), we could reduce ENaC open probability close to zero in less than 5 min (p < 0.001, paired t-test n = 7 where symbols represent individual experiments).
Figure 6
Figure 6
Raft lipids and γ-ENaC density are correlated with cholesterol in the membrane. We show images from confluent monolayers imaged with a water immersion 25× lens on an Olympus Fluoview confocal microscope (scale bar 30 μm). Cells were either untreated, cholesterol treated (30 μg/mL), or treated with methyl-β-cyclodextrin (MβCD) (20 mM). We measured the mean intensity and standard deviation of intensity of all pixels in each image and tested these for significant differences. For γ-ENaC, the untreated and cholesterol-treated cell intensities are significantly different from the MbCD-treated cells (p = 0.014 and <0.001, respectively). Untreated and cholesterol-treated intensities are not different (p = 0.258). The same is true for the intensities of raft lipids: MβCD intensity is less than untreated and cholesterol-treated (p = 0.005 and <0.001 for both), and untreated and cholesterol-treated are not different (p = 0.385). For the merged images and the co-localization, the intensities of all images are significantly different from one another: untreated and cholesterol-treated vs. MβCD-treated at the p < 0.001 level and untreated intensity are less than cholesterol-treated (p = 0.01 for merged and p = 0.025 for co-localization intensities). For the right panels, we used the “colocalization finder” plugin of “Image J” (8) to analyze our images for colocalization of the labels for CTX-B and γ-ENaC antibodies. This plugin allows the user to identify pixels that contain both channel 1 (γ-ENaC fluorescence–green) and channel 2 (CTX-B fluorescence–red). These pixels are then highlighted in white. We restricted the analysis to pixels having ratios of intensity values in the two channels greater than 0.1.
Figure 7
Figure 7
Cholesterol alters the distribution of α-ENaC and raft lipids. We used the z-axis scanning capability of a Leica SP-8MP two-photon microscope to measure the density and relative location with respect to the apical membrane of raft lipids and α-ENaC after no treatment, the addition of exogenous cholesterol, and after 5 min of basolateral MβCD (20 mM) (as in Figure 6). Raft lipids were detected with the cholera toxin B subunit. Slices were made at 0.1 μM intervals. There are raft lipids in both apical and basolateral membranes, but more lipids in the apical membrane than in the basolateral membrane. After exogenous cholesterol (30 μM/mL), raft lipids increase above those in untreated cells; and decrease after MβCD. α-ENaC follows the same pattern at the apical membrane; we speculate that the different height of the cells likely has to do with changes in sodium transport activity associated with changes in functional ENaC.
Figure 8
Figure 8
(A) γ-ENaC co-localizes with the lipid domain marker cholera toxin-B. The first image in the upper left shows the apical surface of mpkCCD cells labeled with an anti-γ ENaC antibody, while the upper right shows the CTX-B labeling corresponding to glycosphingolipids in lipid domains. The lower left shows the merged images with yellow-orange indicating co-localization. Panel D shows in white the locations in the upper panels where a red pixel and a green pixel of similar intensities overlap. The co-localization coefficient is 0.783. There are areas that are green with little red, but few areas of red that do not colocalize with green implying that specialized lipid domains have ENaC. We used the “colocalization finder” plugin of “Image J” (8) to analyze our images for colocalization of the labels for CTX-B and γ-ENaC antibodies, as we did in Figure 6. This plugin allows the user to identify pixels that contain both channel 1 (γ-ENaC fluorescence–green) and channel 2 (CTX-B fluorescence–red). These pixels are then highlighted in white on separate images. We restricted the analysis to pixels having ratios of intensity values in the two channels greater than 0.1. (B) The images below are magnified images of the inset areas of the larger image to better visualize cells and colocalization.
Figure 8
Figure 8
(A) γ-ENaC co-localizes with the lipid domain marker cholera toxin-B. The first image in the upper left shows the apical surface of mpkCCD cells labeled with an anti-γ ENaC antibody, while the upper right shows the CTX-B labeling corresponding to glycosphingolipids in lipid domains. The lower left shows the merged images with yellow-orange indicating co-localization. Panel D shows in white the locations in the upper panels where a red pixel and a green pixel of similar intensities overlap. The co-localization coefficient is 0.783. There are areas that are green with little red, but few areas of red that do not colocalize with green implying that specialized lipid domains have ENaC. We used the “colocalization finder” plugin of “Image J” (8) to analyze our images for colocalization of the labels for CTX-B and γ-ENaC antibodies, as we did in Figure 6. This plugin allows the user to identify pixels that contain both channel 1 (γ-ENaC fluorescence–green) and channel 2 (CTX-B fluorescence–red). These pixels are then highlighted in white on separate images. We restricted the analysis to pixels having ratios of intensity values in the two channels greater than 0.1. (B) The images below are magnified images of the inset areas of the larger image to better visualize cells and colocalization.
Figure 9
Figure 9
ENaC activity is greatly reduced in mpkCCD cells in which MLP-1 is strongly knocked down. Using CRISPR/Cas9, MLP-1 was knocked down between five and seven cycles (by Q PCR), implying at least a 30 to 120-fold reduction in MLP-1 in several clones. Western blots of wild-type and five knockout clones are shown in (A) blotted for MLP-1 (in 1) or GAPDH (in 2). MLP-1 is below detection limits. Full Western blot images are presented in supplementary data. In (B), single channel traces show that only short, flickery channel events are observed in the KO cells (lower trace) compared to the wild type (upper trace). Many of the events in the knockdown trace are so short that they do not reach full amplitude due to filtering (at 100 Hz). (C) shows that the major effect of the knockdown is to reduce the mean open time in the KD cells. The mean open time is significantly different from all other mean times (* indicates significant difference p < 0.05). As expected in Panel (D), the reduced mean open time leads to a dramatically reduced open probability (* indicates significant difference p < 0.001). Symbols represent values for individual experiments.
Figure 10
Figure 10
Altering the charge structure of β or γ ENaC PIP2-binding domains changes ENaC open probability. We made four mutations that increased the positive charge of PIP2 binding domains in β or γ ENaC: β E45K, γ E5R, γ N14K, and γ N14K, E5R. There is negatively charged glutamate in the middle of the sequence of cationic residues at position E45, which we have mutated to a positively charged lysine. For γ, we made one single mutation, E5R, a negative charge to a positive charge, and a double mutation, γ N14K, E5R. We transfected H441 with α-ENaC, one of the mutant ENaCs, and the other wild-type ENaC subunits. After transfection, we formed excised patches and applied 30 μM PIP2 to the cytosolic surface of the patch and examined the open probability of the patches. All four mutants increased ENaC open probability above that of wild-type subunits, but only the β E45K, γ E5R, and the γ N14K mutants increased the open probability significantly from wild-type. Wildtype Po is 0.236 ± 0.0744 (n = 11); β E45K is 0.418 ± 0.116 (n = 11, p = 0,014); γ E5R is 0.644 ± 0.259 (n = 5, p < 0.001); and γ N14K is 0.535 ± 0.204 (n = 9, p < 0.001) and γ N14K E5R 0.346 ± 0.205 (n = 5; p = 0.176). All compared to wild-type. Symbols represent individual experiments; symbols with “whiskers” are means ± s.d.
Figure 11
Figure 11
Schematic of PIP2 activation of ENaC. In 1, PIP2 and the N-terminus of b-ENaC are separated, and the cytosolic domain of b-ENaC is free; in 2, PIP2 is attracted to the positive charge of b-ENaC’s PIP2 binding domain; in 3, b-ENaC’s N-terminus folds to be in close association with PIP2′s head group and the inner surface of the membrane. The change in conformation also gates ENaC open transiently. In 4, the second PIP2 binding domain associates with a second PIP2, which stabilizes ENaC, leading to the second open state. The channel may make many transitions back and forth between the two open states.

Similar articles

Cited by

References

    1. Yue G., Malik B., Yue G., Eaton D.C. Phosphatidylinositol 4,5-bisphosphate (PIP2) stimulates epithelial sodium channel activity in A6 cells. J. Biol. Chem. 2002;277:11965–11969. doi: 10.1074/jbc.M108951200. - DOI - PubMed
    1. Ma H.P., Saxena S., Warnock D.G. Anionic phospholipids regulate native and expressed ENaC. J. Biol. Chem. 2002;277:7641–7644. doi: 10.1074/jbc.C100737200. - DOI - PubMed
    1. Pochynyuk O., Bugaj V., Stockand J.D. Physiologic regulation of the epithelial sodium channel by phosphatidylinositides. Curr. Opin. Nephrol. Hypertens. 2008;17:533–540. doi: 10.1097/MNH.0b013e328308fff3. - DOI - PMC - PubMed
    1. Pochynyuk O., Tong Q., Medina J., Vandewalle A., Staruschenko A., Bugaj V., Stockand J.D. Molecular Determinants of PI(4,5)P2 and PI(3,4,5)P3 Regulation of the Epithelial Na+ Channel. J. Gen. Physiol. 2007;130:399–413. doi: 10.1085/jgp.200709800. - DOI - PMC - PubMed
    1. Pochynyuk O., Tong Q., Staruschenko A., Ma H.-P., Stockand J.D. Regulation of the epithelial Na+ channel (ENaC) by phosphatidylinositides. Am. J. Physiol. Renal Physiol. 2006;290:F949–F957. doi: 10.1152/ajprenal.00386.2005. - DOI - PubMed