. 2022 Nov 30;11(12):1752.
doi: 10.3390/biology11121752.

A Systems Biology and LASSO-Based Approach to Decipher the Transcriptome-Interactome Signature for Predicting Non-Small Cell Lung Cancer

Affiliations

A Systems Biology and LASSO-Based Approach to Decipher the Transcriptome-Interactome Signature for Predicting Non-Small Cell Lung Cancer

Firoz Ahmed et al. Biology (Basel). .

Abstract

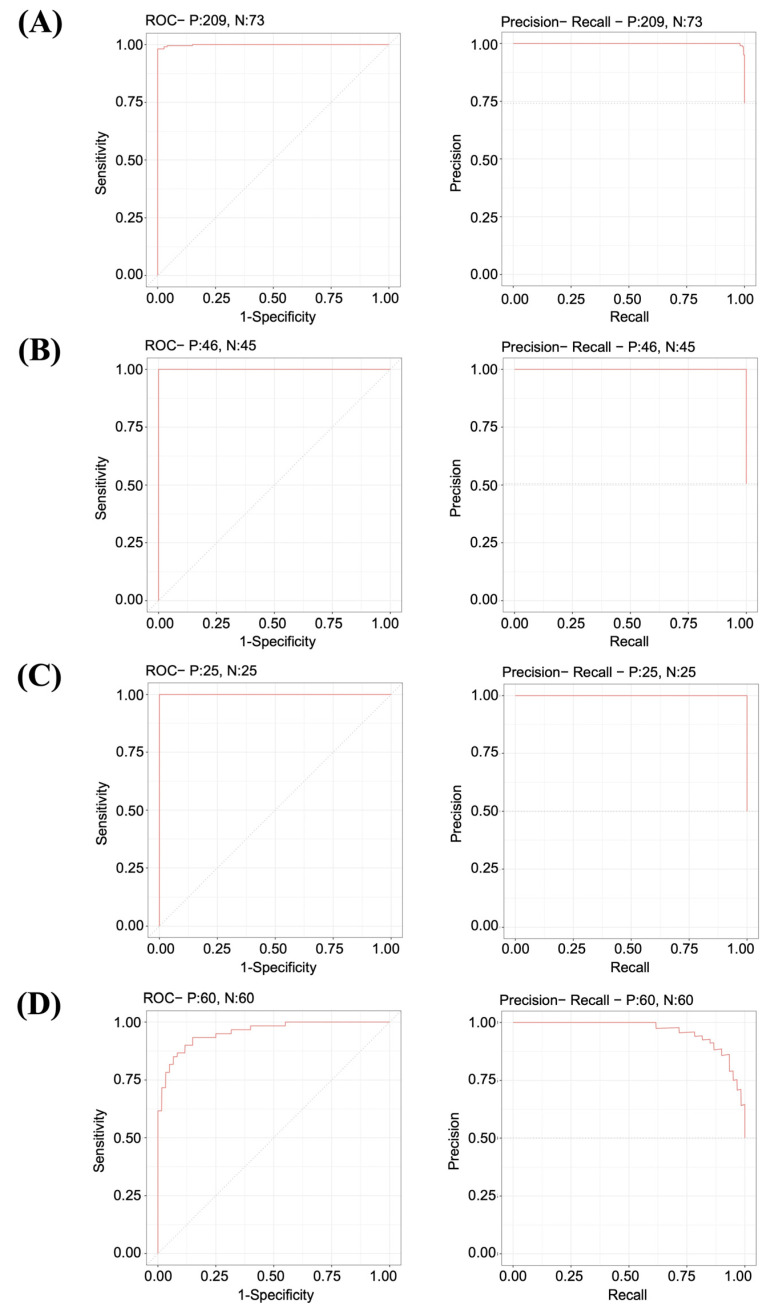
The lack of precise molecular signatures limits the early diagnosis of non-small cell lung cancer (NSCLC). The present study used gene expression data and interaction networks to develop a highly accurate model with the least absolute shrinkage and selection operator (LASSO) for predicting NSCLC. The differentially expressed genes (DEGs) were identified in NSCLC compared with normal tissues using TCGA and GTEx data. A biological network was constructed using DEGs, and the top 20 upregulated and 20 downregulated hub genes were identified. These hub genes were used to identify signature genes with penalized logistic regression using the LASSO to predict NSCLC. Our model’s development involved the following steps: (i) the dataset was divided into 80% for training (TR) and 20% for testing (TD1); (ii) a LASSO logistic regression analysis was performed on the TR with 10-fold cross-validation and identified a combination of 17 genes as NSCLC predictors, which were used further for development of the LASSO model. The model’s performance was assessed on the TD1 dataset and achieved an accuracy and an area under the curve of the receiver operating characteristics (AUC-ROC) of 0.986 and 0.998, respectively. Furthermore, the performance of the LASSO model was evaluated using three independent NSCLC test datasets (GSE18842, GSE27262, GSE19804) and achieved high accuracy, with an AUC-ROC of >0.99, >0.99, and 0.95, respectively. Based on this study, a web application called NSCLCpred was developed to predict NSCLC.

Keywords: LASSO model; artificial intelligence; biological networks; gene expression; hub genes; non-small cell lung cancer.


Conflict of interest statement

The authors declare no conflict of interest.

Figures

Figure 1
Figure 1
(A) Workflow of our study. (B) The PCA plot for samples using 2500 genes with the most significant variance. Each point represents the gene expression of a sample. Samples with similar gene expression profiles are closer in the three-dimensional space. (C) Volcano plot of DEGs in lung cancer compared with normal samples. The DEGs with |log2FC| > 2.0 and adj.p.val < 0.001 are shown in red.
Figure 2
Figure 2
Biological interaction network of DEGs identified in NSCLC samples according to BioGRID v 4.4.205. The DEGs’ nodes were filtered from all interactions available in BioGRID. The node sizes are arranged as per their degree in the original human interaction network and therefore indicate their central involvement in human cellular interactions. The colors of the nodes were determined by their log2FC value, where green to red represents negative to positive log2FC values.
Figure 3
Figure 3
Construction of the risk score model for lung cancer prediction using LASSO logistic regression with 10-fold cv using glmnet. (A) LASSO regression coefficient profiles of 40 genes associated with lung cancer at different values of log lambda. Each curve indicates a gene and the path of its coefficient against the different values of log lambda. (B) This plot displays the AUC value (in red) with varying values of log lambda. The vertical dotted line at the left indicates the value of λ lambda.min that gives the maximum average AUC. The vertical dotted line at the right shows the largest value of λ lambda.1se; the performance is within one standard error of the maximum average AUC. The numbers across the top are the nonzero coefficient estimates. (C) Bar graph representing the regression coefficients for the most relevant genes (17 genes) at lambda.min = 0.0005101641. The blue-green bar represents positive coefficients; the red bar represents negative coefficients. (D) Heatmap of the expression patterns of relevant genes (17 genes) from the TR dataset.
Figure 4
Figure 4
Performance of the LASSO model on the independent test datasets. (A) Performance on the TD1 dataset that contained 209 cancer and 73 normal samples, with the ROC curve showing an AUC of 0.9988 and the PRC curve showing an AUC of 0.999. (B) Performance on the GSE18842 dataset that contained 46 cancer and 45 normal samples, with the ROC curve showing an AUC of >0.99 and the PRC curve showing an AUC of >0.99. (C) Performance on the GSE27262 dataset that contained 25 cancer and 25 normal samples, with the ROC curve showing an AUC of >0.99 and the PRC curve showing an AUC of >0.99. (D) Performance on the GSE19804 dataset that contained 60 cancer and 60 normal samples, with the ROC curve showing an AUC of 0.95 and the PRC curve showing an AUC of 0.96. The ROC graphs plot the true positive rate (sensitivity on the y-axis) versus the false positive rate (1-specificity on the x-axis) for all possible thresholds. The value of the AUC varies from 0 to 1. The larger the value of the AUC, the better the model can differentiate between lung cancer and normal samples. The diagonal dashed line represents an AUC of 0.5, which indicates random prediction by the model. The PRC plots the precision (positive predictive value on the y-axis) versus the recall (sensitivity or true positive rate on the x-axis) for all possible thresholds. The larger the AUC, the better the model’s performance. The ROC and PRC curves were built with the R package precrec.
Figure 5
Figure 5
Sub-network of the signature genes and their functional enrichment identified through the LASSO. (A) Interaction network of genes identified through transcriptome–interactome signatures and their first neighbors. The genes are represented as red nodes, while their first neighbors are shown in green. (B) Functional enrichment analysis of 17 targets against the pathway database KEGG and biological process in the Gene Ontology database.

References

    1. Sung H., Ferlay J., Siegel R.L., Laversanne M., Soerjomataram I., Jemal A., Bray F. Global Cancer Statistics 2020: GLOBOCAN Estimates of Incidence and Mortality Worldwide for 36 Cancers in 185 Countries. CA A Cancer J. Clin. 2021;71:209–249. doi: 10.3322/caac.21660. - DOI - PubMed
    1. Remon J., Hendriks L.E.L. Targeted therapies for unresectable stage III non-small cell lung cancer. Mediastinum. 2021;5:22. doi: 10.21037/med-21-8. - DOI - PMC - PubMed
    1. Beckett P., Tata L.J., Hubbard R.B. Risk factors and survival outcome for non-elective referral in non-small cell lung cancer patients--analysis based on the National Lung Cancer Audit. Lung Cancer. 2014;83:396–400. doi: 10.1016/j.lungcan.2013.10.010. - DOI - PubMed
    1. Iyer S., Taylor-Stokes G., Roughley A. Symptom burden and quality of life in advanced non-small cell lung cancer patients in France and Germany. Lung Cancer. 2013;81:288–293. doi: 10.1016/j.lungcan.2013.03.008. - DOI - PubMed
    1. Walker M.S., Wong W., Ravelo A., Miller P.J.E., Schwartzberg L.S. Effectiveness outcomes and health related quality of life impact of disease progression in patients with advanced nonsquamous NSCLC treated in real-world community oncology settings: Results from a prospective medical record registry study. Health Qual. Life Outcomes. 2017;15:160. doi: 10.1186/s12955-017-0735-4. - DOI - PMC - PubMed

LinkOut - more resources