Review
. 2022 Dec 9;12(24):3478.
doi: 10.3390/ani12243478.

Advances, Implications, and Limitations of Low-Crude-Protein Diets in Pig Production

Affiliations
Review

Advances, Implications, and Limitations of Low-Crude-Protein Diets in Pig Production

Gabriel Cipriano Rocha et al. Animals (Basel). .

Abstract

Currently, five crystalline essential amino acids (Lys, Met, Thr, Trp, and Val) are generally used, allowing formulation of low-crude-protein (CP) diets. Moreover, Ile may also be used depending on its economic value and the specific feeding program. Experimentally, it has been shown that further reduced CP levels can be achieved by supplemental His, Leu, and Phe to the diets. However, decreasing the dietary CP level while maintaining optimal ratios of amino acids has shown contradictory effects on pigs' growth performance. Due to the divergence in the literature and the importance for practical formulation strategies in the swine industry, a literature review and a meta-analysis were performed to estimate the minimum CP level that would not compromise pig performance. Based on the present review, there is a minimum CP level after which the growth performance of pigs can be compromised, even though diets are balanced for essential amino acids. Considering average daily gain and gain to feed, respectively, these levels were estimated to be 18.4% CP (95% confidence interval [CI]: 16.3 to 18.4) and 18.3% CP (95% CI: 17.4 to 19.2) for nursery, 16.1% CP (95% CI: 16.0 to 16.2) and 16.3% CP (95% CI: 14.5 to 18.0) for growing, and 11.6% CP (95% CI: 10.8 to 12.3) and 11.4% CP (95% CI: 10.3 to 12.5) for finishing pigs.

Keywords: essential amino acids; functional amino acids; growth performance; lysine; non-essential amino acids; pigs.


Conflict of interest statement

The authors declare no conflict of interest.

Figures

Figure 1
Figure 1
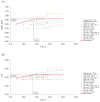
Changes in ADG (A) and G:F (B) in response to dietary CP in the nursery phase using a broken-line analysis. The equation for ADG was ADG = 0.379 − 0.016 × zl (R2 = 0.98) and the breakpoint was CP level at 18.4% (95% CI: 16.3–18.4) when ADG was 0.379 kg/d. The p-value for the asymptote was <0.001, for the slope it was <0.001, and for the breaking point it was <0.001. The equation for G:F was G:F = 0.679 − 0.023 × z1 (R2 = 0.91) and breakpoint was CP level at 18.3% (95% CI: 17.4–19.2) when G:F was 0.679. The p-value for the asymptote was <0.001, for the slope it was <0.001, and for the breaking point it was <0.001. Where, if CP is ≥breakpoint, then z1 = 0; if CP is <breakpoint, then z1 = CP − breakpoint [6,9,11,19,23,24,26,27,29,30,35,36,37,49,50,51,52].
Figure 1
Figure 1
Changes in ADG (A) and G:F (B) in response to dietary CP in the nursery phase using a broken-line analysis. The equation for ADG was ADG = 0.379 − 0.016 × zl (R2 = 0.98) and the breakpoint was CP level at 18.4% (95% CI: 16.3–18.4) when ADG was 0.379 kg/d. The p-value for the asymptote was <0.001, for the slope it was <0.001, and for the breaking point it was <0.001. The equation for G:F was G:F = 0.679 − 0.023 × z1 (R2 = 0.91) and breakpoint was CP level at 18.3% (95% CI: 17.4–19.2) when G:F was 0.679. The p-value for the asymptote was <0.001, for the slope it was <0.001, and for the breaking point it was <0.001. Where, if CP is ≥breakpoint, then z1 = 0; if CP is <breakpoint, then z1 = CP − breakpoint [6,9,11,19,23,24,26,27,29,30,35,36,37,49,50,51,52].
Figure 2
Figure 2
Changes in ADG (A) and G:F (B) in response to L-lysine supplementation in the nursery phase using a broken-line analysis. The L-lysine axis is based on 100% purity, calculated from L-lysine HCl (78.8% purity) or L-lysine sulfate (60.0% purity). The equation for ADG was ADG = 0.378 + 0.202 × zl (R2 = 0.97) and the breakpoint was L-lysine level at 0.42% (95% CI: 0.30–0.53) when ADG was 0.378 kg/d. The p-value for the asymptote was <0.001, for the slope it was <0.001, and for the breaking point it was <0.001. The equation for G:F was G:F = 0.678 + 0.301 × z1 (R2 = 0.91) and breakpoint was CP level at 0.43% (95% CI: 0.35–0.50) when G:F was 0.678. The p-value for the asymptote was <0.001, for the slope it was <0.001, and for the breaking point it was <0.001. Where, if L-lysine is ≤breakpoint, then z1 = 0; if L-lysine is >breakpoint, then z1 = L-lysine − breakpoint [6,9,11,19,23,24,26,27,29,30,35,36,37,49,50,51,52].
Figure 3
Figure 3
Changes in ADG (A) and G:F (B) in response to the ratio between standard ilea digestible Lys to crude protein (SID Lys:CP) in the nursery phase using a broken-line analysis. The equation for ADG was ADG = 0.393 + 0.035 × zl (R2 = 0.98) and the breakpoint was SID Lys:CP ratio at 6.6% (95% CI: 5.9–7.2) when ADG was 0.393 kg/d. The p-value for the asymptote was <0.001, for the slope it was <0.001, and for the breaking point it was <0.001. The equation for G:F was G:F = 0.682 + 0.041 × z1 (R2 = 0.91) and breakpoint was SID Lys:CP ratio at 6.6% (95% CI: 6.1–7.0 ) when G:F was 0.682. The p-value for the asymptote was <0.001, for the slope it was <0.001, and for the breaking point it was <0.001. Where, if SID Lys:CP is ≤breakpoint, then z1 = 0; if SID Lys:CP is >breakpoint, then z1 = SID Lys:CP − breakpoint. [6,9,11,19,23,24,26,27,29,30,35,36,37,49,50,51,52].
Figure 4
Figure 4
Changes in ADG (A) and G:F (B) in response to dietary CP in the growing phase using a broken-line analysis. The equation for ADG was ADG = 0.787 − 0.010 × zl (R2 = 0.93) and the breakpoint was CP level at 16.1% (95% CI: 16.0–16.2) when ADG was 0.787 kg/d. The p-value for the asymptote was <0.001, for the slope it was 0.050, and for the breaking point it was <0.001. The equation for G:F was G:F = 0.482 − 0.008 × z1 (R2 = 0.93) and breakpoint was CP level at 16.3% (95% CI: 14.5–18.0) when G:F was 0.482. The p-value for the asymptote was <0.001, for the slope it was 0.008, and for the breaking point it was <0.001. Where, if CP is ≥breakpoint, then z1 = 0; if CP is <breakpoint, then z1 = CP − breakpoint [7,8,11,13,14,18,55,56,57,58,59,62,63,64,65,66,67].
Figure 5
Figure 5
Changes in ADG (A) and G:F (B) in response to dietary CP in the finishing phase using a broken-line analysis. The equation for ADG was ADG = 0.924 − 0.048 × zl (R2 = 0.98) and the breakpoint was CP level at 11.6% (95% CI: 10.8–12.3) when ADG was 0.924 kg/d. The p-value for the asymptote was <0.001, for the slope it was 0.050, and for the breaking point it was <0.001. The equation for G:F was G:F = 0.327 − 0.014 × z1 (R2 = 0.96) and breakpoint was CP level at 11.4% (95% CI: 10.3–12.5) when G:F was 0.327. The p-value for the asymptote was <0.001, for the slope it was 0.006, and for the breaking point it was <0.001. Where, if CP is ≥breakpoint, then z1 = 0; if CP is <breakpoint, then z1 = CP − breakpoint [12,17,68,69,70,71,72,78,79,80,81,82].
Figure 6
Figure 6
Changes in ADG in response to L-lysine supplementation in the finishing phase using a broken-line analysis. The L-lysine axis is based on 100% purity, calculated from L-lysine HCl (78.8% purity) or L-lysine sulfate (60.0% purity). The equation was ADG = 0.926 + 0.314 × zl (R2 = 0.97) and the breakpoint was L-lysine level at 0.24% (95% CI: 0.10–0.37) when ADG was 0.926 kg/d. The p-value for the asymptote was <0.001, for the slope it was 0.033, and for the breaking point it was 0.002. Where, if L-lysine is ≤breakpoint, then z1 = 0; if L-lysine is >breakpoint, then z1 = L-lysine − breakpoint [12,17,68,69,70,71,72,78,79,80,81,82].

References

    1. National Research Council . NRC Nutrient Requirements of Swine. 11th ed. National Academies Press; Washington, DC, USA: 2012.
    1. Kim S.W., Hansen J.A. Diet Formulation and Feeding Programs. In: Chiba L.I., editor. Sustainable Swine Nutrition. Blackwell Publishing Ltd.; Oxford, UK: 2022. pp. 217–227.
    1. Rostagno H.S.S., Albino L.F.T., Donzele J.L., Gomes P.C., de Oliveira R.F., Lopes D.C., Ferreira A.S., Barreto S.L.T., Euclides R. Brazilian Tables for Poultry and Swine. 4th ed. UFV, Universidade Federal de Viçosa, Departamento de Zootecnia; Viçosa, Brazil: 2017.
    1. van Milgen J., Dourmad J.-Y. Concept and application of ideal protein for pigs. J. Anim. Sci. Biotechnol. 2015;6:15. doi: 10.1186/s40104-015-0016-1. - DOI - PMC - PubMed
    1. Chung T.K., Baker D.H. Ideal amino acid pattern for 10-kilogram pigs. J. Anim. Sci. 1992;70:3102–3111. doi: 10.2527/1992.70103102x. - DOI - PubMed

LinkOut - more resources