. 2022 Dec 13;12(24):3524.
doi: 10.3390/ani12243524.

Quercetin Ameliorates Lipopolysaccharide-Induced Duodenal Inflammation through Modulating Autophagy, Programmed Cell Death and Intestinal Mucosal Barrier Function in Chicken Embryos

Affiliations

Quercetin Ameliorates Lipopolysaccharide-Induced Duodenal Inflammation through Modulating Autophagy, Programmed Cell Death and Intestinal Mucosal Barrier Function in Chicken Embryos

Jinhai Yu et al. Animals (Basel). .

Abstract

Diarrhea has been a global health problem for centuries, and the treatment has become increasingly difficult duo to the antibiotics overuse and resistance. Quercetin is a common flavonoid of extracts of vegetables, fruits, and traditional Chinese herbs, however, the mechanism of quercetin alleviating LPS-induced duodenal inflammation remains elusive. Specific pathogen-free chicken embryos (n = 120) were allocated to groups including control, PBS with or without alcohol, LPS (125 ng/egg) with or without quercetin (10, 20, or 40 nmol/egg, respectively), and quercetin groups (10, 20, or 40 nmol/egg). Fifteen day-old embryonated eggs were inoculated with abovementioned solutions via the allantoic cavity. At embryonic day 19, the duodena of the embryos were collected for histopathological examination, RNA extraction and real-time polymerase chain reaction, immunohistochemical investigations, and Western blotting. The results demonstrated quercetin enhanced the inflammatory cell infiltration in the Peyer's patch of the intestinal mucosa after LPS induction. The LPS-induced expressions of these inflammation-related factors (TLR4, IL-1β, MMP3, MMP9, NFKB1, IFNγ, IL-8, IL-6) were completely blocked by quercetin. Quercetin also decreased the protein expression of TLR4, IL-1β, MMP3, and MMP9 after LPS induction. Quercetin could down-regulate autophagy gene expression (ATG5, LC3-1, LC3-2, and LKB1), and decreased the protein expression of ATG5, and LC3-1/LC3-2 after LPS induction. Quercetin treatment prevented LPS-induced increases of the gene expressions of programmed cell death factors (TNFα, Fas, CASP1, CASP3, CASP12, Drp1, and RIPK1); meanwhile, quercetin decreased the protein expression of CASP1 and CASP3 after LPS challenge. LPS reduced the gene expression of mucin 2, but upregulated the mRNA and protein expression of claudin 1, occludin, and ZO-1, and this was balanced by quercetin. This evidence suggests that quercetin can alleviate duodenal inflammation induced by LPS through modulating autophagy, programmed cell death, intestinal barrier function.

Keywords: Traditional Chinese Medicine; autophagy; diarrhea; intestinal mucosal barrier function; programmed cell death; quercetin.


Conflict of interest statement

The authors declare no conflict of interest.

Figures

Figure 1
Figure 1
Bioactive ingredients of Chinese herbal medicines with antidiarrheal effects. Green square: Abbreviation of Chinese herbal medicines with antidiarrheal effect as shown in Table 1. Red circle: Bioactive ingredients. The selected Chinese herbal medicines were analyzed for bioactive ingredients on the Traditional Chinese Medicine Systems Pharmacology Database and Analysis platform (TCMSP; https://tcmspw.com/tcmsp.php (accessed from 10 November 2019 to 22 February 2021). Each selected Chinese herbal medicine contains 2 to 92 bioactive ingredients, yielding a total of 291 bioactive ingredients of the 28 Chinese herbal medicines. The 291 active ingredients were analyzed on Cytoscape (3.7.2 edition). Three active ingredients, quercetin, kaempferol, and beta-sitosterol, were selected based on the highest networking node degrees. Quercetin was presented in 23 Chinese herbal medicines in 28 ones (MOL000098: quercetin, node degree = 23), and kaempferol and beta-sitosterol in 19 Chinese herbal medicines in 28 ones (MOL000422: kaempferol, node degree = 19; MOL000358: beta-sitosterol, node degree = 19).
Figure 2
Figure 2
Gene ontology (GO) and the Kyoto encyclopedia of genes and genomes (KEGG) enrichment analysis of candidate gene targets associated with diarrhea. (A) Biological process; (B) Cellular components; (C) Molecular functions; (D) KEGG pathways. The target genes were subjected to gene ontology (GO) and Kyoto Encyclopedia of Genes and Genomes (KEGG) pathway enrichment analyses in the Database for Annotation, Visualization and Integrated Discovery (DAVID) to predict molecular biology functions, biology process, and cytology component, and signaling pathways (https://david-d.ncifcrf.gov/tools.jsp (accessed on 22 September 2020).
Figure 2
Figure 2
Gene ontology (GO) and the Kyoto encyclopedia of genes and genomes (KEGG) enrichment analysis of candidate gene targets associated with diarrhea. (A) Biological process; (B) Cellular components; (C) Molecular functions; (D) KEGG pathways. The target genes were subjected to gene ontology (GO) and Kyoto Encyclopedia of Genes and Genomes (KEGG) pathway enrichment analyses in the Database for Annotation, Visualization and Integrated Discovery (DAVID) to predict molecular biology functions, biology process, and cytology component, and signaling pathways (https://david-d.ncifcrf.gov/tools.jsp (accessed on 22 September 2020).
Figure 3
Figure 3
Histopathologic changes of the duodenum induced by LPS and treated with quercetin, with 40 nmol/egg in chicken embryos. Fifteen day-old embryonated eggs were inoculated with LPS (125 ng/egg) and quercetin (Q) at 40 nmol/egg by injection into the allantoic cavity. The duodenum was histologically examined on day 19 (4 days after treatment). Hematoxylin and eosin staining. (A) Control group; (B) There were inflammatory cell infiltration in the Peyer’s patch in LPS group (arrow); (C) Treatment group (125ng LPS/egg + 40 nmol quercetin/egg). The right photo was the rectangle of the left one magnified by 2 folds. Scale bar of left photo (200×): 50 μm. Scale bar of right photo (400×): 20 μm. V: villus; Cr: crypt; P: Peyer’s patch; L: lamina propria; CM: muscularis externa, inner circular; LM: muscularis externa, outer longitudinal.
Figure 3
Figure 3
Histopathologic changes of the duodenum induced by LPS and treated with quercetin, with 40 nmol/egg in chicken embryos. Fifteen day-old embryonated eggs were inoculated with LPS (125 ng/egg) and quercetin (Q) at 40 nmol/egg by injection into the allantoic cavity. The duodenum was histologically examined on day 19 (4 days after treatment). Hematoxylin and eosin staining. (A) Control group; (B) There were inflammatory cell infiltration in the Peyer’s patch in LPS group (arrow); (C) Treatment group (125ng LPS/egg + 40 nmol quercetin/egg). The right photo was the rectangle of the left one magnified by 2 folds. Scale bar of left photo (200×): 50 μm. Scale bar of right photo (400×): 20 μm. V: villus; Cr: crypt; P: Peyer’s patch; L: lamina propria; CM: muscularis externa, inner circular; LM: muscularis externa, outer longitudinal.
Figure 4
Figure 4
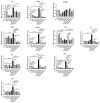
Quercetin attenuates LPS-induced duodenal inflammation. Fifteen day-old embryonated eggs were inoculated with LPS (125 ng/egg, dissolved in PBS) and quercetin (Q) at 10, 20, or 40 nmol/egg (dissolved in ethanol) or dosing vehicle (PBS, PBS + ethanol) by injection into the allantoic cavity. Duodenum tissue on day 19 was analyzed for mRNA expression of cytokines, enzymes or receptors by real-time PCR. Values and quantitative data are expressed as mean ± SD in each group. * p < 0.05; ** p < 0.01; *** p < 0.001; **** p < 0.0001.
Figure 5
Figure 5
Immunohistochemical detection in HRP of TLR4 in the duodenum induced by LPS (125 ng/egg) and treated with 40nmol/egg quercetin in chicken embryos (×400). (A) Antibody for TLR4 revealed weak immunopositivity in the villi, myenteric plexus, tunica muscularis of control samples; (B) The immunopositivity in the villus, crypt, lamina propria, Peyer’s patch, tunica muscularis, and serosa of intestinal mucosa increased after LPS induction compared with that of control group; (C) The immunopositivity to TLR4 in treatment group (125 ng LPS/egg + 40 nmol Q/egg) significantly decreased when compared with that of LPS group; (D) Relative TLR4-immunopositive area. Immunopositivity to TLR4 (arrow, brown to yellow). Scale bar: 100 μm. V: villus; Cr: crypt; P: Peyer’s patch; L: lamina propria; CM: muscularis externa, inner circular; LM: muscularis externa, outer longitudinal; S: serosa; MP: myenteric plexus. Values and quantitative data are expressed as mean ± SD in each group. *** p < 0.001.
Figure 6
Figure 6
Immunohistochemical detection in HRP of MMP3 in the duodenum induced by LPS (125 ng/egg) and treated with 40nmol/egg quercetin in chicken embryos (×400). (A) Antibody for MMP3 revealed weak immunopositivity in the villi, crypts, tunica muscularis, and serosa of control samples; (B) The immunopositivity in the villus, crypt, and lamina propria increased after LPS induction compared with that of control group; (C) The immunopositivity to MMP3 in treatment group (125 ng LPS /egg + 40 nmol Q/egg) significantly decreased whhen compared with that of LPS group; (D) Relative MMP3-immunopositive area. Immunopositivity to MMP3 (arrow, brown to yellow). Scale bar: 100 μm. See the abbreviation for Figure 5. Values and quantitative data are expressed as mean ± SD in each group. * p < 0.05.
Figure 7
Figure 7
Immunohistochemical detection in HRP of MMP9 in the duodenum induced by LPS (125 ng/egg) and treated with 40nmol/egg quercetin in chicken embryos (×400). (A) Antibody for MMP9 revealed weak immunopositivity in the villi and tunica muscularis of intestinal mucosa of control samples; (B) The immunopositivity in the villus, crypt, lamina propria, and tunica muscularis of intestinal mucosa increased after LPS induction compared with that of control group; (C) The immunopositivity to MMP9 in treatment group (125 ng LPS /egg + 40 nmol Q/egg) significantly decreased when compared with that of LPS group; (D) Relative MMP9-immunopositive area. Immunopositivity to MMP9 (arrow, brown to yellow). Scale bar: 100 μm. See the abbreviation for Figure 5. Values and quantitative data are expressed as mean ± SD in each group. ** p < 0.01.
Figure 8
Figure 8
The protein expression level of TLR4, IL-1β, MMP3 and MMP9 after LPS induction in chicken embryos. Control, vehicle group; LPS, LPS group: 125 ng LPS /egg; LPS + quercetin: treatment group, (125 ng LPS + 40 nmol Q)/egg. Values and quantitative data are expressed as mean ± SD in each group. * p < 0.05; ** p < 0.01; *** p < 0.001.
Figure 9
Figure 9
Quercetin ameliorates LPS-induced increase in expression of autophagy genes. See legends for Figure 4. Values and quantitative data are expressed as mean ± SD in each group. * p < 0.05; ** p < 0.01; *** p < 0.001.
Figure 10
Figure 10
Immunohistochemical detection in HRP of ATG5 in duodenum induced by LPS (125 ng/egg) and treated with 40 nmol/egg quercetin in chicken embryos (×400). (A) Antibody for ATG5 revealed weak immunopositivity in the villi, crypts, and tunica muscularis of intestinal mucosa of control samples; (B) The immunopositivity in the villi, crypts, lamina propria, myenteric plexus, and tunica muscularis of intestinal mucosa increased after LPS induction compared with that of the control group; (C) The immunopositivity to ATG5 in the treatment group (125 ng LPS /egg + 40 nmol Q/egg) significantly decreased when compared with that of LPS group; (D) Relative ATG5-immunopositive area. Immunopositivity to ATG5 (arrow, brown to yellow). Scale bar: 100 μm. See the abbreviation for Figure 5. Values and quantitative data are expressed as mean ± SD in each group. * p < 0.05.
Figure 11
Figure 11
Immunohistochemical detection in HRP of LC3-1/2 in duodenum induced by LPS (125ng/egg) and treated with 40nmol/egg quercetin in chicken embryos (×400). (A) Antibody for LC3-1/2 revealed weak immunopositivity in the villi, crypts, and tunica muscularis of intestinal mucosa of control samples; (B) The immunopositivity in the villus, crypt, lamina propria, and tunica muscularis increased after LPS induction compared with that of the control group; (C) The immunopositivity to LC3-1/2 I then treatment group (125 ng LPS /egg + 40 nmol Q/egg) significantly decreased which compared with that of the LPS group; (D) Relative LC3-1/2-immunopositive area. Immunopositivity to LC3-1/2 (arrow, brown to yellow). Scale bar: 100 μm. See the abbreviation for Figure 5. Values and quantitative data are expressed as mean ± SD in each group. * p < 0.05.
Figure 12
Figure 12
Quercetin inhibits LPS-induced programmed cell death. See legends for Figure 4. Values and quantitative data are expressed as mean ± SD in each group. * p < 0.05; ** p < 0.01; *** p < 0.001; **** p < 0.0001.
Figure 13
Figure 13
Immunohistochemical detection in HRP of CASP1 in duodenum induced by LPS (125 ng/egg) and treated with 40nmol/egg quercetin in chicken embryos (×400). (A) Antibody for CASP1 revealed weak immunopositivity in the villi, crypts, and tunica muscularis of control samples; (B) The immunopositivity in the villi, crypts, lamina propria, myenteric plexus, Peyer’s patch, and tunica muscularis increased after LPS induction compared with that of the control group; (C) The immunopositivity to CASP1 in the treatment group (125 ng LPS /egg + 40 nmol Q/egg) significantly decreased when compared with that of the LPS group; (D) Relative CASP1-immunopositive area. Immunopositivity to CASP1 (arrow, brown to yellow). Scale bar: 100 μm. See the abbreviation for Figure 5. Values and quantitative data are expressed as mean ± SD in each group. ** p < 0.01.
Figure 14
Figure 14
Immunohistochemical detection in HRP of CASP3 in duodenum induced by LPS (125 ng/egg) and treated with 40nmol/egg quercetin in chicken embryos (×400). (A) Antibody for CASP3 revealed weak immunopositivity in the villi, crypts, lamina propria, and tunica muscularis of intestinal mucosa of control samples; (B) The immunopositivity in the villus, crypt, lamina propria, myenteric plexus, Peyer’s patch, and tunica muscularis increased after LPS induction compared with that of the control group; (C) The immunopositivity to CASP3 in treatment group (125 ng LPS /egg + 40 nmol Q/egg) significantly decreased when compared with that of LPS group; (D) Relative CASP3-immunopositive area. Immunopositivity to CASP3 (arrow, brown to yellow). Scale bar: 100 μm. See the abbreviation for Figure 5. Values and quantitative data are expressed as mean ± SD in each group. * p < 0.05; ** p < 0.01.
Figure 15
Figure 15
The protein expression level of CASP1 and CASP3 after LPS induction in chicken embryos. Control, vehicle group; LPS, LPS group: 125ng LPS /egg; LPS + quercetin: treatment group, (125 ng LPS + 40 nmol Q)/egg. Values and quantitative data are expressed as mean ± SD in each group. * p < 0.05; ** p < 0.01; *** p < 0.001.
Figure 16
Figure 16
Quercetin ameliorates LPS-induced impairment of intestinal mucosal barrier functions. See legends for Figure 4. Values and quantitative data are expressed as mean ± SD in each group. * p < 0.05; ** p < 0.01; *** p < 0.001; **** p < 0.0001.
Figure 17
Figure 17
Immunohistochemical detection in HRP of claudin 1 in duodenum induced by LPS (125 ng/egg) and treated with 40 nmol/egg quercetin in chicken embryos (×400). (A) Antibody for claudin 1 revealed weak immunopositivity in the lamina propria, tunica muscularis, and serosa of intestinal mucosa of control samples, and no immunoreactivity in the intestinal villi and crypts; (B) The immunopositivity in the villus, crypt, lamina propria, and tunica muscularis of intestinal mucosa increased after LPS induction compared with that of the control group; (C) The immunopositivity to claudin 1 in treatment group (125 ng LPS /egg + 40 nmol Q/egg) significantly decreased when compared with that of the LPS group; (D) Relative claudin 1-immunopositive area. Immunopositivity to claudin 1 (arrow, brown to yellow). Scale bar: 100 μm. See the abbreviation for Figure 5. Values and quantitative data are expressed as mean ± SD in each group. * p < 0.05; ** p < 0.01.
Figure 18
Figure 18
Immunohistochemical detection in HRP of ZO-1 in duodenum induced by LPS (125 ng/egg) and treated with 40nmol/egg quercetin in chicken embryos (×400). (A) Antibody for ZO-1 revealed immunopositivity in the lamina propria and tunica muscularis of intestinal mucosa of control samples, and weak immunoreactivity in the intestinal villi and crypts; (B) The immunopositivity in the villus, crypt, lamina propria, and tunica muscularis of intestinal mucosa increased after LPS induction compared with that of the control group; (C) The immunopositivity to ZO-1 in treatment group (125 ng LPS /egg + 40 nmol Q/egg) significantly decreased when compared with that of control group; (D) Relative ZO-1-immunopositive area. Immunopositivity to ZO-1 (arrow, brown to yellow). Scale bar: 100 μm. See the abbreviation for Figure 5. Values and quantitative data are expressed as mean ± SD in each group. * p < 0.05; ** p < 0.01; *** p < 0.001.
Figure 19
Figure 19
The protein expression level of claudin 1 and occludin after LPS induction in chicken embryos. Control, vehicle group; LPS, LPS group: 125 ng LPS /egg; LPS + quercetin: treatment group, (125 ng LPS + 40 nmol Q)/egg. Values and quantitative data are expressed as mean ± SD in each group. ** p < 0.01; *** p < 0.001.

Similar articles

Cited by

References

    1. Troeger C., Blacker B.F., Khalil I.A., Rao P.C., Cao S.J., Zimsen S.R.M., Albertson S., Stanaway J.D., Deshpande A., Brown A., et al. Estimates of the global, regional, and national morbidity, mortality, and aetiologies of diarrhoea in 195 countries: A systematic analysis for the Global Burden of Disease Study 2016. Lancet Infect. Dis. 2018;18:1211–1228. doi: 10.1016/S1473-3099(18)30362-1. - DOI - PMC - PubMed
    1. Mountzouris K.C., Balaskas C., Xanthakos I., Tzivinikou A., Fegeros K. Effects of a multi-species probiotic on biomarkers of competitive exclusion efficacy in broilers challenged with Salmonella enteritidis. Br. Poult. Sci. 2009;50:467–478. doi: 10.1080/00071660903110935. - DOI - PubMed
    1. Elbediwi M., Tang Y., Shi D., Ramadan H., Xu Y., Xu S., Li Y., Yue M. Genomic Investigation of Antimicrobial-Resistant Salmonella enterica Isolates From Dead Chick Embryos in China. Front. Microbiol. 2021;12:684400. doi: 10.3389/fmicb.2021.684400. - DOI - PMC - PubMed
    1. Al-Ogaili A.S., Hameed S.S., Noori N. LPS-induced NLRP3 gene expression in chicken. Open Vet. J. 2022;12:197–203. doi: 10.5455/OVJ.2022.v12.i2.7. - DOI - PMC - PubMed
    1. Im E., Riegler F.M., Pothoulakis C., Rhee S.H. Elevated lipopolysaccharide in the colon evokes intestinal inflammation, aggravated in immune modulator-impaired mice. Am. J. Physiol. Gastrointest. Liver Physiol. 2012;303:G490–G497. doi: 10.1152/ajpgi.00120.2012. - DOI - PMC - PubMed