

Differential Expression Analysis of tRNA-Derived Small RNAs from Subcutaneous Adipose Tissue of Obese and Lean Pigs
- PMID: 36552481
- PMCID: PMC9774726
- DOI: 10.3390/ani12243561
Differential Expression Analysis of tRNA-Derived Small RNAs from Subcutaneous Adipose Tissue of Obese and Lean Pigs
Abstract
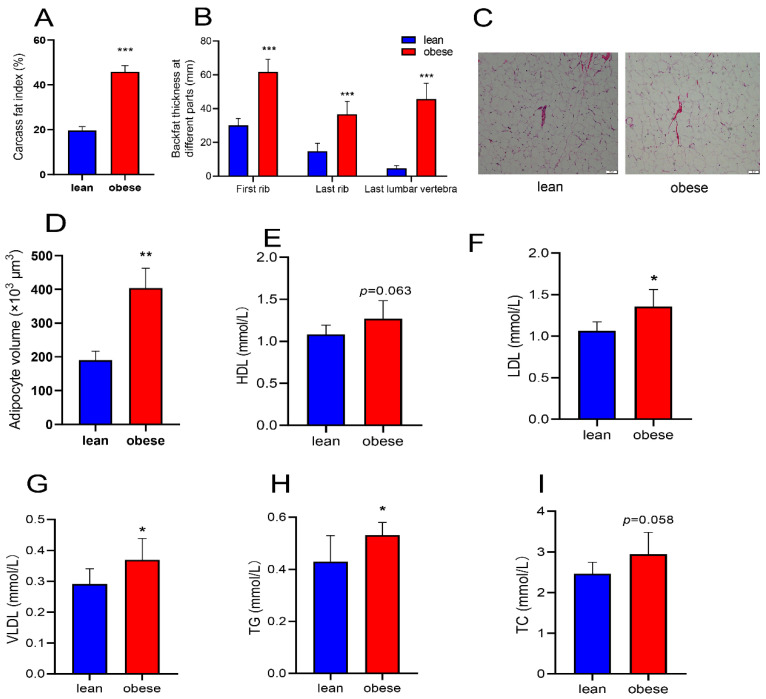
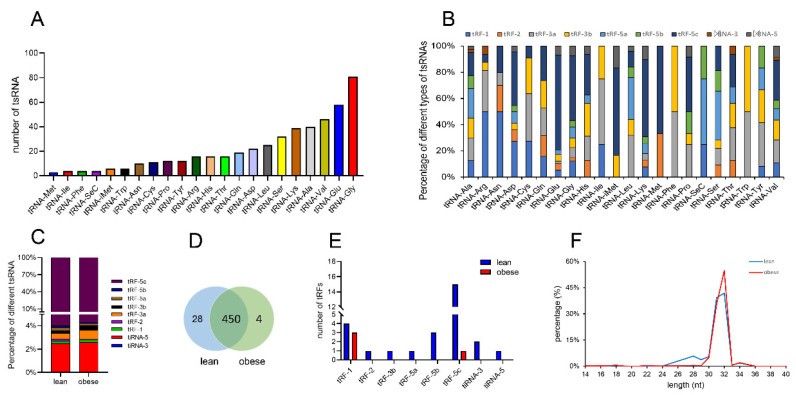
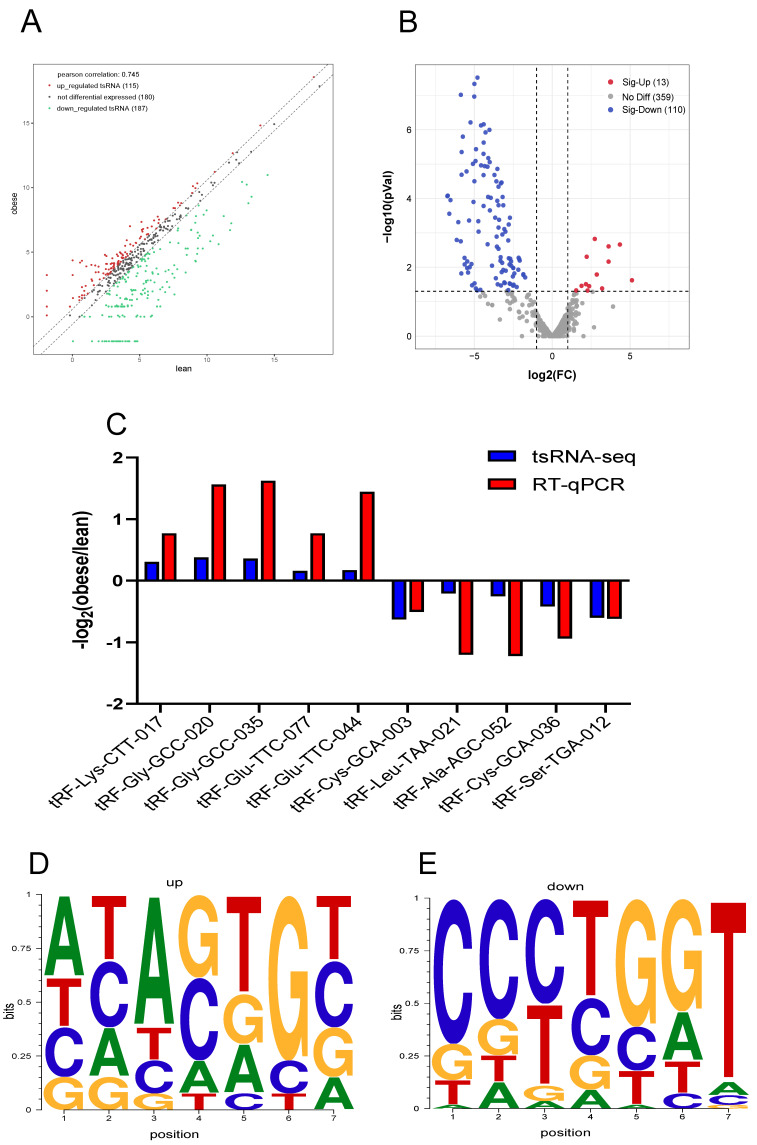
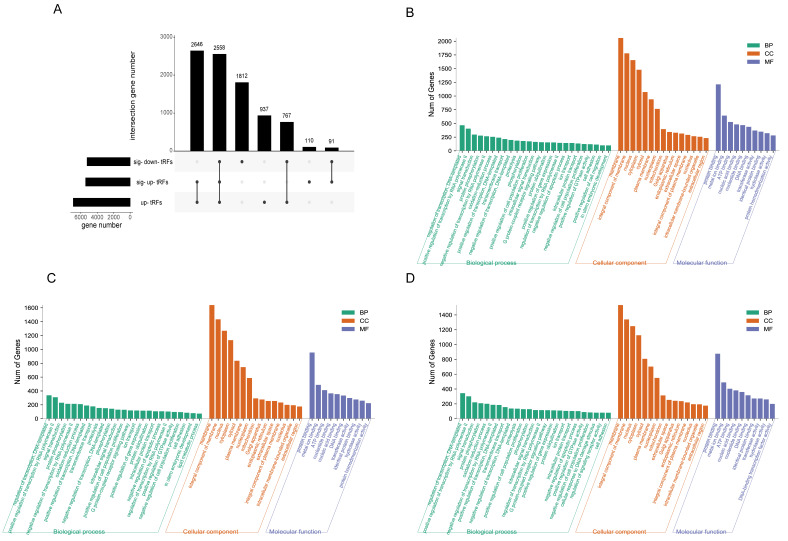
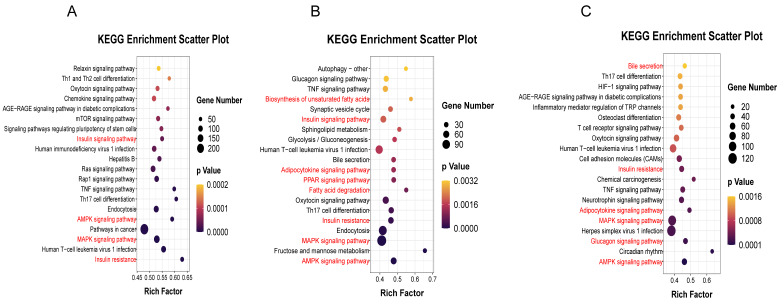
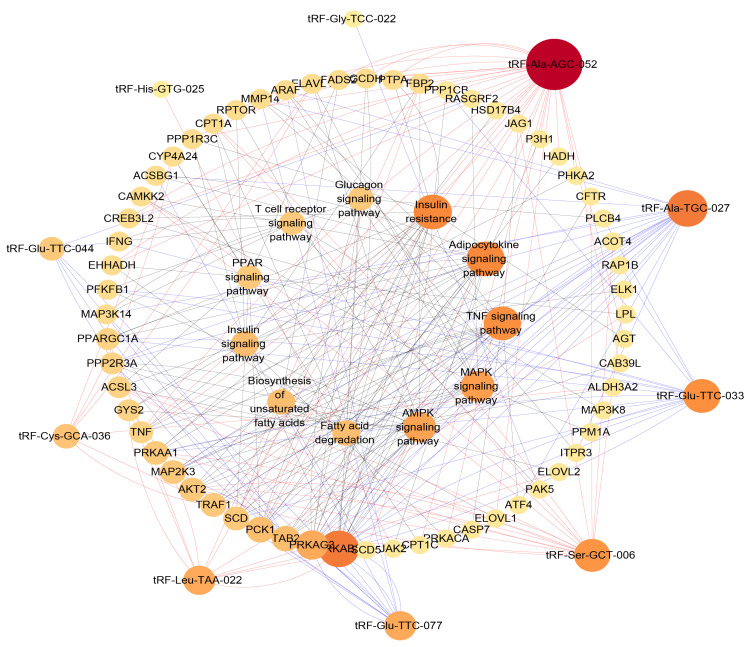
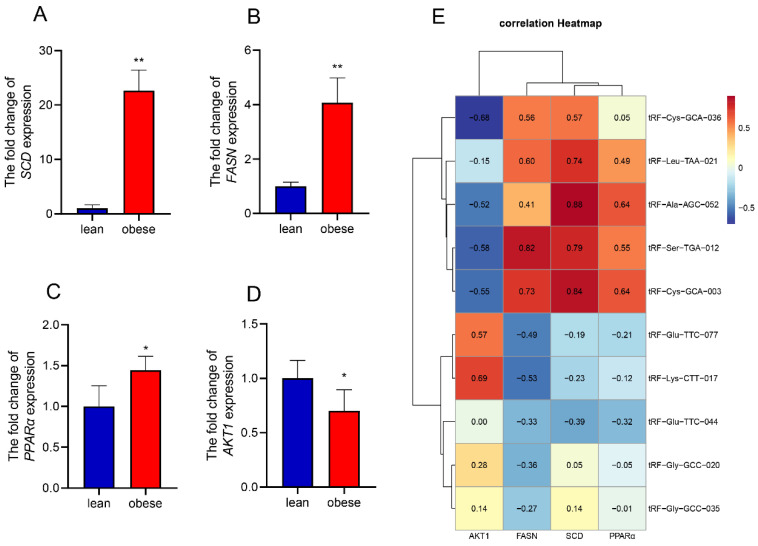
Epigenetic factors, including non-coding RNA regulation, play a vital role in the development of obesity and have been well researched. Transfer RNA-derived small RNA (tsRNA) is a class of non-coding RNA proven to be involved in various aspects of mammalian biology. Here we take pigs as a model for obesity research and use tsRNA-seq to investigate the difference in tsRNA expression in the subcutaneous adipose tissue of obese and lean pigs to elucidate the role of tsRNA in obesity development. A total of 482 tsRNAs were identified in pig adipose tissue, of which 123 were significantly differentially accumulated tsRNAs compared with the control group. The tRF-5c was the main type of these tsRNAs. The largest number of tsRNAs produced was the Gly-carrying tRNA, which produced 81 tsRNAs. Functional enrichment analysis revealed that differential tsRNAs indirectly participated in MAPK, AMPK, insulin resistance, the TNF signaling pathway, adipocytokine signaling pathway, and other signaling pathways by interacting with target genes. These are involved in bioenergetic metabolic regulatory processes, suggesting that tsRNAs may influence these pathways to mediate the regulation of energy metabolism in porcine adipocytes to promote lipid deposition, thus contributing to obesity. Our findings suggest a potential function of tsRNA in regulating obesity development.
Keywords: lipid deposition; obese; pig; subcutaneous adipose tissue; tsRNA.
Conflict of interest statement
The authors declare no conflict of interest.
Figures
Similar articles
-
tsRNA Landscape and Potential Function Network in Subcutaneous and Visceral Pig Adipose Tissue.Genes (Basel). 2023 Mar 23;14(4):782. doi: 10.3390/genes14040782. Genes (Basel). 2023. PMID: 37107540 Free PMC article.
-
Expression profiles and functional analysis of tRNA-derived small RNAs in epicardial adipose tissue of patients with heart failure.Ann Med. 2023;55(2):2267981. doi: 10.1080/07853890.2023.2267981. Epub 2023 Oct 15. Ann Med. 2023. PMID: 37839439 Free PMC article.
-
Unveiling the role of tRNA-derived small RNAs in MAPK signaling pathway: implications for cancer and beyond.Front Genet. 2024 Mar 26;15:1346852. doi: 10.3389/fgene.2024.1346852. eCollection 2024. Front Genet. 2024. PMID: 38596214 Free PMC article. Review.
-
Transfer RNA-derived small RNAs (tsRNAs) sequencing revealed a differential expression landscape of tsRNAs between glioblastoma and low-grade glioma.Gene. 2023 Mar 1;855:147114. doi: 10.1016/j.gene.2022.147114. Epub 2022 Dec 13. Gene. 2023. PMID: 36526122
-
Regulation of plant gene expression by tsRNAs in response to abiotic stress.PeerJ. 2025 May 23;13:e19487. doi: 10.7717/peerj.19487. eCollection 2025. PeerJ. 2025. PMID: 40421365 Free PMC article. Review.
Cited by
-
Identification of potential tissue-specific biomarkers involved in pig fat deposition through integrated bioinformatics analysis and machine learning.Heliyon. 2024 May 15;10(10):e31311. doi: 10.1016/j.heliyon.2024.e31311. eCollection 2024 May 30. Heliyon. 2024. PMID: 38807889 Free PMC article.
-
Transcriptome comparison revealed the difference in subcutaneous fat metabolism of Qinghai yak under different feeding conditions.PLoS One. 2024 Dec 5;19(12):e0311224. doi: 10.1371/journal.pone.0311224. eCollection 2024. PLoS One. 2024. PMID: 39637129 Free PMC article.
-
Effect of intramuscular treatment with different iron dextran dosages and non-inferiority study to gleptoferron.Acta Vet Scand. 2025 Jan 4;67(1):1. doi: 10.1186/s13028-024-00790-6. Acta Vet Scand. 2025. PMID: 39755680 Free PMC article.
-
Transcriptome Analysis Reveals the Early Development in Subcutaneous Adipose Tissue of Laiwu Piglets.Animals (Basel). 2024 Oct 14;14(20):2955. doi: 10.3390/ani14202955. Animals (Basel). 2024. PMID: 39457885 Free PMC article.
-
Dynamic changes in the transcriptome of tRNA-derived small RNAs related with fat metabolism.Sci Data. 2023 Oct 14;10(1):703. doi: 10.1038/s41597-023-02624-y. Sci Data. 2023. PMID: 37838754 Free PMC article.
References
Grants and funding
LinkOut - more resources
Full Text Sources
