

Upregulation of Antioxidative Gene Expression by Lasia spinosa Organic Extract Improves the Predisposing Biomarkers and Tissue Architectures in Streptozotocin-Induced Diabetic Models of Long Evans Rats
- PMID: 36552606
- PMCID: PMC9774390
- DOI: 10.3390/antiox11122398
Upregulation of Antioxidative Gene Expression by Lasia spinosa Organic Extract Improves the Predisposing Biomarkers and Tissue Architectures in Streptozotocin-Induced Diabetic Models of Long Evans Rats
Abstract
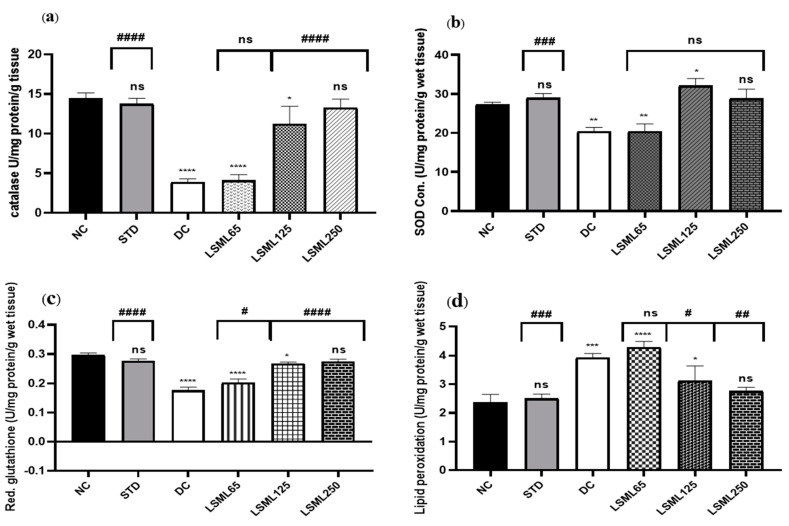
Plants are an entity essential to the function of the biosphere as well as human health. In the context of human health, this research investigated the effect of Lasia spinosa (Lour) leaf methanolic extracts (LSML) on antioxidative enzymes and gene expression as well as biochemical and histological markers in a streptozotocin (STZ)-induced diabetes model. Fructose-fed streptozotocin (STZ)-induced diabetic animals were subjected to a four-week intervention followed by the assessment of the animal’s blood and tissues for enzymatic, biochemical, histological, and genetic changes. LSML-treated groups were shown to decrease plasma glucose levels and improve body and organ weights compared to the untreated group in a dose-dependent manner. At the doses of 125 and 250 mg/kg b.w., LSML were able to normalize serum, hepatic, and renal biochemical parameters and restore the pancreas, kidney, liver, and spleen tissue architectures to their native state. A considerable increase (p < 0.01) of liver antioxidant enzymes CAT, SOD, GSH, and a decrease of MDA level in LSML-treated groups were found at higher doses. The improved mRNA expression level of antioxidant genes CAT, SOD2, PON1, and PFK1 was also found at the doses of 125 mg/kg and 250 mg/kg BW when compared to untreated control groups. The results demonstrate that LSML impacts the upregulation of antioxidative gene expressions, thus improving the diabetic complications in animal models which need to be affirmed by compound-based antioxidative actions for therapeutic development.
Keywords: Lasia spinosa; MDA; PON1; SOD2; antioxidant; β-ACTIN.
Conflict of interest statement
The authors declare no conflict of interest.
Figures


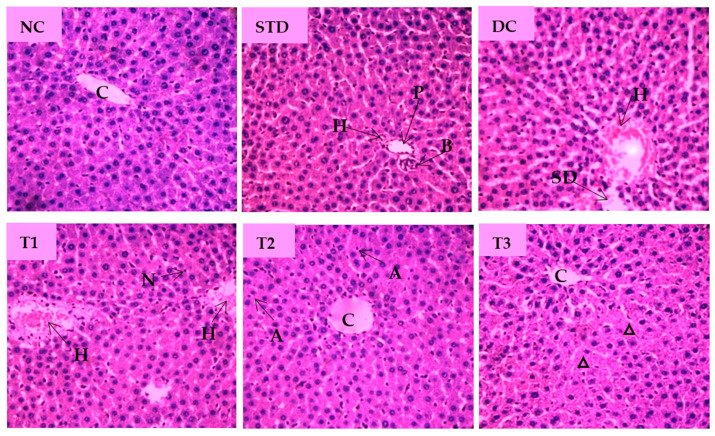
 ”—Necrotic cell, “
 ”—Hydropic degeneration (HD); IC—Islets of β cells, Aci—Acinar cell.


Similar articles
-
Lasia spinosa Stem Aqueous Extract Potentiates Antidiabetic Effects Exhibiting Antioxidant Genes Upregulation and DNA-Damage Protection.Chem Biodivers. 2025 Apr;22(4):e202401074. doi: 10.1002/cbdv.202401074. Epub 2025 Jan 7. Chem Biodivers. 2025. PMID: 39625856
-
The Antioxidative Role of Natural Compounds from a Green Coconut Mesocarp Undeniably Contributes to Control Diabetic Complications as Evidenced by the Associated Genes and Biochemical Indexes.Oxid Med Cell Longev. 2021 Jul 27;2021:9711176. doi: 10.1155/2021/9711176. eCollection 2021. Oxid Med Cell Longev. 2021. PMID: 34367469 Free PMC article.
-
Antidiabetic effects of Psidium x durbanensis Baijnath & Ramcharun ined. (Myrtaceae) leaf extract on streptozotocin-induced diabetes in rats.J Ethnopharmacol. 2022 Oct 28;297:115542. doi: 10.1016/j.jep.2022.115542. Epub 2022 Jul 14. J Ethnopharmacol. 2022. PMID: 35842177
-
Antidiabetic and antioxidative properties of the hydro-methanolic extract (60:40) of rhizomes of Curcuma amada roxb. (Zingiberaceae) in streptozotocin-induced diabetic male albino rat: a dose-dependent study through biochemical and genomic approaches.J Complement Integr Med. 2019 Jul 18;16(4):/j/jcim.2019.16.issue-4/jcim-2017-0182/jcim-2017-0182.xml. doi: 10.1515/jcim-2017-0182. J Complement Integr Med. 2019. PMID: 31318692
-
Protective and antidiabetic effects of extract from Nigella sativa on blood glucose concentrations against streptozotocin (STZ)-induced diabetic in rats: an experimental study with histopathological evaluation.Diagn Pathol. 2013 Aug 15;8:137. doi: 10.1186/1746-1596-8-137. Diagn Pathol. 2013. Retraction in: Diagn Pathol. 2016 Nov 2;11(1):125. doi: 10.1186/s13000-016-0571-6. PMID: 23947821 Free PMC article. Retracted.
Cited by
-
Green-synthesized nanoparticles of the polyherbal extract attenuate the necrosis of pancreatic β-cell in a streptozotocin-induced diabetic model.Heliyon. 2023 May 15;9(5):e16137. doi: 10.1016/j.heliyon.2023.e16137. eCollection 2023 May. Heliyon. 2023. PMID: 37251822 Free PMC article.
-
Chemical application improves stress resilience in plants.Plant Mol Biol. 2025 Mar 19;115(2):47. doi: 10.1007/s11103-025-01566-w. Plant Mol Biol. 2025. PMID: 40105987 Free PMC article. Review.
References
-
- Aziz S.M.A., Ahmed O.M., El-Twab S.M.A., Al-Muzafar H.M., Amin K.A., Abdel-Gabbar M. Antihyperglycemic effects and mode of actions of Musa paradisiaca leaf and fruit peel hydroethanolic extracts in nicotinamide/streptozotocin-induced diabetic rats. Evid. Based Complement. Altern. Med. 2020;2020:1–15. doi: 10.1155/2020/9276343. - DOI - PMC - PubMed
-
- Ponnachan P.T., Paulose C.S., Panikkar K.R. Effect of leaf extract of Aegle marmelose in diabetic rats. J. Pharmacol. Exp. Ther. 1993;31:345–347. - PubMed
LinkOut - more resources
Full Text Sources
Miscellaneous
