

Inhibition of EZH2 Ameliorates Sepsis Acute Lung Injury (SALI) and Non-Small-Cell Lung Cancer (NSCLC) Proliferation through the PD-L1 Pathway
- PMID: 36552722
- PMCID: PMC9777373
- DOI: 10.3390/cells11243958
Inhibition of EZH2 Ameliorates Sepsis Acute Lung Injury (SALI) and Non-Small-Cell Lung Cancer (NSCLC) Proliferation through the PD-L1 Pathway
Abstract
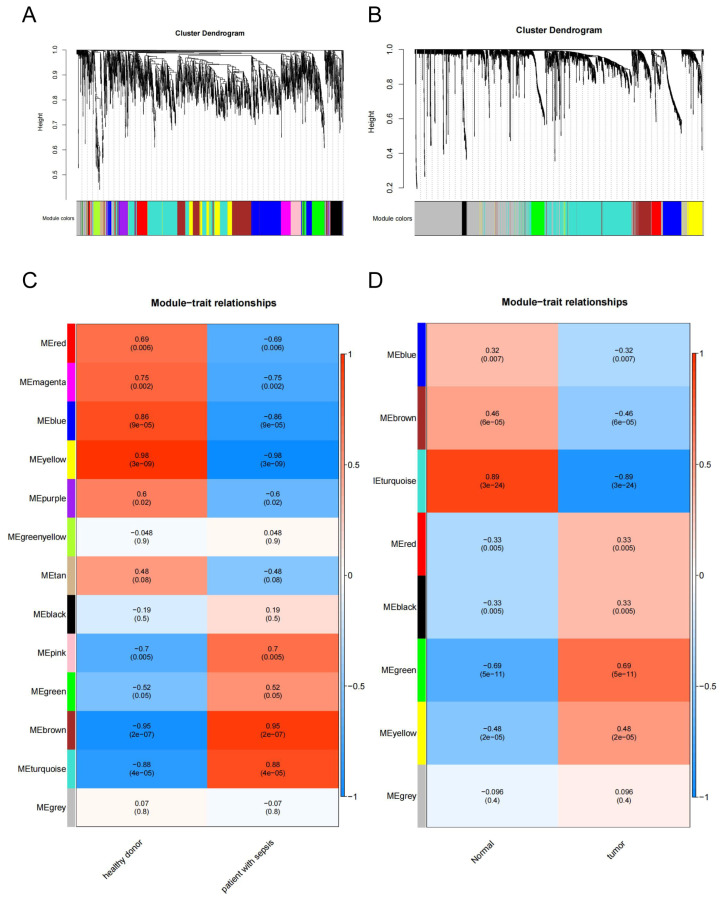
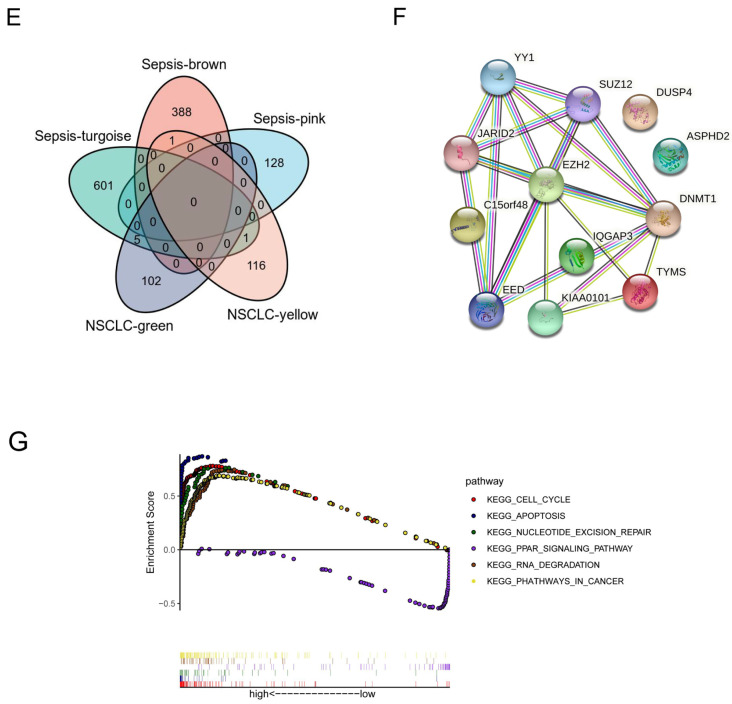
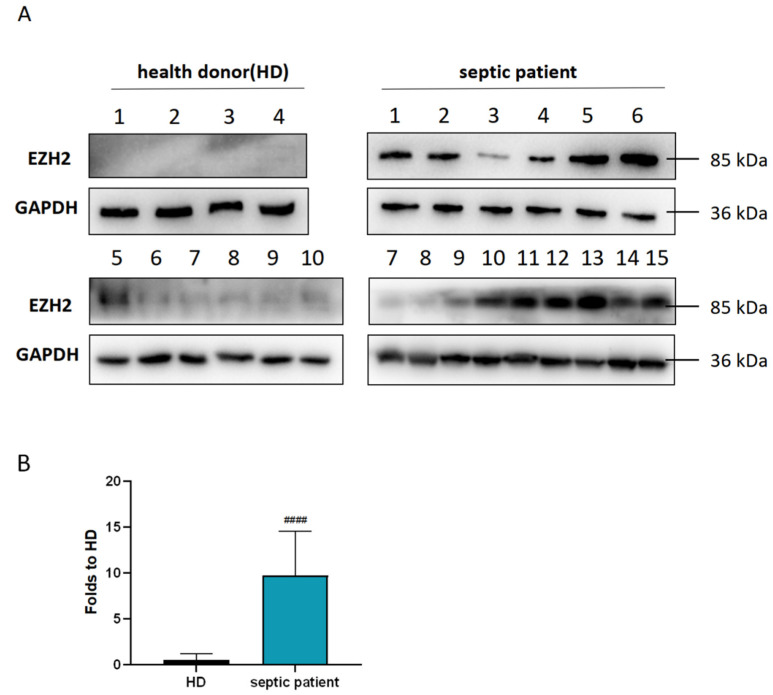
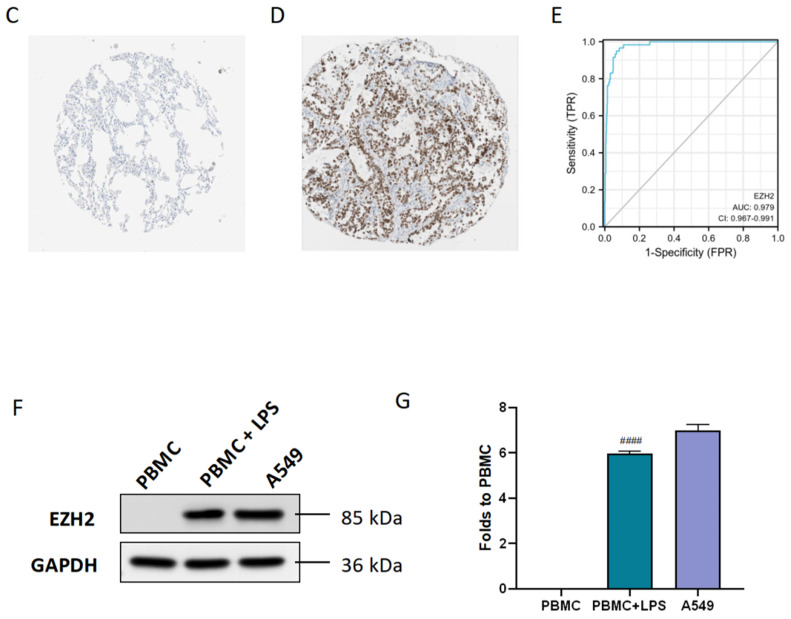
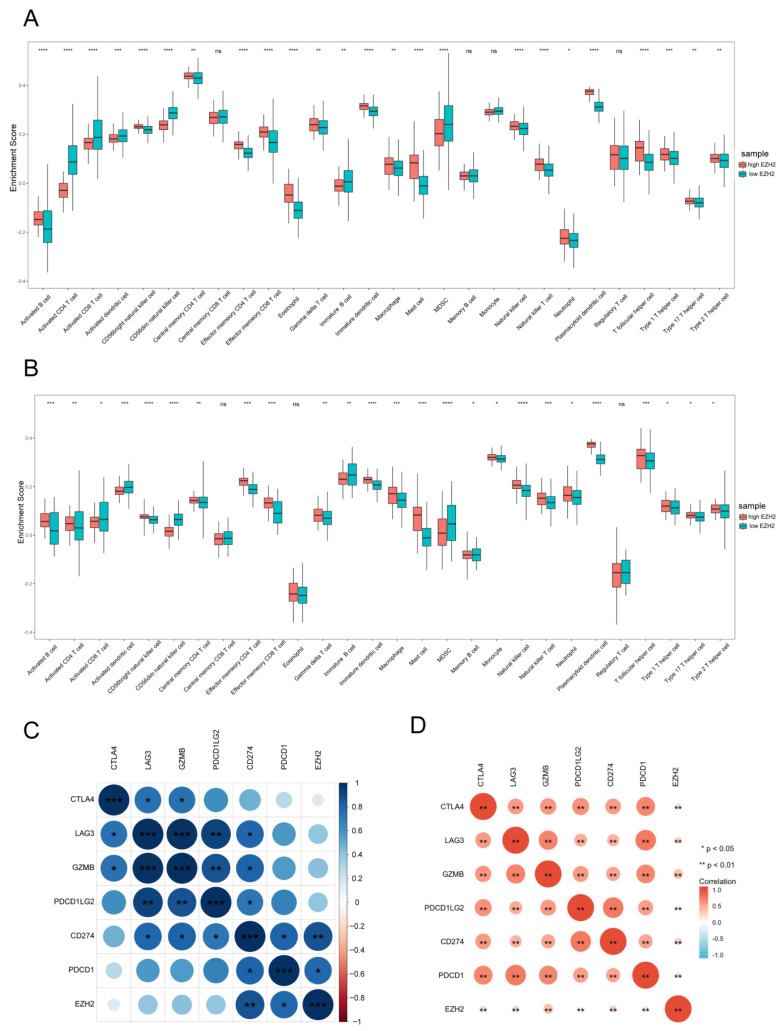
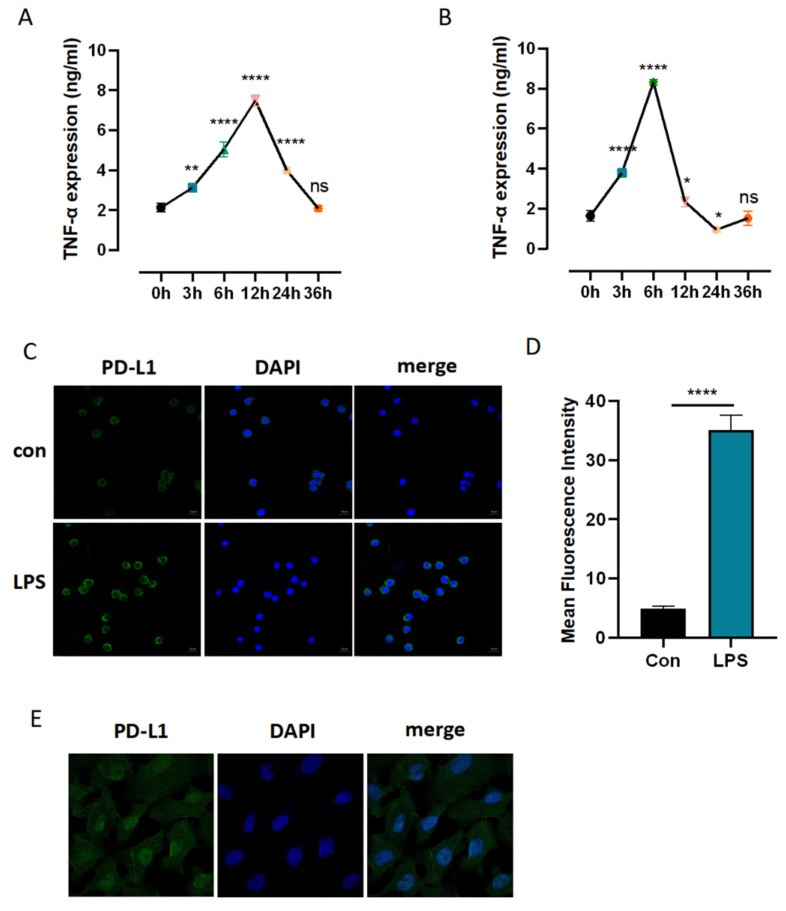
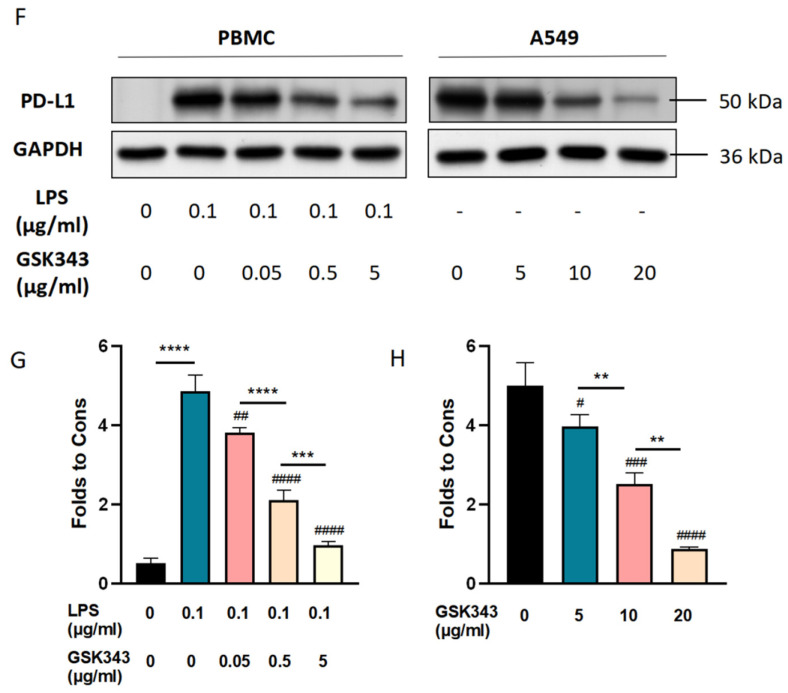
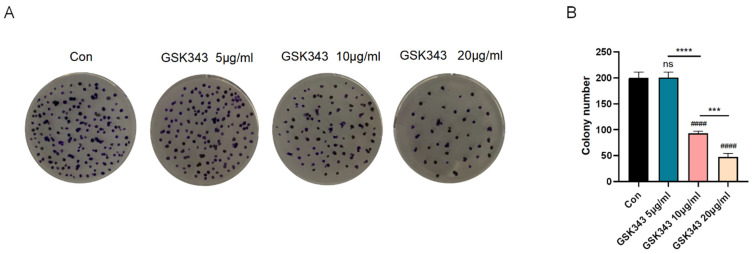
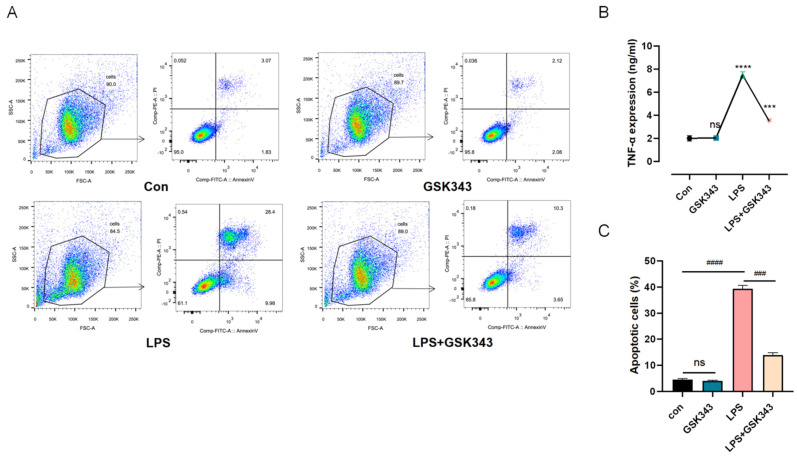
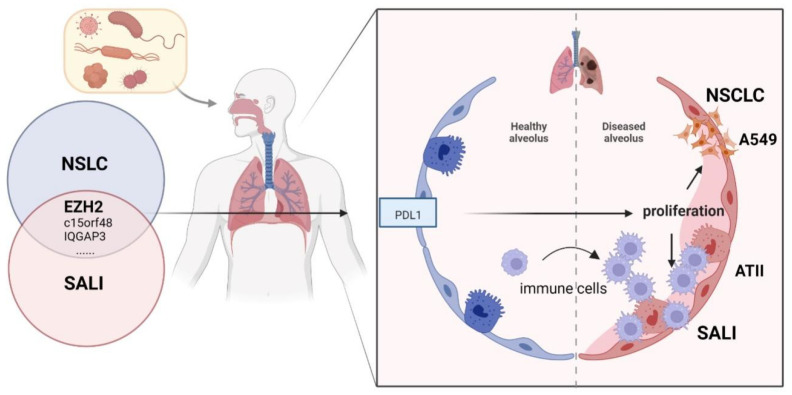
(1) Background: Both sepsis acute lung injury (SALI) and non-small-cell lung cancer (NSCLC) are life-threatening diseases caused by immune response disorders and inflammation, but the underlining linking mechanisms are still not clear. This study aimed to detect the shared gene signature and potential molecular process between SALI and NSCLC. (2) Methods: RNA sequences and patient information on sepsis and NSCLC were acquired from the Gene Expression Omnibus (GEO) database. Weighted gene co-expression network analysis (WGCNA) was used to build a co-expression network associated with sepsis and NSCLC. Protein-protein interaction (PPI) analysis of shared genes was intuitively performed by the Search Tool for the Retrieval of Interacting Genes/Proteins (STRING) database. The involvement of EZH2 in the tumor immune microenvironment (TIME) and sepsis immune microenvironment (IME) was assessed by R software. Western blot, flow cytometry, and other in vitro assays were performed to further confirm the function and mechanism of EZH2 in NSCLC and SALI. (3) Results: WGCNA recognized three major modules for sepsis and two major modules for NSCLC, and there were seven shared genes identified for the two diseases. Additionally, the hub gene EZH2 was screened out. It was shown that EZH2 was closely related to the IME in the two diseases. In the validation assay, our data showed that EZH2 was expressed at a higher level in peripheral blood mononuclear cells (PBMCs) of septic patients than those of healthy donors (HDs), and EZH2 was also expressed at a higher level in lipopolysaccharide (LPS)-induced PBMCs and non-small cell lung cancer (A549) cells. EZH2 inhibitor (GSK343) downregulated the proliferation ability of A549 cells in a concentration-dependent manner, parallel with the decreased expression level of PD-L1. Similarly, GSK343 inhibited PD-L1 protein expression and downregulated the level of proinflammatory factors in LPS-induced PBMCs. In the co-culture system of PBMCs and human type II alveolar epithelial cells (ATIIs), the addition of GSK343 to PBMCs significantly downregulated the apoptosis of LPS-induced ATIIs. (4) Conclusions: This study illustrated that EZH2 inhibition could ameliorate A549 cell proliferation and LPS-induced ATII apoptosis in parallel with downregulation of PD-L1 protein expression, which provided new insights into molecular signaling networks involved in the pathogenetics of SALI and NSCLC.
Keywords: EZH2; NSCLC; SALI; WGCNA; apoptosis.
Conflict of interest statement
The authors declare no conflict of interest. The funders had no role in the design of the study.
Figures
Similar articles
-
EZH2 inhibitors reverse resistance to gefitinib in primary EGFR wild-type lung cancer cells.BMC Cancer. 2020 Dec 4;20(1):1189. doi: 10.1186/s12885-020-07667-7. BMC Cancer. 2020. PMID: 33276757 Free PMC article.
-
ILT4 inhibition prevents TAM- and dysfunctional T cell-mediated immunosuppression and enhances the efficacy of anti-PD-L1 therapy in NSCLC with EGFR activation.Theranostics. 2021 Jan 19;11(7):3392-3416. doi: 10.7150/thno.52435. eCollection 2021. Theranostics. 2021. PMID: 33537094 Free PMC article.
-
Molecular mechanism of lncRNA SNHG12 in immune escape of non-small cell lung cancer through the HuR/PD-L1/USP8 axis.Cell Mol Biol Lett. 2022 Jun 3;27(1):43. doi: 10.1186/s11658-022-00343-7. Cell Mol Biol Lett. 2022. PMID: 35658874 Free PMC article.
-
Role of the dynamic tumor microenvironment in controversies regarding immune checkpoint inhibitors for the treatment of non-small cell lung cancer (NSCLC) with EGFR mutations.Mol Cancer. 2019 Sep 16;18(1):139. doi: 10.1186/s12943-019-1062-7. Mol Cancer. 2019. PMID: 31526368 Free PMC article. Review.
-
Programmed death-ligand 1 expression in non-small cell lung carcinoma - mechanism of regulation, association with other markers, and therapeutic implication.Klin Onkol. 2022 Fall;35(5):372-376. doi: 10.48095/ccko2022372. Klin Onkol. 2022. PMID: 36443097 Review. English.
Cited by
-
Lymphopenia in sepsis: a narrative review.Crit Care. 2024 Sep 20;28(1):315. doi: 10.1186/s13054-024-05099-4. Crit Care. 2024. PMID: 39304908 Free PMC article. Review.
-
Study on the Effect of EZH2 Inhibitor Combined with TIGIT Monoclonal Antibody against Multiple Myeloma Cells.Int J Mol Sci. 2023 May 11;24(10):8603. doi: 10.3390/ijms24108603. Int J Mol Sci. 2023. PMID: 37239949 Free PMC article.
-
The implication of targeting PD-1:PD-L1 pathway in treating sepsis through immunostimulatory and anti-inflammatory pathways.Front Immunol. 2023 Dec 13;14:1323797. doi: 10.3389/fimmu.2023.1323797. eCollection 2023. Front Immunol. 2023. PMID: 38193090 Free PMC article. Review.
-
Immunoexpressions of PD-L1 and EZH2 in Endometrial Carcinoma: Associations with Clinicopathological Parameters.Diagnostics (Basel). 2025 Apr 19;15(8):1042. doi: 10.3390/diagnostics15081042. Diagnostics (Basel). 2025. PMID: 40310411 Free PMC article.
-
Role and potential therapeutic value of histone methyltransferases in drug resistance mechanisms in lung cancer.Front Oncol. 2024 Mar 8;14:1376916. doi: 10.3389/fonc.2024.1376916. eCollection 2024. Front Oncol. 2024. PMID: 38525426 Free PMC article. Review.
References
-
- Zhang H., Zhou Y., Qu M., Yu Y., Chen Z., Zhu S., Guo K., Chen W., Miao C. Tissue Factor-Enriched Neutrophil Extracellular Traps Promote Immunothrombosis and Disease Progression in Sepsis-Induced Lung Injury. Front. Cell Infect. Microbiol. 2021;11:677902. doi: 10.3389/fcimb.2021.677902. - DOI - PMC - PubMed
-
- Wang Z., Wei J., Zhu H., Cao Y., Yu X., Chen Y., Lv C., Zhao X. Consensus of Chinese experts on early prevention and blocking of sepsis. Zhonghua Wei Zhong Bing Ji Jiu Yi Xue. 2020;32:518–530. - PubMed
Publication types
MeSH terms
Substances
LinkOut - more resources
Full Text Sources
Medical
Research Materials
