

SARS-CoV-2 Pattern Provides a New Scoring System and Predicts the Prognosis and Immune Therapeutic Response in Glioma
- PMID: 36552760
- PMCID: PMC9777143
- DOI: 10.3390/cells11243997
SARS-CoV-2 Pattern Provides a New Scoring System and Predicts the Prognosis and Immune Therapeutic Response in Glioma
Abstract
Objective: Glioma is the most common primary malignancy of the adult central nervous system (CNS), with a poor prognosis and no effective prognostic signature. Since late 2019, the world has been affected by the rapid spread of SARS-CoV-2 infection. Research on SARS-CoV-2 is flourishing; however, its potential mechanistic association with glioma has rarely been reported. The aim of this study was to investigate the potential correlation of SARS-CoV-2-related genes with the occurrence, progression, prognosis, and immunotherapy of gliomas.
Methods: SARS-CoV-2-related genes were obtained from the human protein atlas (HPA), while transcriptional data and clinicopathological data were obtained from The Cancer Genome Atlas (TCGA) and Chinese Glioma Genome Atlas (CGGA) databases. Glioma samples were collected from surgeries with the knowledge of patients. Differentially expressed genes were then identified and screened, and seven SARS-CoV-2 related genes were generated by LASSO regression analysis and uni/multi-variate COX analysis. A prognostic SARS-CoV-2-related gene signature (SCRGS) was then constructed based on these seven genes and validated in the TCGA validation cohort and CGGA cohort. Next, a nomogram was established by combining critical clinicopathological data. The correlation between SCRGS and glioma related biological processes was clarified by Gene set enrichment analysis (GSEA). In addition, immune infiltration and immune score, as well as immune checkpoint expression and immune escape, were further analyzed to assess the role of SCRGS in glioma-associated immune landscape and the responsiveness of immunotherapy. Finally, the reliability of SCRGS was verified by quantitative real-time polymerase chain reaction (qRT-PCR) on glioma samples.
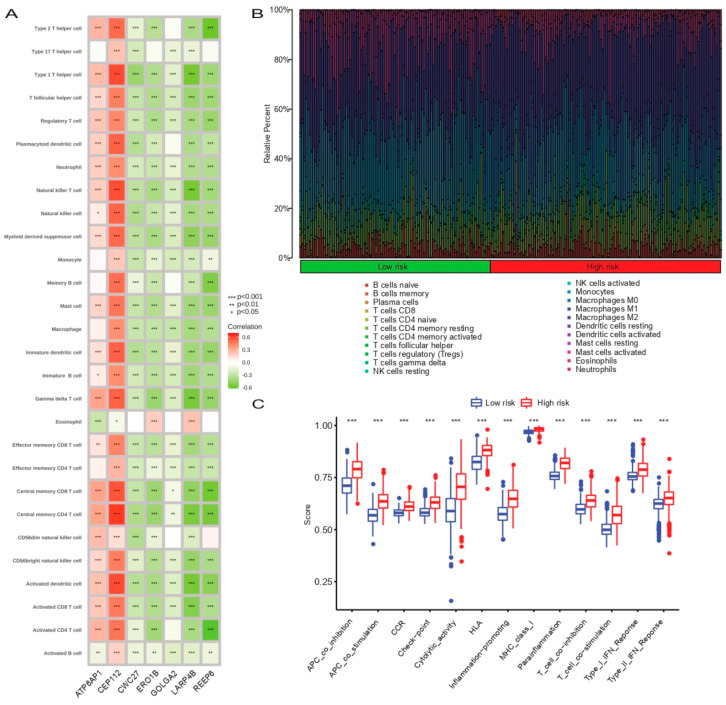
Results: The prognostic SCRGS contained seven genes, REEP6, CEP112, LARP4B, CWC27, GOLGA2, ATP6AP1, and ERO1B. Patients were divided into high- and low-risk groups according to the median SARS-CoV-2 Index. Overall survival was significantly worse in the high-risk group than in the low-risk group. COX analysis and receiver operating characteristic (ROC) curves demonstrated excellent predictive power for SCRGS for glioma prognosis. In addition, GSEA, immune infiltration, and immune scores indicated that SCRGS could potentially predict the tumor microenvironment, immune infiltration, and immune response in glioma patients.
Conclusions: The SCRGS established here can effectively predict the prognosis of glioma patients and provide a potential direction for immunotherapy.
Keywords: COVID-19; glioma; immunotherapy; molecular mechanism; prognosis.
Conflict of interest statement
The authors declare no conflict of interest.
Figures


Similar articles
-
A SARS-CoV-2 related signature that explores the tumor microenvironment and predicts immunotherapy response in esophageal squamous cell cancer.Aging (Albany NY). 2023 Oct 6;15(19):10501-10523. doi: 10.18632/aging.205090. Epub 2023 Oct 6. Aging (Albany NY). 2023. PMID: 37812215 Free PMC article.
-
Characterizing the key genes of COVID-19 that regulate tumor immune microenvironment and prognosis in hepatocellular carcinoma.Funct Integr Genomics. 2023 Aug 4;23(3):262. doi: 10.1007/s10142-023-01184-z. Funct Integr Genomics. 2023. PMID: 37540264
-
Pyroptosis-Related Gene Signature Predicts Prognosis and Indicates Immune Microenvironment Infiltration in Glioma.Front Cell Dev Biol. 2022 Apr 25;10:862493. doi: 10.3389/fcell.2022.862493. eCollection 2022. Front Cell Dev Biol. 2022. PMID: 35547808 Free PMC article.
-
Lipid metabolism-related gene signature predicts prognosis and depicts tumor microenvironment immune landscape in gliomas.Front Immunol. 2023 Feb 13;14:1021678. doi: 10.3389/fimmu.2023.1021678. eCollection 2023. Front Immunol. 2023. PMID: 36860853 Free PMC article.
-
Identification of Iron Metabolism-Related Genes as Prognostic Indicators for Lower-Grade Glioma.Front Oncol. 2021 Sep 9;11:729103. doi: 10.3389/fonc.2021.729103. eCollection 2021. Front Oncol. 2021. PMID: 34568059 Free PMC article.
Cited by
-
Identification of tumor heterogeneity associated with KRAS/TP53 co-mutation status in lung adenocarcinoma based on single-cell RNA sequencing.Am J Cancer Res. 2024 Feb 15;14(2):655-678. doi: 10.62347/NXAJ9418. eCollection 2024. Am J Cancer Res. 2024. PMID: 38455404 Free PMC article.
-
The signature of SARS-CoV-2-related genes predicts the immune therapeutic response and prognosis in breast cancer.BMC Med Genomics. 2024 Oct 31;17(1):260. doi: 10.1186/s12920-024-02032-0. BMC Med Genomics. 2024. PMID: 39482662 Free PMC article.
-
The Immunomodulatory Effects of Vitamin D on COVID-19 Induced Glioblastoma Recurrence via the PI3K-AKT Signaling Pathway.Int J Mol Sci. 2024 Dec 2;25(23):12952. doi: 10.3390/ijms252312952. Int J Mol Sci. 2024. PMID: 39684661 Free PMC article.
-
Impact of the COVID-19 pandemic on the mortality among patients with colorectal cancer in Hiroshima, Japan: A large cancer registry study.Cancer Med. 2023 Nov;12(21):20554-20563. doi: 10.1002/cam4.6630. Epub 2023 Oct 25. Cancer Med. 2023. PMID: 37877230 Free PMC article.
-
Computational identification and experimental verification of a novel signature based on SARS-CoV-2-related genes for predicting prognosis, immune microenvironment and therapeutic strategies in lung adenocarcinoma patients.Front Immunol. 2024 Mar 26;15:1366928. doi: 10.3389/fimmu.2024.1366928. eCollection 2024. Front Immunol. 2024. PMID: 38601163 Free PMC article.
References
-
- Zhao Z., Zhang K.-N., Wang Q., Li G., Zeng F., Zhang Y., Wu F., Chai R., Wang Z., Zhang C., et al. Chinese Glioma Genome Atlas (CGGA): A Comprehensive Resource with Functional Genomic Data from Chinese Glioma Patients. Genom. Proteom. Bioinform. 2021;19:1–12. doi: 10.1016/j.gpb.2020.10.005. - DOI - PMC - PubMed
-
- Louis D.N., Perry A., Reifenberger G., von Deimling A., Figarella-Branger D., Cavenee W.K., Ohgaki H., Wiestler O.D., Kleihues P., Ellison D.W. The 2016 World Health Organization Classification of Tumors of the Central Nervous System: A summary. Acta Neuropathol. 2016;131:803–820. doi: 10.1007/s00401-016-1545-1. - DOI - PubMed
Publication types
MeSH terms
Substances
LinkOut - more resources
Full Text Sources
Medical
Miscellaneous
