

Multiomics Analysis of a DNAH5-Mutated PCD Organoid Model Revealed the Key Role of the TGF-β/BMP and Notch Pathways in Epithelial Differentiation and the Immune Response in DNAH5-Mutated Patients
- PMID: 36552777
- PMCID: PMC9776854
- DOI: 10.3390/cells11244013
Multiomics Analysis of a DNAH5-Mutated PCD Organoid Model Revealed the Key Role of the TGF-β/BMP and Notch Pathways in Epithelial Differentiation and the Immune Response in DNAH5-Mutated Patients
Abstract
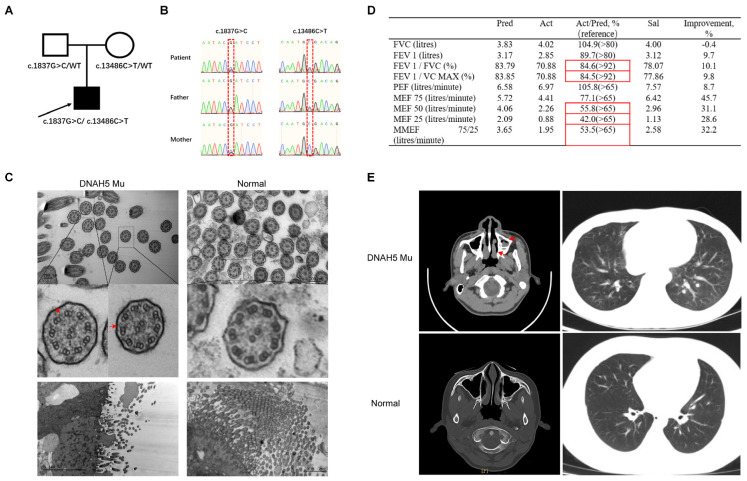
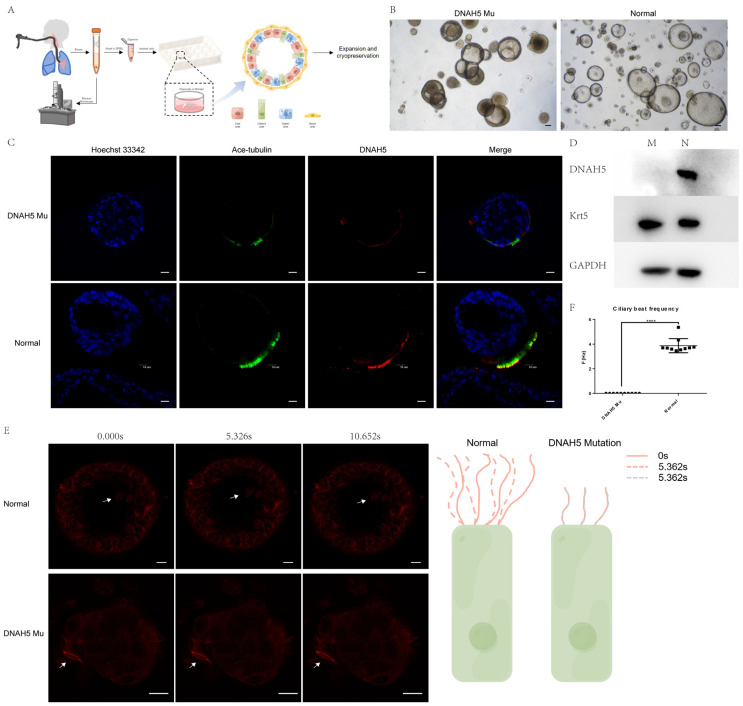
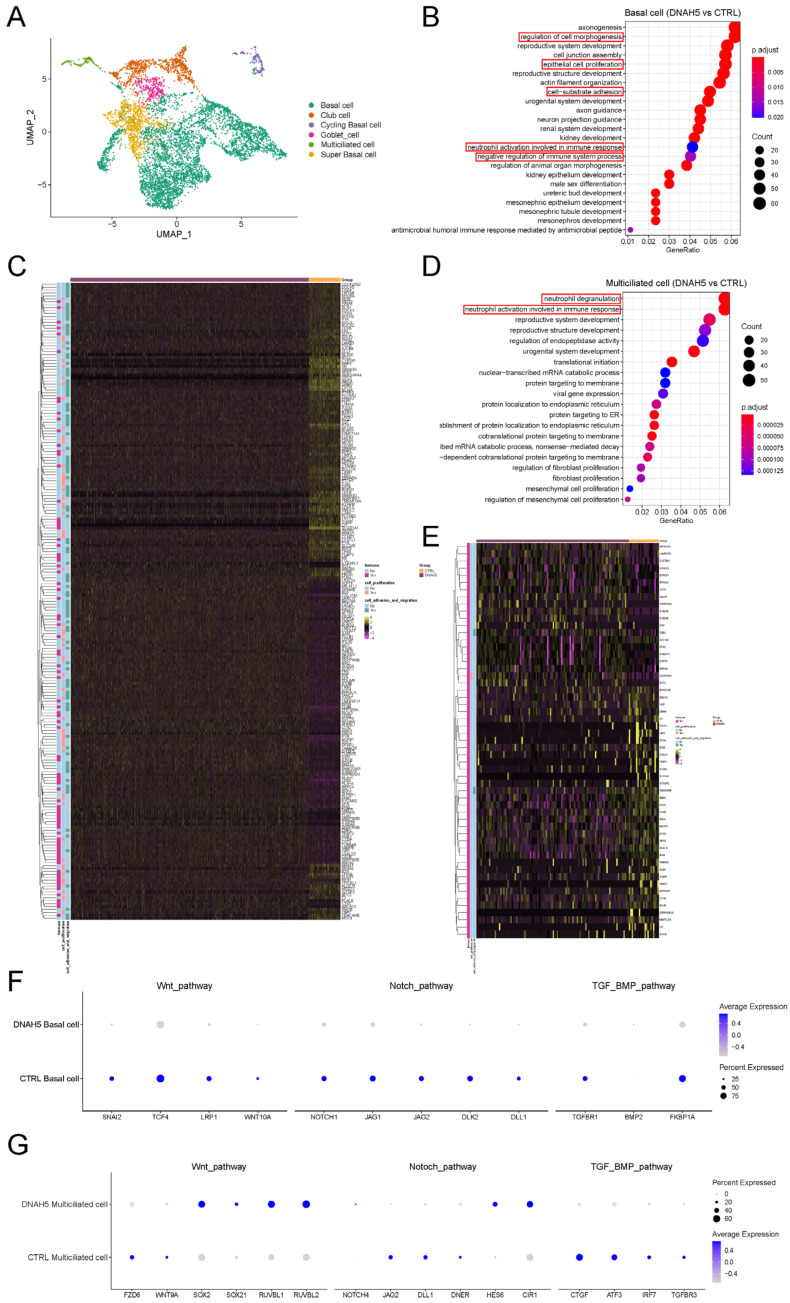
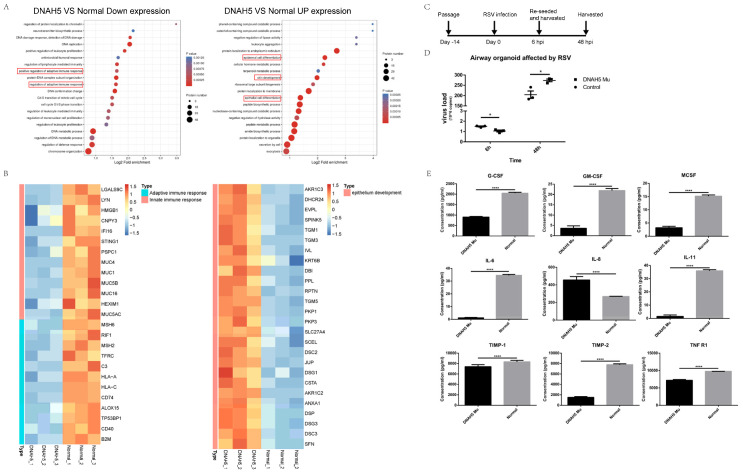
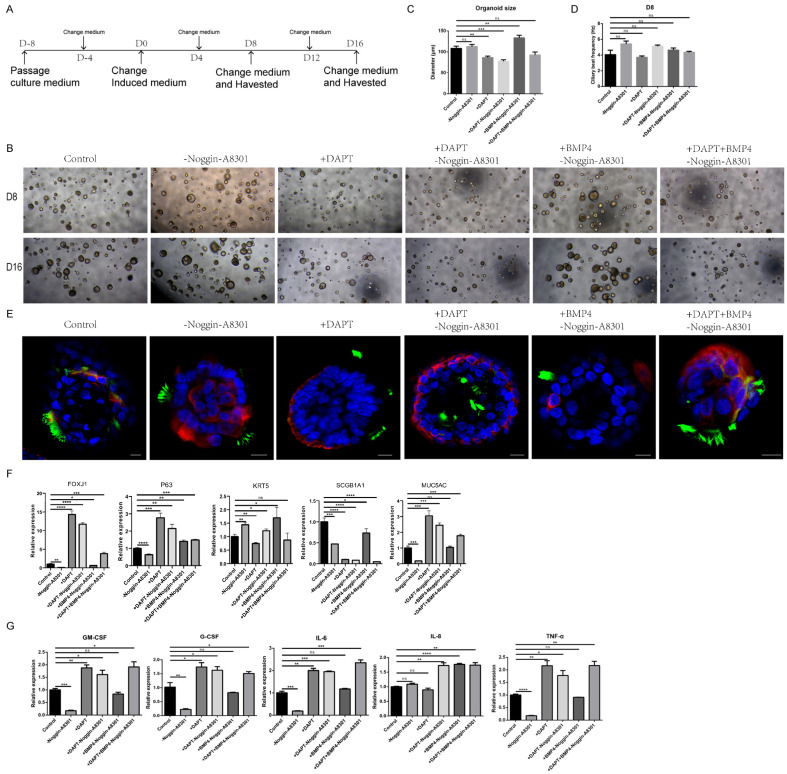
Dynein axonemal heavy chain 5 (DNAH5) is the most mutated gene in primary ciliary dyskinesia (PCD), leading to abnormal cilia ultrastructure and function. Few studies have revealed the genetic characteristics and pathogenetic mechanisms of PCD caused by DNAH5 mutation. Here, we established a child PCD airway organoid directly from the bronchoscopic biopsy of a patient with the DNAH5 mutation. The motile cilia in the organoid were observed and could be stably maintained for an extended time. We further found abnormal ciliary function and a decreased immune response caused by the DNAH5 mutation through single-cell RNA sequencing (scRNA-Seq) and proteomic analyses. Additionally, the directed induction of the ciliated cells, regulated by TGF-β/BMP and the Notch pathway, also increased the expression of inflammatory cytokines. Taken together, these results demonstrated that the combination of multiomics analysis and organoid modelling could reveal the close connection between the immune response and the DNAH5 gene.
Keywords: DNAH5; airway organoid; immune response; multiomics analysis; primary ciliary dyskinesia.
Conflict of interest statement
The authors declare no conflict of interest.
Figures
Similar articles
-
Mislocalization of DNAH5 and DNAH9 in respiratory cells from patients with primary ciliary dyskinesia.Am J Respir Crit Care Med. 2005 Jun 15;171(12):1343-9. doi: 10.1164/rccm.200411-1583OC. Epub 2005 Mar 4. Am J Respir Crit Care Med. 2005. PMID: 15750039 Free PMC article.
-
DNAH5 mutations are a common cause of primary ciliary dyskinesia with outer dynein arm defects.Am J Respir Crit Care Med. 2006 Jul 15;174(2):120-6. doi: 10.1164/rccm.200601-084OC. Epub 2006 Apr 20. Am J Respir Crit Care Med. 2006. PMID: 16627867 Free PMC article.
-
Effectiveness of sequencing selected exons of DNAH5 and DNAI1 in diagnosis of primary ciliary dyskinesia.Pediatr Pulmonol. 2012 Sep;47(9):864-75. doi: 10.1002/ppul.22520. Epub 2012 Mar 13. Pediatr Pulmonol. 2012. PMID: 22416021
-
Novel compound heterozygous mutations of DNAH5 identified in a pediatric patient with Kartagener syndrome: case report and literature review.BMC Pulm Med. 2021 Aug 14;21(1):263. doi: 10.1186/s12890-021-01586-4. BMC Pulm Med. 2021. PMID: 34391405 Free PMC article. Review.
-
Genetic spectrum and genotype-phenotype correlations in DNAH5-mutated primary ciliary dyskinesia: a systematic review.Orphanet J Rare Dis. 2025 Mar 3;20(1):97. doi: 10.1186/s13023-025-03596-5. Orphanet J Rare Dis. 2025. PMID: 40033371 Free PMC article.
Cited by
-
Airway ciliary microenvironment responses in mice with primary ciliary dyskinesia and central pair apparatus defects.Sci Rep. 2024 Nov 18;14(1):28437. doi: 10.1038/s41598-024-79877-z. Sci Rep. 2024. PMID: 39558053 Free PMC article.
-
Primary cilia and their role in preeclampsia.Int J Med Sci. 2025 Jul 10;22(13):3260-3267. doi: 10.7150/ijms.114433. eCollection 2025. Int J Med Sci. 2025. PMID: 40765552 Free PMC article. Review.
-
Clinical Characteristics and Immune Responses in Children with Primary Ciliary Dyskinesia during Pneumonia Episodes: A Case-Control Study.Children (Basel). 2023 Oct 24;10(11):1727. doi: 10.3390/children10111727. Children (Basel). 2023. PMID: 38002818 Free PMC article.
-
Comparison of characteristics and immune responses between paired human nasal and bronchial epithelial organoids.Cell Biosci. 2025 Feb 7;15(1):18. doi: 10.1186/s13578-024-01342-1. Cell Biosci. 2025. PMID: 39920853 Free PMC article.
-
Lung organoids: a new frontier in neonatology and paediatric respiratory medicine.Eur Respir Rev. 2025 Aug 6;34(177):240255. doi: 10.1183/16000617.0255-2024. Print 2025 Jun. Eur Respir Rev. 2025. PMID: 40769535 Free PMC article. Review.
References
-
- Kuehni C.E., Frischer T., Strippoli M.P., Maurer E., Bush A., Nielsen K.G., Escribano A., Lucas J.S., Yiallouros P., Omran H., et al. Factors influencing age at diagnosis of primary ciliary dyskinesia in European children. Eur. Respir. J. 2010;36:1248–1258. doi: 10.1183/09031936.00001010. - DOI - PubMed
-
- Fliegauf M., Olbrich H., Horvath J., Wildhaber J.H., Zariwala M.A., Kennedy M., Knowles M.R., Omran H. Mislocalization of DNAH5 and DNAH9 in respiratory cells from patients with primary ciliary dyskinesia. Am. J. Respir. Crit. Care Med. 2005;171:1343–1349. doi: 10.1164/rccm.200411-1583OC. - DOI - PMC - PubMed
Publication types
MeSH terms
Substances
LinkOut - more resources
Full Text Sources
Molecular Biology Databases
