. 2022 Dec 14;11(24):4050.
doi: 10.3390/cells11244050.

Transplantation of Skeletal Muscle-Derived Sca-1+/PW1+/Pax7- Interstitial Cells (PICs) Improves Cardiac Function and Attenuates Remodeling in Mice Subjected to Myocardial Infarction

Affiliations

Transplantation of Skeletal Muscle-Derived Sca-1+/PW1+/Pax7- Interstitial Cells (PICs) Improves Cardiac Function and Attenuates Remodeling in Mice Subjected to Myocardial Infarction

Prashant J Ruchaya et al. Cells. .

Erratum in

Abstract

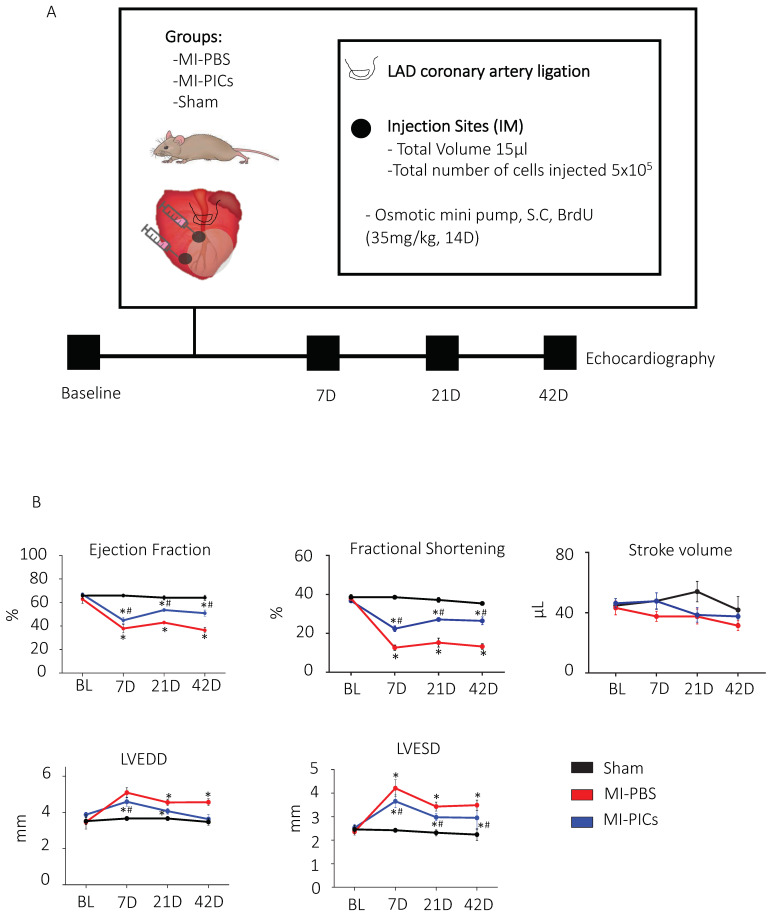
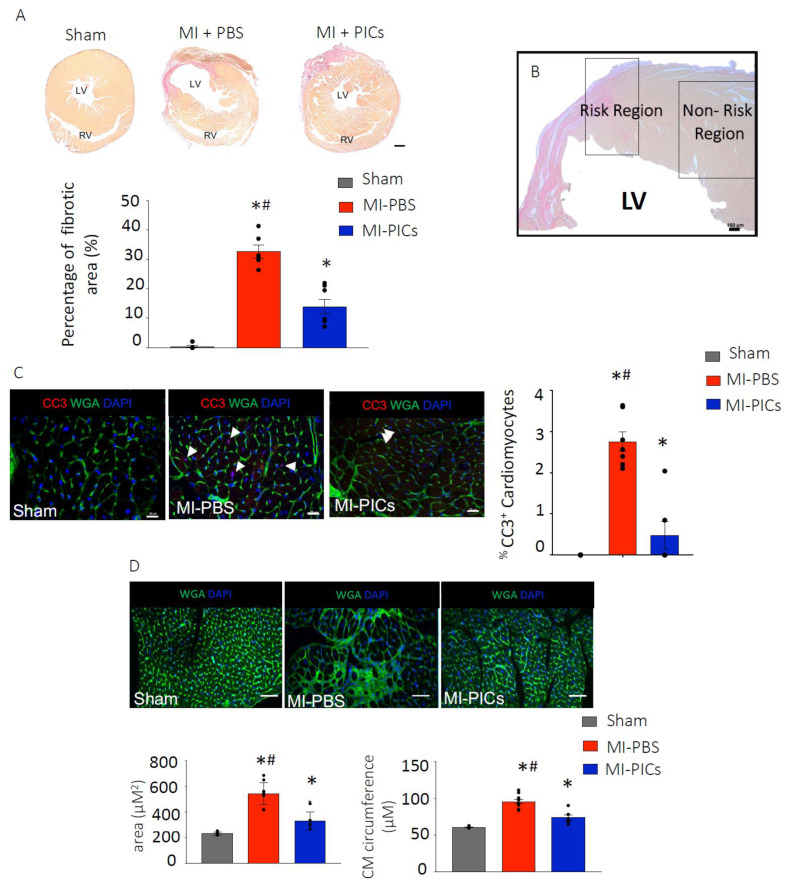
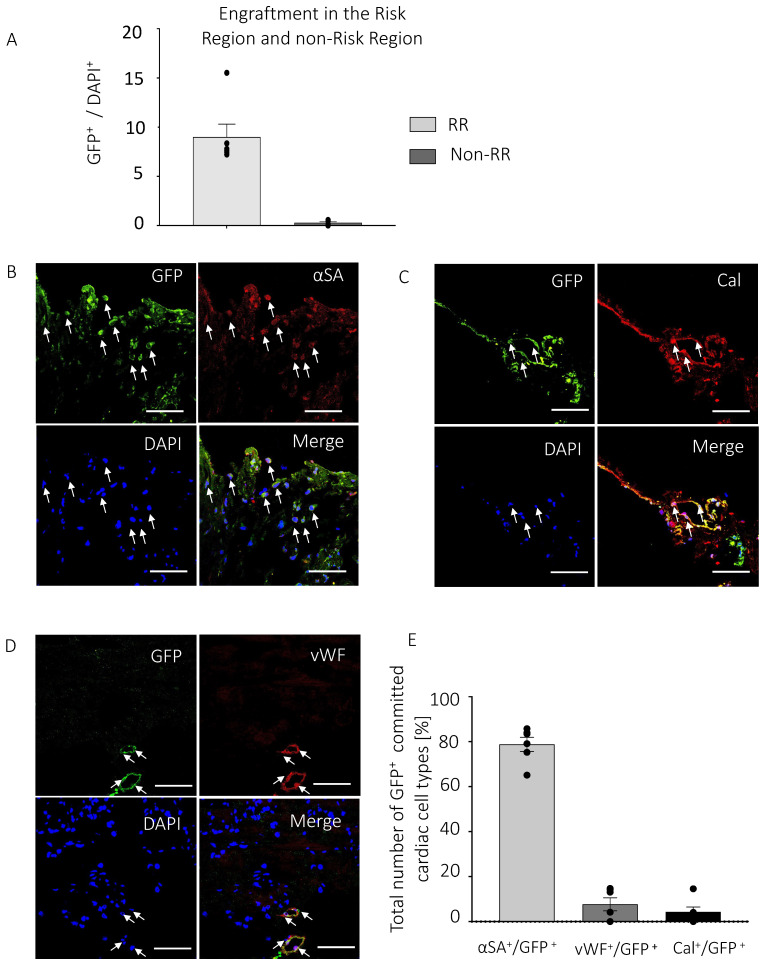
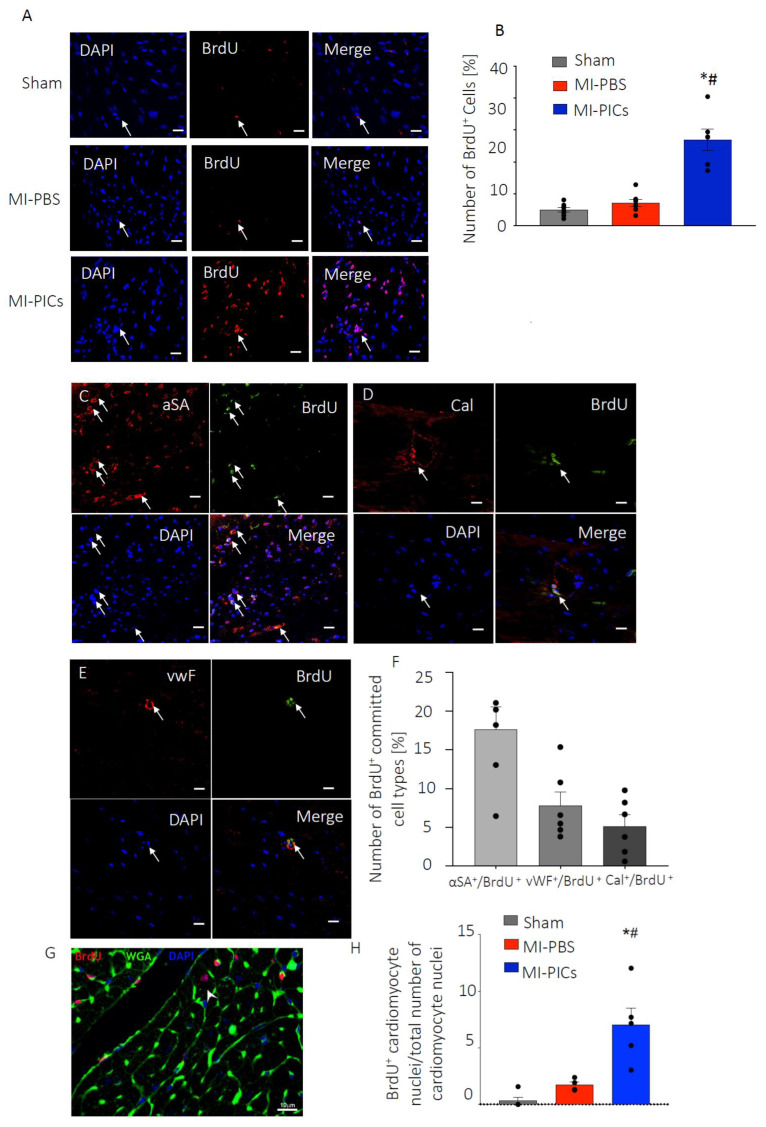
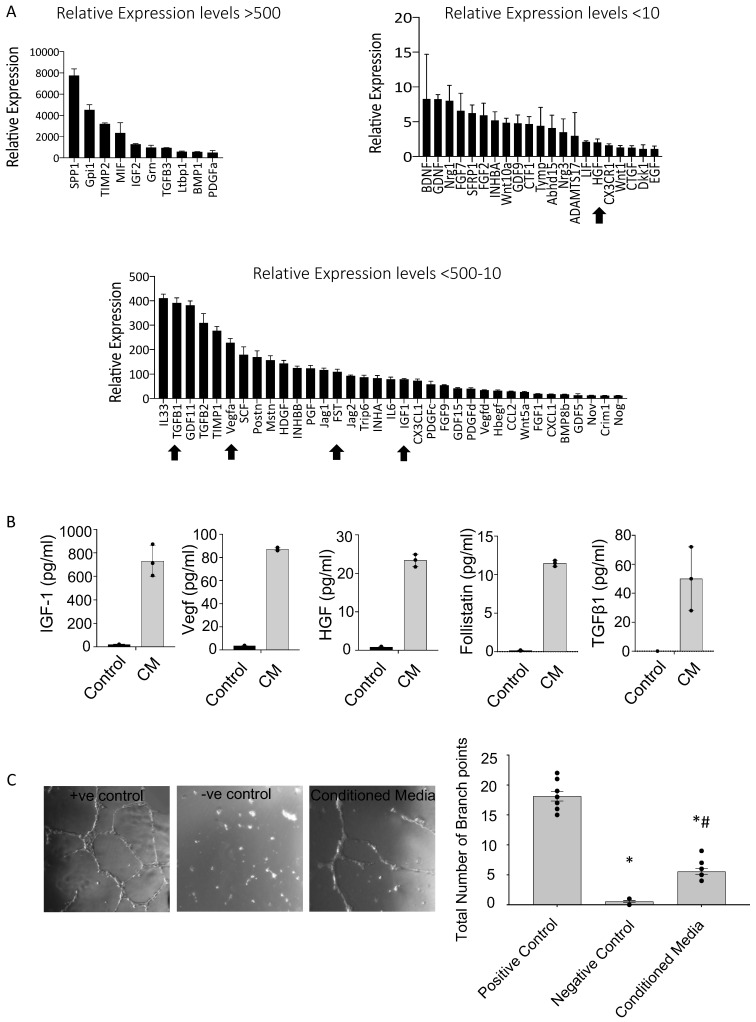
We have previously shown that skeletal muscle-derived Sca-1+/PW1+/Pax7- interstitial cells (PICs) are multi-potent and enhance endogenous repair and regeneration. Here, we investigated the regenerative potential of PICs following intramyocardial transplantation in mice subjected to an acute myocardial infarction (MI). MI was induced through the ligation of the left anterior descending coronary artery in 8-week old male C57BL/6 mice. 5 × 10⁵ eGFP-labelled PICs (MI + PICs; n = 7) or PBS (MI-PBS; n = 7) were injected intramyocardially into the border zone. Sham mice (n = 8) were not subjected to MI, or the transplantation of PICs or PBS. BrdU was administered via osmotic mini-pump for 14 days. Echocardiography was performed prior to surgery (baseline), and 1-, 3- and 6-weeks post-MI and PICs transplantation. Mice were sacrificed at 6 weeks post-MI + PICs transplantation, and heart sections were analysed for fibrosis, hypertrophy, engraftment, proliferation, and differentiation of PICs. A significant (p < 0.05) improvement in ejection fraction (EF) and fractional shortening was observed in the MI-PICs group, compared to MI + PBS group at 6-weeks post MI + PICs transplantation. Infarct size/fibrosis of the left ventricle significantly (p < 0.05) decreased in the MI-PICs group (14.0 ± 2.5%), compared to the MI-PBS group (32.8 ± 2.2%). Cardiomyocyte hypertrophy in the border zone significantly (p < 0.05) decreased in the MI-PICs group compared to the MI-PBS group (330.0 ± 28.5 µM2 vs. 543.5 ± 26.6 µm2), as did cardiomyocyte apoptosis (0.6 ± 0.9% MI-PICs vs. 2.8 ± 0.8% MI-PBS). The number of BrdU+ cardiomyocytes was significantly (p < 0.05) increased in the infarct/border zone of the MI-PICs group (7.0 ± 3.3%), compared to the MI-PBS group (1.7 ± 0.5%). The proliferation index (total BrdU+ cells) was significantly increased in the MI-PICs group compared to the MI-PBS group (27.0 ± 3.4% vs. 7.6 ± 1.0%). PICs expressed and secreted pro-survival and reparative growth factors, supporting a paracrine effect of PICs during recovery/remodeling. Skeletal muscle-derived PICs show significant reparative potential, attenuating cardiac remodelling following transplantation into the infarcted myocardium. PICs can be easily sourced from skeletal muscle and therefore show promise as a potential cell candidate for supporting the reparative and regenerative effects of cell therapies.

Keywords: cardiac repair and regeneration; myocardial infarction; skeletal muscle PW1+/Pax7− interstitial cells (PICs).


Conflict of interest statement

The authors declare that they have no competing interests.

Figures

Figure 1
Figure 1
PIC transplantation improves cardiac function after MI. (A) Schematic diagram of experimental design and echocardiography measurements were taken, before myocardial infarction (MI) (baseline); 7 days, 21 days and 42 days after MI. Post BL echocardiography, animals underwent MI surgery with PBS, MI with PICs or Sham surgery. (B) Changes in cardiac function post-MI. EF = ejection fraction, FS = fractional shortening, SV = stroke volume, LVEED = left ventricular end diastolic dimension, LVESD = left ventricular end systolic dimension. Sham = 8, MI-PICS = 7 and MI-PBS = 7. Data expressed as Mean ± SEM, * p < 0.05 vs. Sham, # p < 0.05 vs. MI-PBS.
Figure 2
Figure 2
PIC transplantation attenuates cardiac remodelling after MI. (A) Fibrosis detection using hematoxylin van geisen (HVG) staining in Sham = 8, MI-PICS = 7 and MI-PBS = 7, pink/red staining indicates fibrosis. Data expressed as Mean ± SEM of the fibrotic area over the total area of the left ventricle (LV), * p < 0.05 vs. Sham, # p < 0.05 vs. MI-PICs, scale bar = 500 µM. (B) Representative micrograph depicting the risk region (RR) and non-risk region (non-RR) in the LV. Scale bar 100 µM. (C) % CC3+ apoptotic cardiomyocytes in the RR of the LV, representative image of Sham, MI-PBS and MI-PICs. Green; wheat germ agglutinin (WGA); red; cleave caspase 3 (CC3); blue; DAPI. Arrowheads show CC3+ cardiomyocytes in MI-PBS. Arrowheads show non-cardiomyocyte CC3+ cells in MI-PICs. Sham = 8, MI-PICS = 7 and MI-PBS = 6. Scale bar = 25 µM. Data are Mean ± SEM. * p < 0.05 vs. Sham, # p < 0.05 vs. MI-PICs. (D) Representative confocal micrographs of the RR in Sham = 8, MI-PICs = 6 and MI-PBS = 7 groups, WGA (green) and DAPI (blue). Scale bar = 500 µM. Graphs showing the cross-sectional area and circumference of cardiomyocytes in the RR of the LV. Data expressed as Mean ± SEM, * p < 0.05 vs. Sham, # p < 0.05 vs. MI-PICs.
Figure 3
Figure 3
PICs engraft in the infarcted myocardium. (A) Percent engraftment of GFP+ PICs 6 weeks post-transplantation, represented as a percentage of the total number of DAPI cells in the risk region (RR) and non-risk region (non-RR). Data are Mean ± SEM in 20 FOV per mouse. (BD) Representative confocal micrographs of GFP+ PICs (green) expressing markers of cardiomyocyte ((B), Red; α-sarcomeric actin), smooth muscle ((C), Red; calponin) and endothelial ((D), Red, vWF) cells. DAPI stain nuclei blue. Scale bar = 50 µM. (E) Quantification of the GFP+ PICs expressing markers of the cardiac tr-lineage in MI-PICs group n = 6. Data are Mean ± SEM.
Figure 4
Figure 4
PICs transplantation increases proliferation and number of BrdU+ cardiomyocytes. (A) Representative confocal micrographs in the RR of the LV of BrdU (Red) positive cells. DAPI stain nuclei blue. Scale bar = 10 µM. Arrows indicate positive staining colocalisation. (B) Quantification of the number of proliferating BrdU-positive cells in the RR in Sham = 8, MI-PBS = 7 and MI-PICs = 6 groups. Data are Mean ± SEM of the total number of BrdU+ cells over the total number of cells (DAPI), * p < 0.05 vs. sham, # p < 0.05 vs. MI-PBS. (CE) Representative confocal micrographs in the RR of the LV of BrdU (Green) positive, α-sarcomeric actin-expressing ((C), Red), calponin-expressing ((D), Red) or vWF-expressing ((E), Red) cells. DAPI stain nuclei blue. Scale bar = 10 µM; arrows indicate positive staining colocalisation. (F) Quantification of the number of BrdU+ trilineage cardiac expressing cells. Data are Mean ± SEM. (G) Representative image of BrdU+ cardiomyocyte (WGA) in MI-PICs. DAPI stain nuclei blue. Arrows indicate cells that show colocalisation. Sham = 5, MI-PICS = 5 and MI-PBS = 5. Scale bar = 10 µM. (H) Percent number of BrdU+ cardiomyocytes in the RR. Data are Mean ± SEM. * p < 0.05 vs. sham, # p < 0.05 vs. MI-PBS.
Figure 5
Figure 5
PICs have a pro-reparative secretome. (A) Pro-survival and regenerative transcript expression of PICs. Data are relative expression to housekeeping genes GAPDH, ß-actin and B2M. Gene profile relative expression levels are depicted as, >500, 500–10 and <10. Data are Mean ± SD, n = 3. The arrows indicate the genes that were further investigated at the protein level. (B) Protein quantification using ELISA; concentration of mouse IGF-1, VEGF, HGF, Follistatin and TGFß1 (pg/mL) in mPIC conditioned media (CM) relative to unconditioned (control) media. Data are Mean ± SD, n = 3. (C) Matrigel tube formation assay. HUVECs were cultured for 15 h in 96-well plates coated with matrigel. Data are presented as the Mean ± SEM. Positive control, HUVEC media, Negative Control, DMEM and Conditioned media; is serum free DMEM conditioned with PICs media * p < 0.05 vs. Positive control, # p < 0.05 vs. Negative control.

References

    1. Richardson W.J., Clarke S.A., Quinn T.A., Holmes J.W. Physiological Implications of Myocardial Scar Structure. Compr. Physiol. 2015;5:1877–1909. doi: 10.1002/cphy.c140067. - DOI - PMC - PubMed
    1. Ali S.R., Hippenmeyer S., Saadat L.V., Luo L., Weissman I.L., Ardehali R. Existing cardiomyocytes generate cardiomyocytes at a low rate after birth in mice. Proc. Natl. Acad. Sci. USA. 2014;111:8850–8855. doi: 10.1073/pnas.1408233111. - DOI - PMC - PubMed
    1. Sultana N., Zhang L., Yan J., Chen J., Cai W., Razzaque S., Jeong D., Sheng W., Bu L., Xu M., et al. Resident c-kit+ cells in the heart are not cardiac stem cells. Nat. Commun. 2015;6:8701. doi: 10.1038/ncomms9701. - DOI - PMC - PubMed
    1. Song S.Y., Kim H., Yoo J., Kwon S.P., Park B.W., Kim J., Ban K., Char K., Park H., Kim B. Prevascularized, multiple-layered cell sheets of direct cardiac reprogrammed cells for cardiac repair. Biomater. Sci. 2020;8:4508–4520. doi: 10.1039/D0BM00701C. - DOI - PubMed
    1. Matsuura K., Honda A., Nagai T., Fukushima N., Iwanaga K., Tokunaga M., Shimizu T., Kasanuki H., Hagiwara N., Komuro I. Transplantation of cardiac progenitor cells ameliorates cardiac dysfunction after myocardial infarction in mice. J. Clin. Investig. 2009;119:2204–2217. doi: 10.1172/JCI37456. - DOI - PMC - PubMed

Publication types