. 2022 Dec 15;11(24):4070.
doi: 10.3390/cells11244070.

Histone Citrullination Mediates a Protective Role in Endothelium and Modulates Inflammation

Affiliations

Histone Citrullination Mediates a Protective Role in Endothelium and Modulates Inflammation

Rebeca Osca-Verdegal et al. Cells. .

Abstract

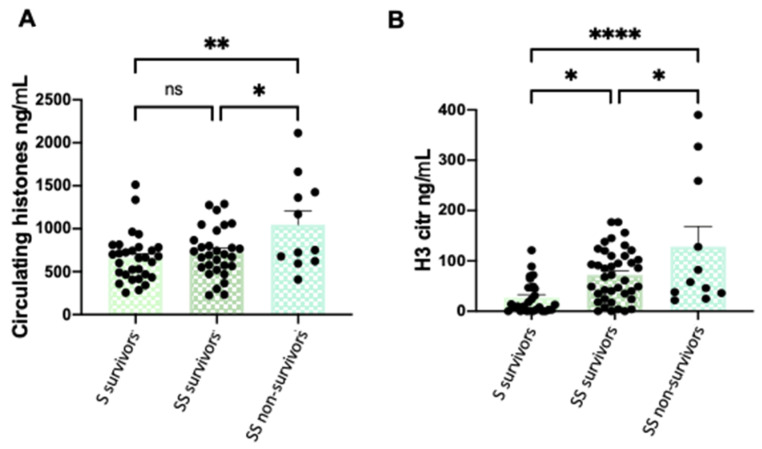
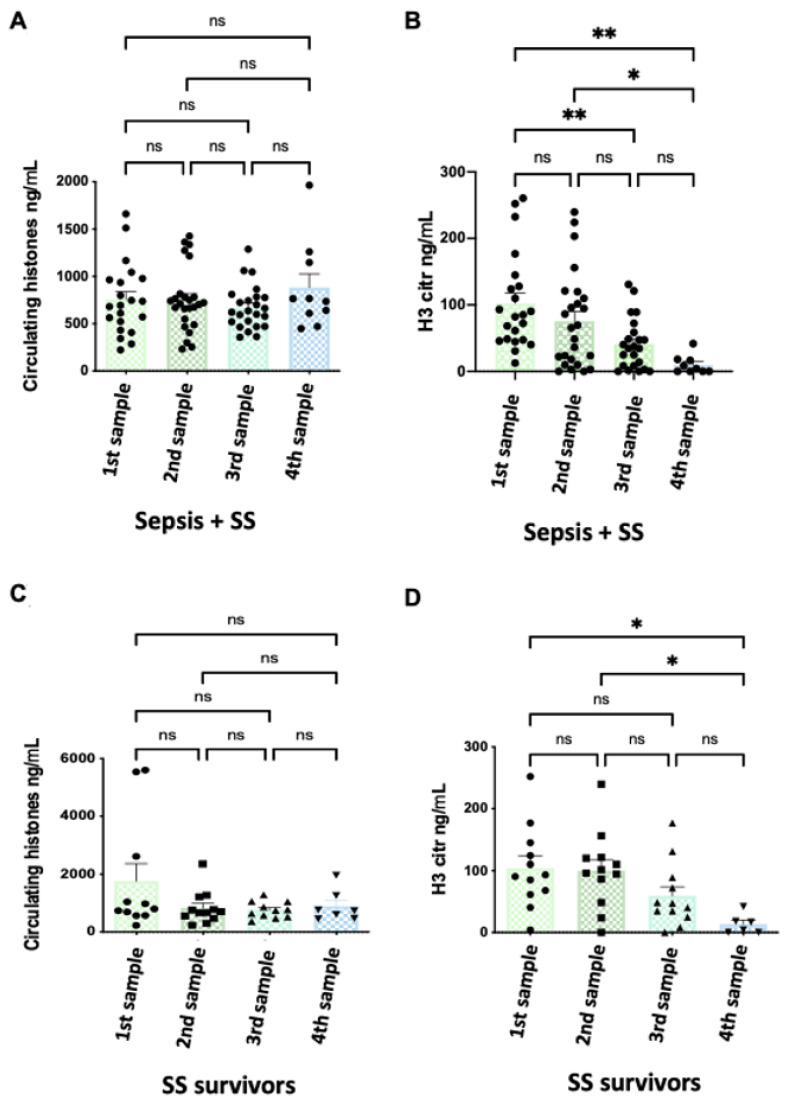
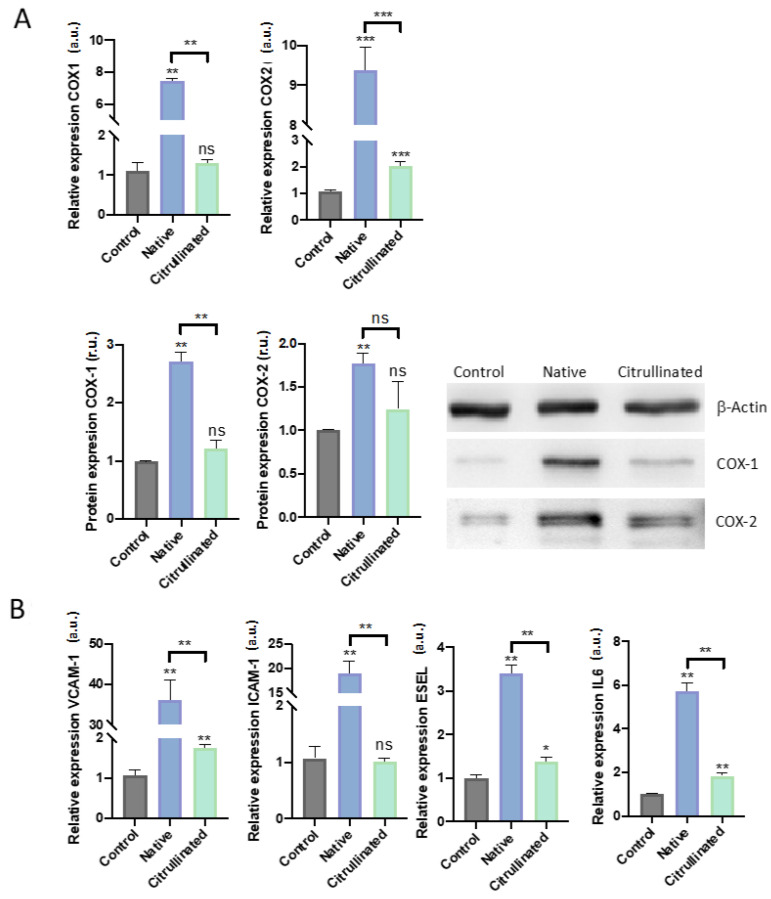
NETosis is a key host immune process against a pathogenic infection during innate immune activation, consisting of a neutrophil "explosion" and, consequently, NET formation, containing mainly DNA, histones, and other nuclear proteins. During sepsis, an exacerbated immune host response to an infection occurs, activating the innate immunity and NETosis events, which requires histone H3 citrullination. Our group compared the circulating histone levels with those citrullinated H3 levels in plasma samples of septic patients. In addition, we demonstrated that citrullinated histones were less cytotoxic for endothelial cells than histones without this post-translational modification. Citrullinated histones did not affect cell viability and did not activate oxidative stress. Nevertheless, citrullinated histones induced an inflammatory response, as well as regulatory endothelial mechanisms. Furthermore, septic patients showed elevated levels of circulating citrullinated histone H3, indicating that the histone citrullination is produced during the first stages of sepsis, probably due to the NETosis process.

Keywords: NETosis; biomarker; citrullination; histones; progression; sepsis; septic shock.


Conflict of interest statement

J.L.G.-G., N.C. and F.V.P. are inventors of a patent (EP3535587B1) related to the detection of circulating histones by mass spectrometry. J.L.G.-G. and F.V.P. are funders and own stocks of EpiDisease S.L., a spin-off from the Consortium Center for Biomedical Network Research (CIBER-ISCIII) and Biomedical Research Institute INCLIVA. The other authors declare no conflicts of interest.

Figures

Figure 1
Figure 1
Circulating histone levels and H3cit levels differences among patient groups. (A) Variation in circulating histone levels among patient groups; (B) variation in H3cit levels among patient groups. These graphics show all sample times: first sample (during the first 24 h of patient admission in the ICU), second sample (after 3 days), third sample (after 5 days), and fourth sample (pre-discharge or before death). Data are expressed as the mean ± SEM; * p < 0.05, ** p < 0.01, **** p < 0.001, ns: not statistically significant. The lines at the top of the columns indicate differences between compared conditions. Abbreviations: ns, nonsignificant p-value; SS, septic shock; S: septic patients. Please note that H3citr levels were around 10 orders lower than the circulating histone concentration.
Figure 2
Figure 2
Circulating histone levels and H3cit variation along patients’ ICU stay in survivor patients. (A) Variation in circulating histone levels along the septic (sepsis and SS) patients’ ICU stay; (B) variation in H3cit levels along the septic (sepsis and septic shock) patients’ ICU stay. (C) Variation in circulating histone levels in SS survivor patients along ICU stay; (D) variation in H3cit levels in SS survivor patients along ICU stay. The X-axis shows the samples that were taken during the stay of patients in the ICU: first sample (during the first 24 h of patient admission in the ICU), second sample (after 3 days), third sample (after 5 days), and fourth sample (pre-discharge or before death). Data are expressed as the mean ± SEM; * p < 0.05, ** p < 0.01, ns: not statistically significant. The lines at the top of columns indicate differences between compared conditions. Abbreviations: ns, nonsignificant p-value.
Figure 3
Figure 3
Heatmap representing sepsis survivor Spearman’s rank correlation coefficients (−1 to +1) among clinical variables analyzed. Red color indicates a negative correlation, and blue color indicates a positive correlation between compared parameters. (A) First sample obtained (during the first 24 h of patient admission in the ICU); (B) second sample obtained (after 3 days in the ICU); (C) third sample (after 5 days in the ICU). Abbreviations: CircHist: circulating histones; CitrH3: citrullinated H3; APC; activated protein C; SOFA: Sequential (sepsis-related) Organ Failure Assessment; APTT: activated partial thromboplastin time; PCR: reactive C protein; PCT: procalcitonin; PMN: polymorphonuclear cells; Plaq: platelets; Quick: quick SOFA; DD: D-dimer; TropUS: ultrasensitive troponin; FuncProtC: functional C protein; APACHE II: Acute Physiology and Chronic Health Disease Classification System II; Protromb Tot: total prothrombin; LAC6H: lactate after 6 h ICU entrance. The number of subjects analyzed was as follows: control (n = 10); intensive care unit (ICU) (n = 5); sepsis (n = 10); septic shock (SS) (n = 15).
Figure 4
Figure 4
SS survivor heatmap representing Spearman’s rank correlation coefficients (−1 to +1) among clinical variables analyzed. Red color indicates a negative correlation, and blue color indicates a positive correlation between compared parameters. (A) First sample obtained (during the first 24 h of patient admission in the ICU); (B) second sample obtained (after 3 days in the ICU); (C) third sample (after 5 days in the ICU). Abbreviations: CircHist: circulating histones; CitrH3: citrullinated H3; APC; activated protein C; SOFA: Sequential (sepsis-related) Organ Failure Assessment; APTT: activated partial thromboplastin time; PCR: reactive C protein; PCT: procalcitonin; PMN: polymorphonuclear cells; Plaq: platelets; Quick: quick SOFA; DD: D-dimer; TropUS: ultrasensitive troponin; FuncProtC: functional C protein; APACHE II: Acute Physiology and Chronic Health Disease Classification System II; Protromb Tot: total prothrombin; LAC6H: lactate after 6 h ICU entrance. The number of subjects analyzed was as follows: control (n = 10); intensive care unit (ICU) (n = 5); sepsis (n = 10); septic shock (SS) (n = 15).
Figure 5
Figure 5
SS non-survivor heatmap representing Spearman’s rank correlation coefficients (−1 to +1) among clinical variables analyzed. Red color indicates a negative correlation, and blue color indicates a positive correlation between compared parameters. (A) First sample obtained (during the first 24 h of patient admission in the ICU); (B) second sample obtained (after 3 days in the ICU); (C) third sample (after 5 days in the ICU). Abbreviations: CircHist: circulating histones; CitrH3: citrullinated H3; APC; activated protein C; SOFA: Sequential (sepsis-related) Organ Failure Assessment; APTT: activated partial thromboplastin time; PCR: reactive C protein; PCT: procalcitonin; PMN: polymorphonuclear cells; Plaq: platelets; Quick: quick SOFA; DD: D-dimer; TropUS: ultrasensitive troponin; FuncProtC: functional C protein; APACHE II: Acute Physiology and Chronic Health Disease Classification System II; Protromb Tot: total prothrombin; LAC6H: lactate after 6 h ICU entrance. The number of subjects analyzed was as follows: control (n = 10); intensive care unit (ICU) (n = 5); sepsis (n = 10); septic shock (SS) (n = 15).
Figure 6
Figure 6
Cellular viability. (A) MTT method for cellular viability measurement. (B) Flow cytometry for viability/cell death measurement. (C) Optical microscopy for showing how HUVECs respond when exposed to extracellular histones. The scale of optical microscopy images is 100 μm. Data are expressed as the mean ± SEM from 3–5 independent experiments; ** p < 0.01, ns: not statistically significant, compared to control (histones 0μg/mL) unless the lines at the top of the columns indicate differences between compared conditions. Abbreviations: ns, nonsignificant p-value.
Figure 7
Figure 7
Oxidative stress and antioxidant response in HUVECs are challenged with 50μg/mL of extracellular histones (native and citrullinated). (A) Relative expression of antioxidant enzymes involved in the detoxification of superoxide (SOD1 and SOD2) and hydrogen peroxide (CAT and GPX1) evaluated by RT-qPCR in HUVECs treated with extracellular histones (native and citrullinated); (B) representative Western Blot showing the protein levels of the antioxidant enzymes CuZnSOD (SOD-1), MnSOD (SOD-2), catalase (CAT), and glutathione peroxidase 1 (Gpx-1); (C) densitometry of 3–5 independent Western blot experiments showing the relative amount of the antioxidant enzymes in each of the analyzed conditions. Data are expressed as the mean ± SEM from 3–5 independent experiments; * p < 0.05, ** p < 0.01, compared to control (histones 0 μg/mL) unless the lines at the top of the columns indicate differences between compared conditions. Abbreviations: ns, nonsignificant p-value; a.u., arbitrary units; r.u., relative units. The lines at the top of the columns indicate differences between compared conditions.
Figure 8
Figure 8
Prostanoids and endothelial response in HUVECs challenged with 50 μg/mL of extracellular histones (native and citrullinated). (A) Relative expression of the enzymes involved in the synthesis of prostanoids and eNOS determined by RT-qPCR; (B) a representative Western blot showing the protein levels of PGIS, TBXAS, and oxide nitrate synthase; (C) densitometry of 3–5 independent Western blot experiments showing the relative amount of proteins (PGI2, TBXA2, and the oxide nitrate synthase) and (D) PGI2/TBXA2 ratio. Data are expressed as the mean ± SEM from 3–5 independent experiments; * p < 0.05, ** p < 0.01, *** p < 0.001, compared to control (histones 0 μg/mL) unless the lines at the top of the columns indicate differences between compared conditions. Abbreviations: ns, nonsignificant p-value; a.u., arbitrary units; r.u., relative units.
Figure 9
Figure 9
Immune response in HUVECs challenged with 50 μg/mL of extracellular histones (native and citrullinated). Data are expressed as the mean ± SEM from 3–5 independent experiments; * p < 0.05, ** p < 0.01, *** p < 0.001. (A) Relative expression evaluated by RT-qPCR and WB for regulators of the prostanoid pathway, COX-1, and COX-2; (B) Relative expression evaluated by RT-qPCR of the mediators of endothelial adhesion (VCAM-1, ICAM-1, and ESEL) and the proinflammatory IL-6. Statistics compared to control (histones 0 μg/mL) unless the lines at the top of the columns indicate differences between compared conditions. Abbreviations: ns, nonsignificant p-value; a.u., arbitrary units; r.u., relative units.

References

    1. Singer M., Deutschman C.S., Seymour C.W., Shankar-Hari M., Annane D., Bauer M., Bellomo R., Bernard G.R., Chiche J.-D., Coopersmith C.M., et al. The Third International Consensus Definitions for Sepsis and Septic Shock (Sepsis-3) JAMA. 2016;315:801–810. doi: 10.1001/jama.2016.0287. - DOI - PMC - PubMed
    1. Sakr Y., Jaschinski U., Wittebole X., Szakmany T., Lipman J., Ñamendys-Silva S.A., Martin-Loeches I., Leone M., Lupu M.-N., Vincent J.-L., et al. Sepsis in Intensive Care Unit Patients: Worldwide Data from the Intensive Care over Nations Audit. Open Forum Infect. Dis. 2018;5:ofy313. doi: 10.1093/ofid/ofy313. - DOI - PMC - PubMed
    1. Rudd K.E., Johnson S.C., Agesa K.M., Shackelford K.A., Tsoi D., Kievlan D.R., Colombara D.V., Ikuta K.S., Kissoon N., Finfer S., et al. Global, regional, and national sepsis incidence and mortality, 1990–2017: Analysis for the Global Burden of Disease Study. Lancet. 2020;395:200–211. doi: 10.1016/S0140-6736(19)32989-7. - DOI - PMC - PubMed
    1. Brinkmann V., Reichard U., Goosmann C., Fauler B., Uhlemann Y., Weiss D.S., Weinrauch Y., Zychlinsky A. Neutrophil extracellular traps kill bacteria. Science. 2004;303:1532–1535. doi: 10.1126/science.1092385. - DOI - PubMed
    1. Yipp B.G., Kubes P. NETosis: How vital is it ? Blood. 2013;122:2784–2795. doi: 10.1182/blood-2013-04-457671. - DOI - PubMed

Publication types