

An Approach for Systems-Level Understanding of Prostate Cancer from High-Throughput Data Integration to Pathway Modeling and Simulation
- PMID: 36552885
- PMCID: PMC9777290
- DOI: 10.3390/cells11244121
An Approach for Systems-Level Understanding of Prostate Cancer from High-Throughput Data Integration to Pathway Modeling and Simulation
Abstract
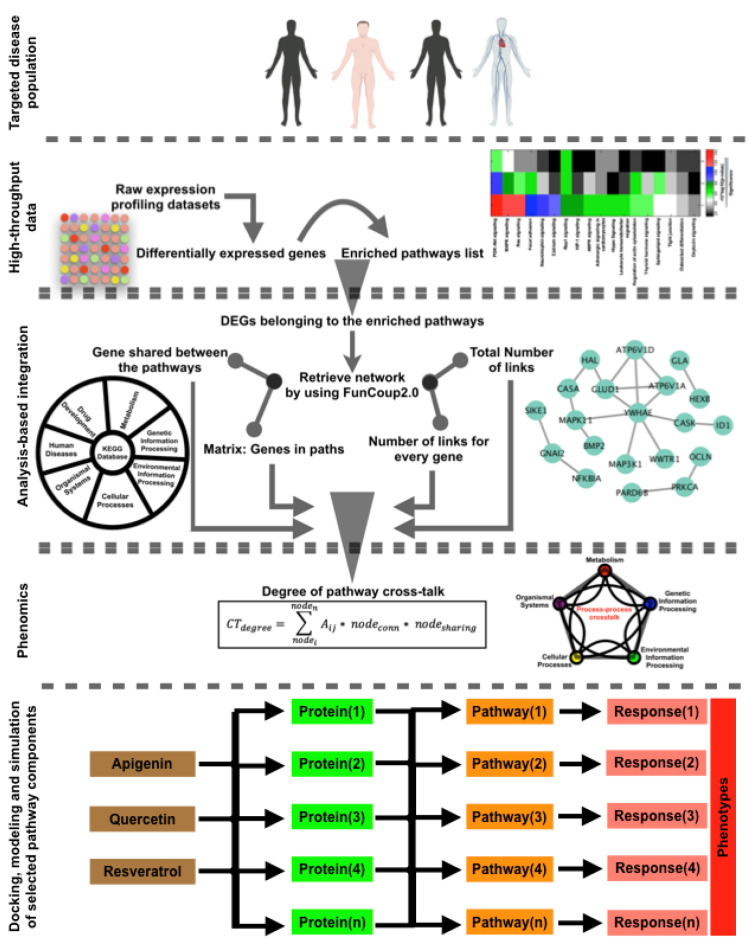
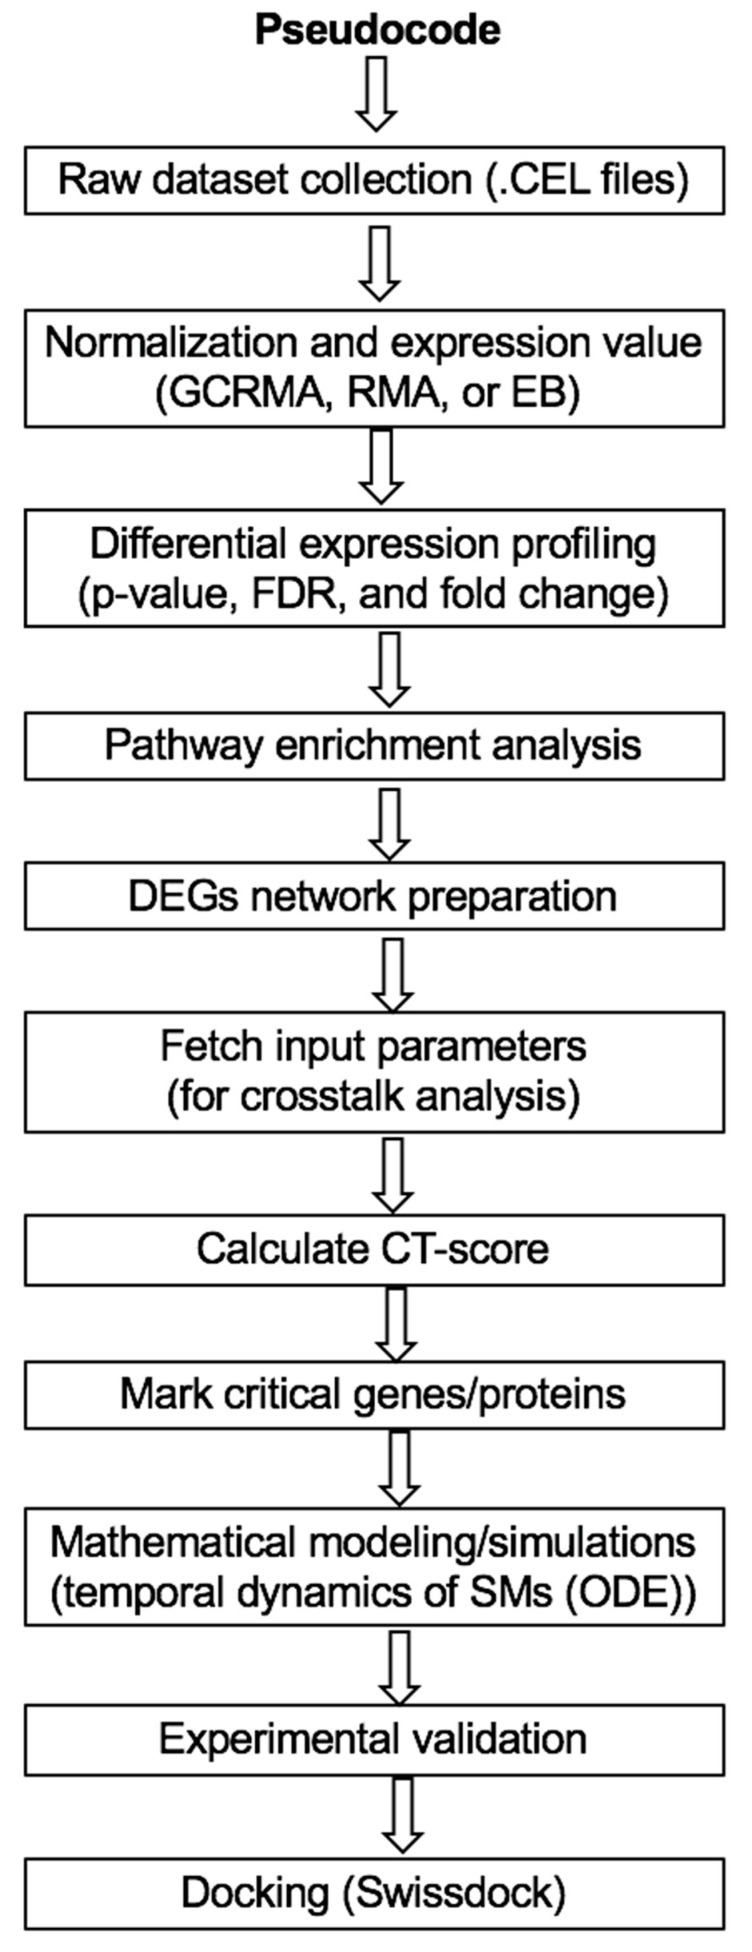
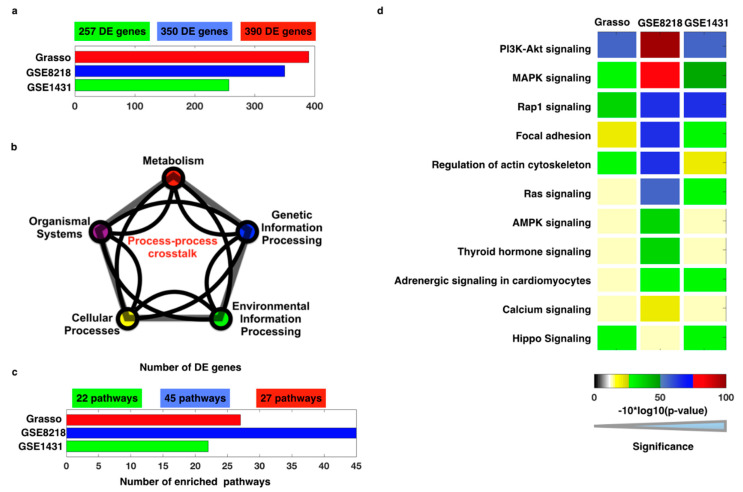
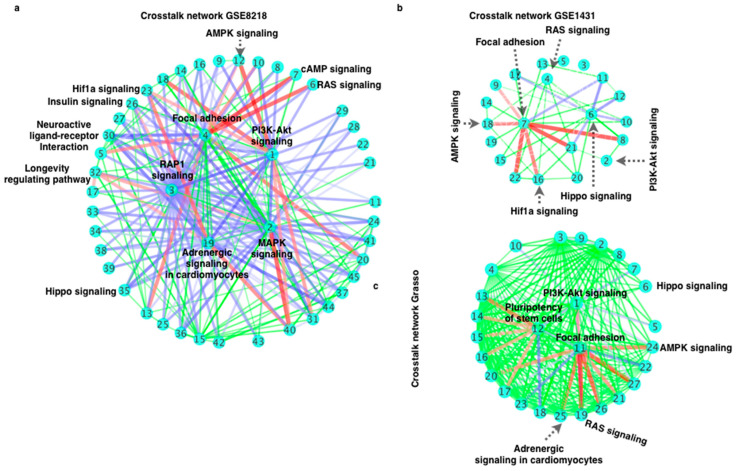
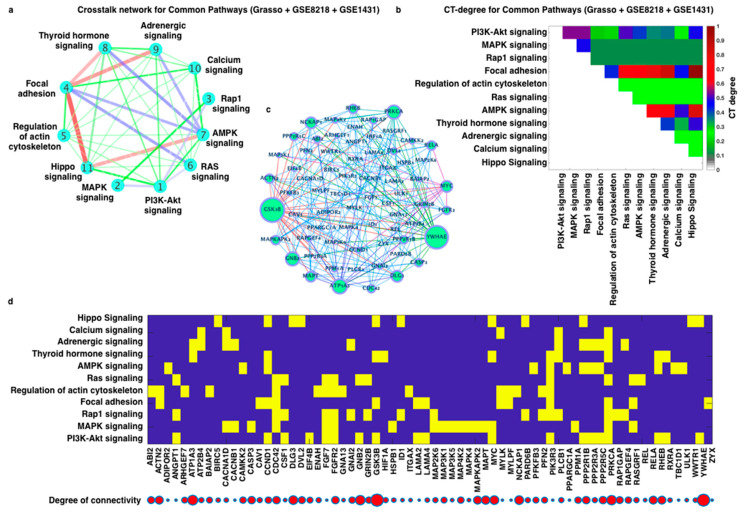
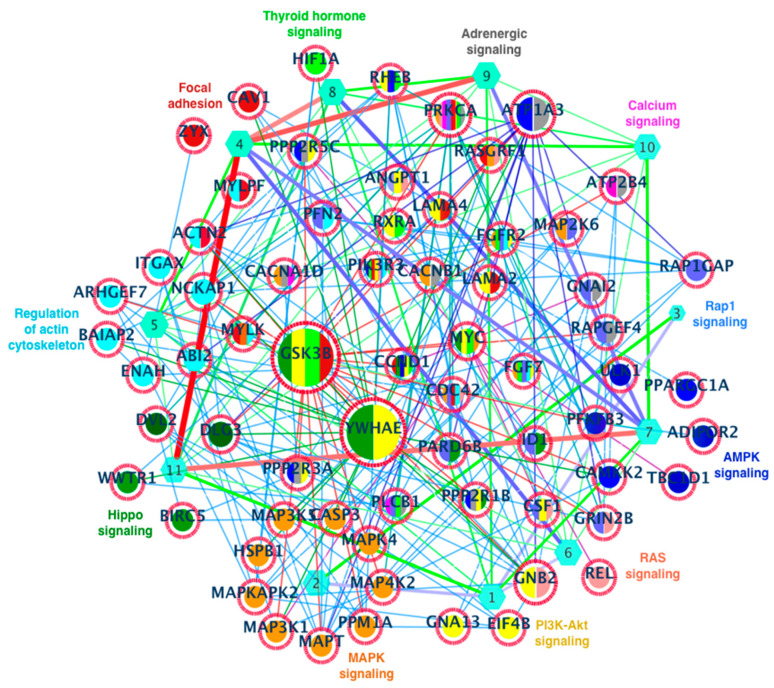
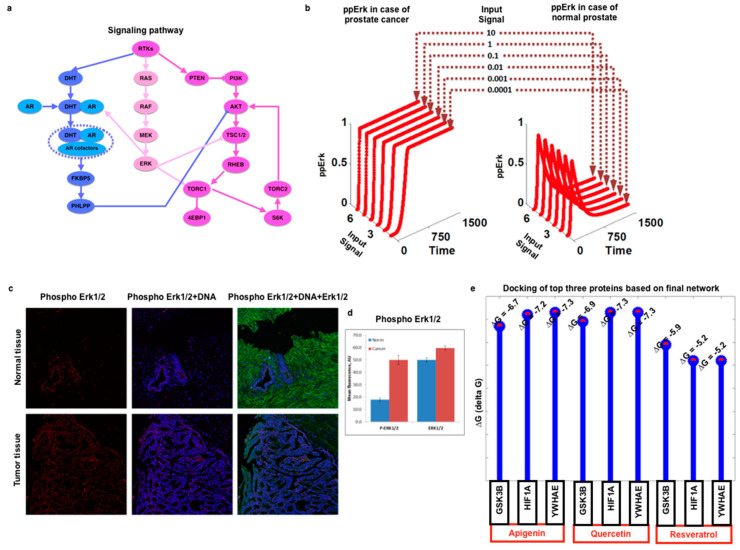
To understand complex diseases, high-throughput data are generated at large and multiple levels. However, extracting meaningful information from large datasets for comprehensive understanding of cell phenotypes and disease pathophysiology remains a major challenge. Despite tremendous advances in understanding molecular mechanisms of cancer and its progression, current knowledge appears discrete and fragmented. In order to render this wealth of data more integrated and thus informative, we have developed a GECIP toolbox to investigate the crosstalk and the responsible genes'/proteins' connectivity of enriched pathways from gene expression data. To implement this toolbox, we used mainly gene expression datasets of prostate cancer, and the three datasets were GSE17951, GSE8218, and GSE1431. The raw samples were processed for normalization, prediction of differentially expressed genes, and the prediction of enriched pathways for the differentially expressed genes. The enriched pathways have been processed for crosstalk degree calculations for which number connections per gene, the frequency of genes in the pathways, sharing frequency, and the connectivity have been used. For network prediction, protein-protein interaction network database FunCoup2.0 was used, and cytoscape software was used for the network visualization. In our results, we found that there were enriched pathways 27, 45, and 22 for GSE17951, GSE8218, and GSE1431, respectively, and 11 pathways in common between all of them. From the crosstalk results, we observe that focal adhesion and PI3K pathways, both experimentally proven central for cellular output upon perturbation of numerous individual/distinct signaling pathways, displayed highest crosstalk degree. Moreover, we also observe that there were more critical pathways which appear to be highly significant, and these pathways are HIF1a, hippo, AMPK, and Ras. In terms of the pathways' components, GSK3B, YWHAE, HIF1A, ATP1A3, and PRKCA are shared between the aforementioned pathways and have higher connectivity with the pathways and the other pathway components. Finally, we conclude that the focal adhesion and PI3K pathways are the most critical pathways, and since for many other pathways, high-rank enrichment did not translate to high crosstalk degree, the global impact of one pathway on others appears distinct from enrichment.
Keywords: crosstalk; docking; enriched pathways; gene expression; high-throughput data; mathematical modeling and simulation; systems-level understanding.
Conflict of interest statement
The authors declare no conflict of interest. The funders had no role in the design of the study; in the collection, analyses, or interpretation of data; in the writing of the manuscript, or in the decision to publish the results.
Figures
Similar articles
-
Network analysis of an in vitro model of androgen-resistance in prostate cancer.BMC Cancer. 2015 Nov 10;15:883. doi: 10.1186/s12885-015-1884-7. BMC Cancer. 2015. PMID: 26553226 Free PMC article.
-
Identification of key genes and pathways in castrate-resistant prostate cancer by integrated bioinformatics analysis.Pathol Res Pract. 2020 Oct;216(10):153109. doi: 10.1016/j.prp.2020.153109. Epub 2020 Jul 13. Pathol Res Pract. 2020. PMID: 32853947
-
Pathway crosstalk analysis in prostate cancer based on protein-protein network data.Neoplasma. 2017;64(1):22-31. doi: 10.4149/neo_2017_103. Neoplasma. 2017. PMID: 27881001
-
Derivation and Validation of the Potential Core Genes in Pancreatic Cancer for Tumor-Stroma Crosstalk.Biomed Res Int. 2018 Nov 5;2018:4283673. doi: 10.1155/2018/4283673. eCollection 2018. Biomed Res Int. 2018. PMID: 30519576 Free PMC article.
-
Screening of hub genes and evaluation of the growth regulatory role of CD44 in metastatic prostate cancer.Oncol Rep. 2021 Sep;46(3):196. doi: 10.3892/or.2021.8147. Epub 2021 Jul 23. Oncol Rep. 2021. PMID: 34296309 Free PMC article.
Cited by
-
Genes Co-Expressed with ESR2 Influence Clinical Outcomes in Cancer Patients: TCGA Data Analysis.Int J Mol Sci. 2024 Aug 9;25(16):8707. doi: 10.3390/ijms25168707. Int J Mol Sci. 2024. PMID: 39201394 Free PMC article.
-
Targeted Drug Screening Leveraging Senescence-Induced T-Cell Exhaustion Signatures in Hepatocellular Carcinoma.Int J Mol Sci. 2024 Oct 18;25(20):11232. doi: 10.3390/ijms252011232. Int J Mol Sci. 2024. PMID: 39457014 Free PMC article.
-
Pharmacogenomics: A Genetic Approach to Drug Development and Therapy.Pharmaceuticals (Basel). 2024 Jul 13;17(7):940. doi: 10.3390/ph17070940. Pharmaceuticals (Basel). 2024. PMID: 39065790 Free PMC article. Review.
-
Role of ZNF143 and Its Association with Gene Expression Patterns, Noncoding Mutations, and the Immune System in Human Breast Cancer.Life (Basel). 2022 Dec 22;13(1):27. doi: 10.3390/life13010027. Life (Basel). 2022. PMID: 36675976 Free PMC article.
-
Development and evaluation of a risk score model based on a WNT score gene-associated signature for predicting the clinical outcome and the tumour microenvironment of hepatocellular carcinoma.Int J Immunopathol Pharmacol. 2023 Jan-Dec;37:3946320231218179. doi: 10.1177/03946320231218179. Int J Immunopathol Pharmacol. 2023. PMID: 38054921 Free PMC article.
References
Publication types
MeSH terms
Substances
LinkOut - more resources
Full Text Sources
Medical
Research Materials
Miscellaneous
