

Assessing Agreement When Agreement Is Hard to Assess-The Agatston Score for Coronary Calcification
- PMID: 36553000
- PMCID: PMC9777110
- DOI: 10.3390/diagnostics12122993
Assessing Agreement When Agreement Is Hard to Assess-The Agatston Score for Coronary Calcification
Abstract
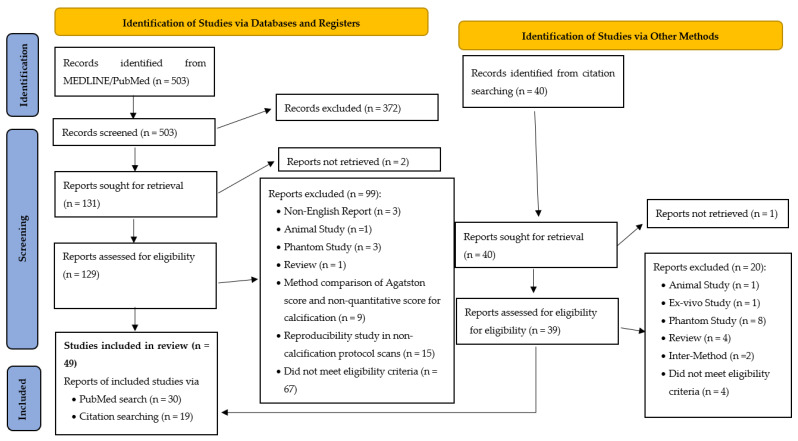
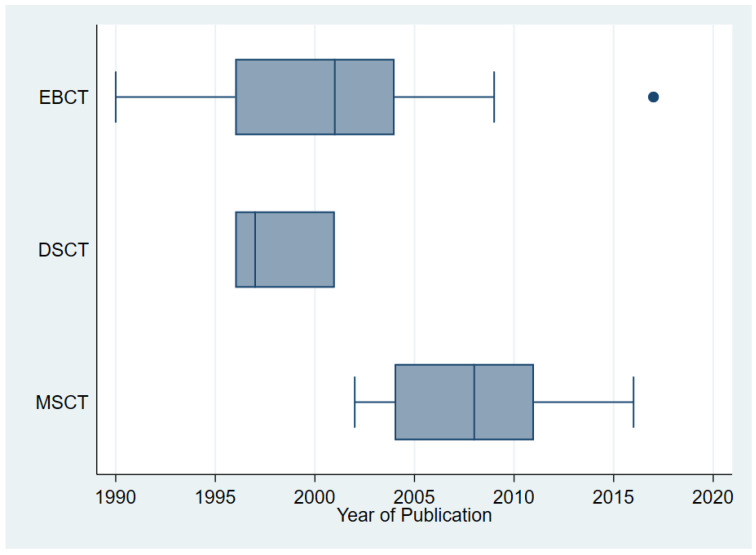
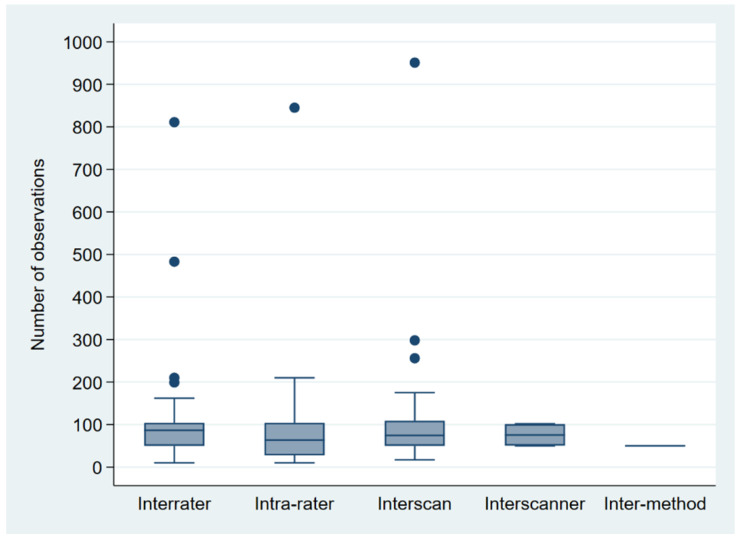
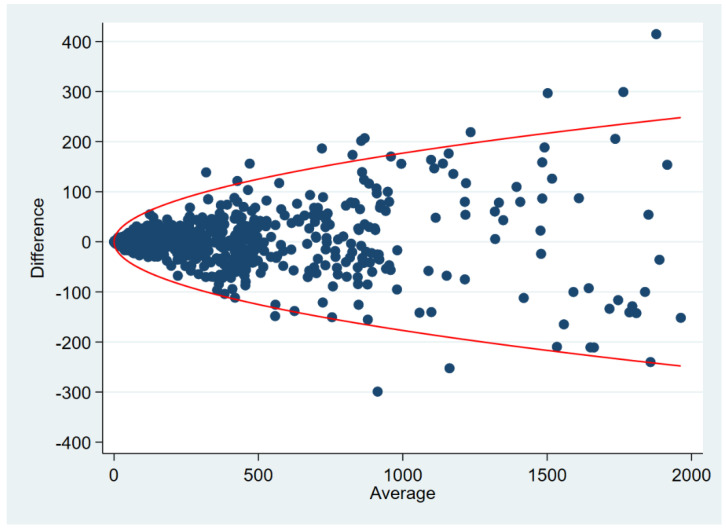
Method comparison studies comprised simple scatterplots of paired measurements, a 45-degree line as benchmark, and correlation coefficients up to the advent of Bland-Altman analysis in the 1980s. The Agatston score for coronary calcification is based on computed tomography of the heart, and it originated in 1990. A peculiarity of the Agatston score is the often-observed skewed distribution in screening populations. As the Agatston score has manifested itself in preventive cardiology, it is of interest to investigate how reproducibility of the Agatston score has been established. This review is based on literature findings indexed in MEDLINE/PubMed before 20 November 2021. Out of 503 identified articles, 49 papers were included in this review. Sample sizes were highly variable (10-9761), the main focus comprised intra- and interrater as well as intra- and interscanner variability assessments. Simple analysis tools such as scatterplots and correlation coefficients were successively supplemented by first difference, later Bland-Altman plots; however, only very few publications were capable of deriving Limits of Agreement that fit the observed data visually in a convincing way. Moreover, several attempts have been made in the recent past to improve the analysis and reporting of method comparison studies. These warrant increased attention in the future.
Keywords: Bland–Altman; agreement; calcium; computed tomography; difference plot; heart; method comparison; quantitative; repeatability; reproducibility.
Conflict of interest statement
The authors declare no conflict of interest.
Figures
Similar articles
-
Automated coronary artery calcification scoring in non-gated chest CT: agreement and reliability.PLoS One. 2014 Mar 13;9(3):e91239. doi: 10.1371/journal.pone.0091239. eCollection 2014. PLoS One. 2014. PMID: 24625525 Free PMC article.
-
Accurate Measurement of Agatston Score Using kVp-Independent Reconstruction Algorithm for Ultra-High-Pitch Sn150 kVp CT.Korean J Radiol. 2021 Nov;22(11):1777-1785. doi: 10.3348/kjr.2021.0050. Epub 2021 Aug 19. Korean J Radiol. 2021. PMID: 34431246 Free PMC article.
-
Very low-dose coronary artery calcium scanning with high-pitch spiral acquisition mode: comparison between 120-kV and 100-kV tube voltage protocols.J Cardiovasc Comput Tomogr. 2013 Jan-Feb;7(1):32-8. doi: 10.1016/j.jcct.2012.11.004. Epub 2012 Dec 1. J Cardiovasc Comput Tomogr. 2013. PMID: 23333186
-
Reporting Standards for a Bland-Altman Agreement Analysis: A Review of Methodological Reviews.Diagnostics (Basel). 2020 May 22;10(5):334. doi: 10.3390/diagnostics10050334. Diagnostics (Basel). 2020. PMID: 32456091 Free PMC article. Review.
-
Understanding Bland Altman analysis.Biochem Med (Zagreb). 2015 Jun 5;25(2):141-51. doi: 10.11613/BM.2015.015. eCollection 2015. Biochem Med (Zagreb). 2015. PMID: 26110027 Free PMC article. Review.
References
-
- Altman D.G., Bland J.M. Measurement in medicine: The analysis of method comparison studies. Statistician. 1983;32:307–317. doi: 10.2307/2987937. - DOI
-
- Tukey J.W. Exploratory Data Analysis. Pearson; Cambridge, MA, USA: 1977.
-
- Rosner B. Fundamentals of Biostatistics. 8th ed. Cengage Learning; Boston, MA, USA: 2015.
-
- 68–95–99.7 Rule. [(accessed on 2 September 2022)]. Available online: https://en.wikipedia.org/wiki/68-95-99.7_rule.
Publication types
LinkOut - more resources
Full Text Sources
Research Materials
Miscellaneous
