. 2022 Nov 23;13(12):2189.
doi: 10.3390/genes13122189.

A Multigraph-Based Representation of Hi-C Data

Affiliations

A Multigraph-Based Representation of Hi-C Data

Diána Makai et al. Genes (Basel). .

Abstract

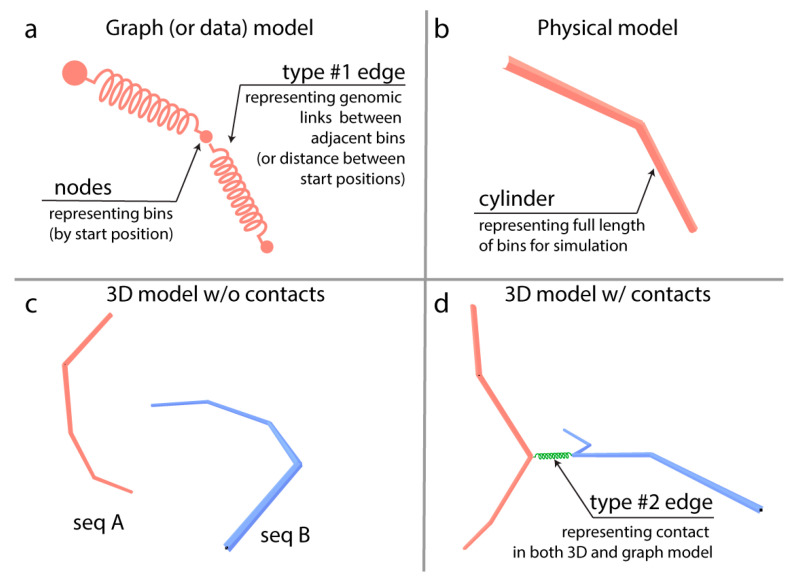
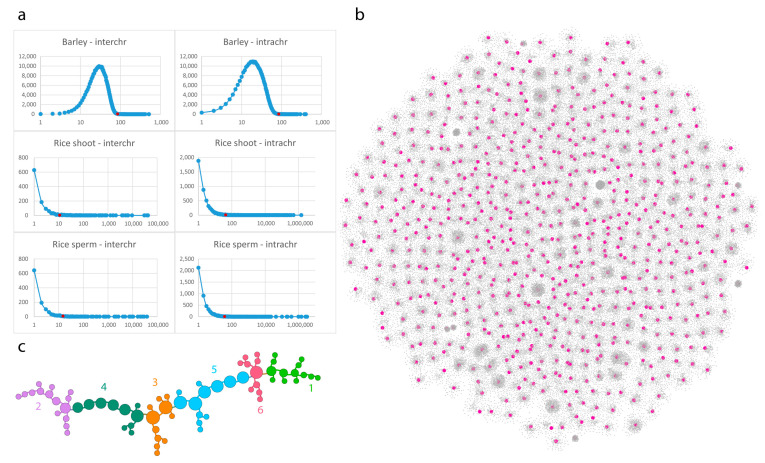
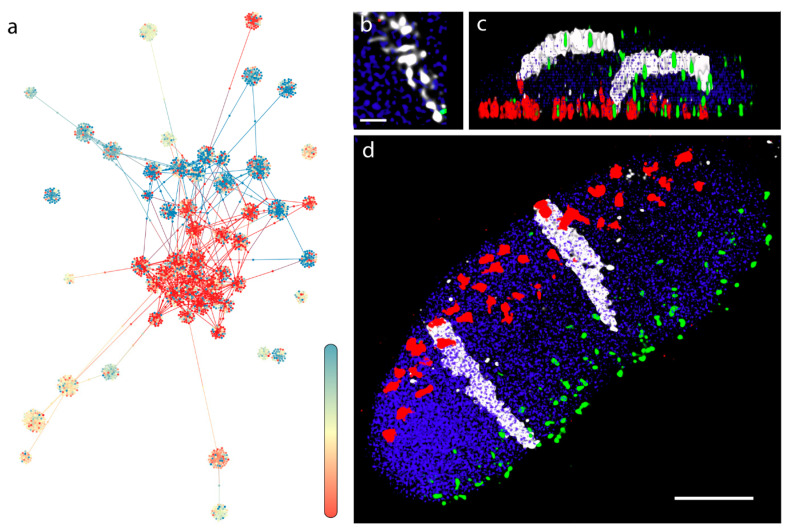
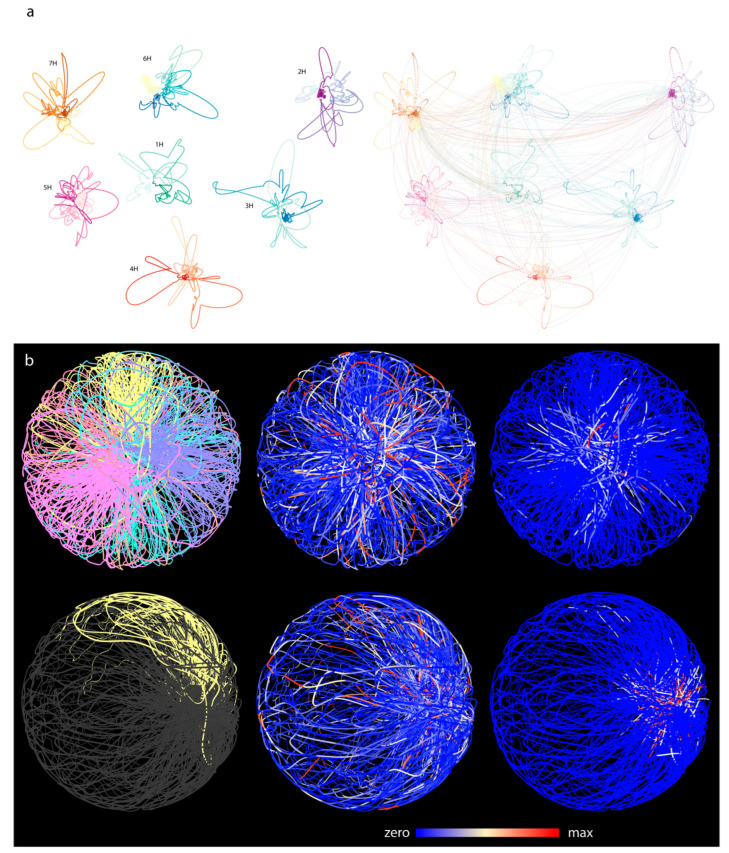
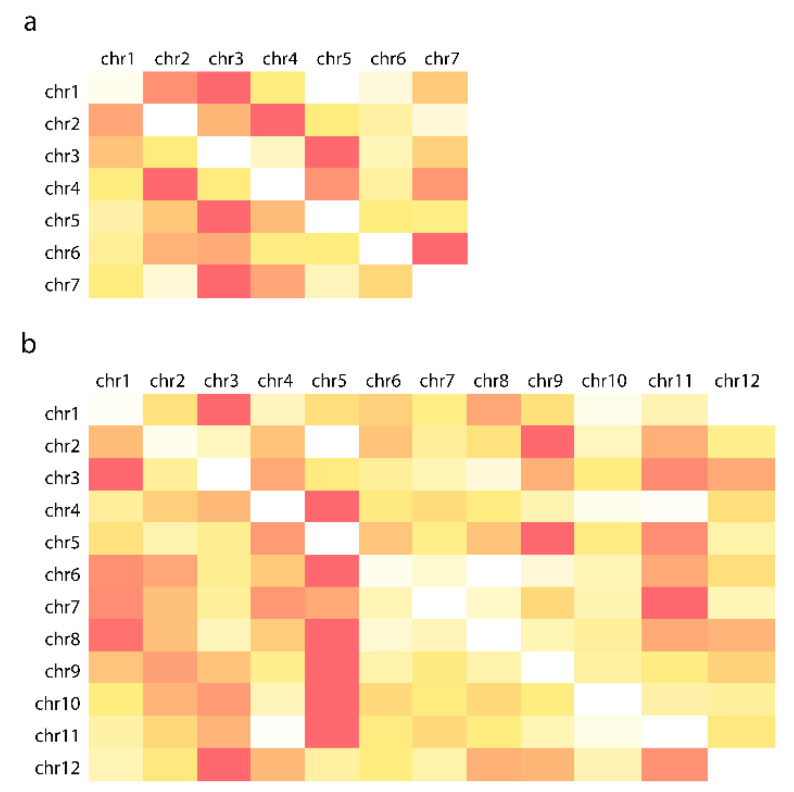
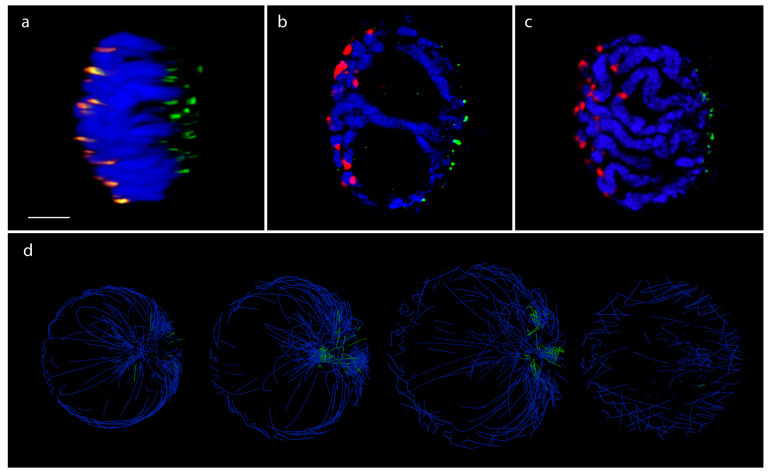
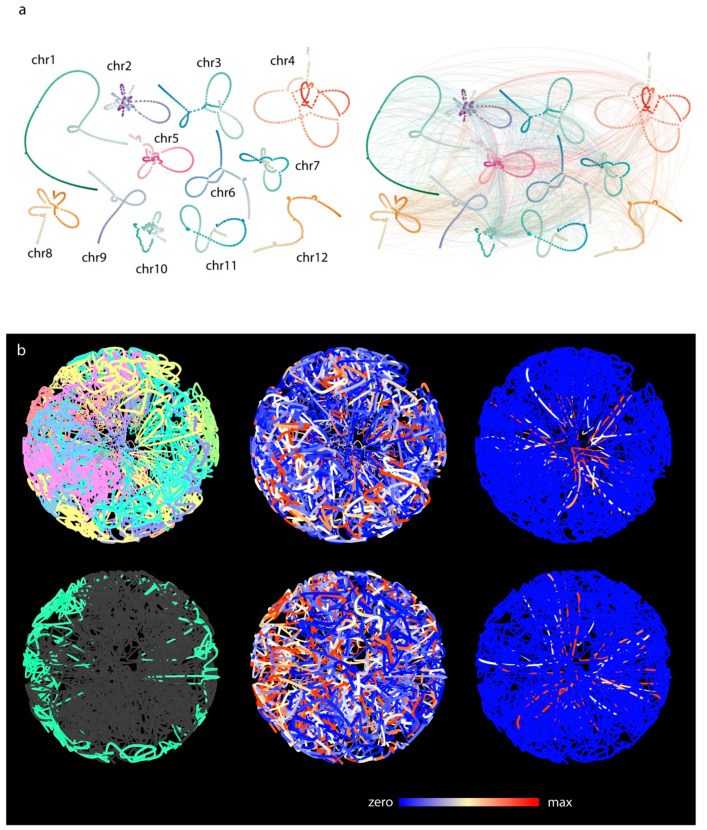
Chromatin-chromatin interactions and three-dimensional (3D) spatial structures are involved in transcriptional regulation and have a decisive role in DNA replication and repair. To understand how individual genes and their regulatory elements function within the larger genomic context, and how the genome reacts to environmental stimuli, the linear sequence information needs to be interpreted in three-dimensional space, which is still a challenging task. Here, we propose a novel, heuristic approach to represent Hi-C datasets by a whole-genomic pseudo-structure in 3D space. The baseline of our approach is the construction of a multigraph from genomic-sequence data and Hi-C interaction data, then applying a modified force-directed layout algorithm. The resulting layout is a pseudo-structure. While pseudo-structures are not based on direct observation and their details are inherent to settings, surprisingly, they demonstrate interesting, overall similarities of known genome structures of both barley and rice, namely, the Rabl and Rosette-like conformation. It has an exciting potential to be extended by additional omics data (RNA-seq, Chip-seq, etc.), allowing to visualize the dynamics of the pseudo-structures across various tissues or developmental stages. Furthermore, this novel method would make it possible to revisit most Hi-C data accumulated in the public domain in the last decade.

Keywords: DNA; Hi-C; barley; graph theory; rice.


Conflict of interest statement

The authors declare no conflict of interest.

Figures

Figure 1
Figure 1
A visual summary of the multigraph model. (a) The graph/data model depicts the genome as a graph of adjacent bins. (b) The physical interpretation of the graph-based genome model is that nodes represent the start positions of the bins and edges are the physical representation of the bins which are visualized as cylinders. (c) Two dummy chromosomes (seq A and seq B) without contacts set in an energy-minimalizing configuration. By adjusting the properties of the bins, the cylinders can be shorter or longer which, in turn, can be used as a model for condensed or decondensed state. (d) Between nodes, a type #2 edge can be introduced based on contact data from Hi-C experiments. This puts extra strains on bins, therefore changing the configuration and length of cylinders (while its parameters are unchanged); hence, a graph-based 3D genome. Since the genome and the contact graphs are two different graphs of the same node set (called vertices in graph theory), our 3D genome model is a multigraph.
Figure 2
Figure 2
Contact graph construction and analysis. (a) Contacts per bin distribution of selected Hi-C libraries. The curve shows the number of bins that have a given contact count. The x-axis is logarithmic, and shows contact count; the y-axis is linear and shows the number of bins. On the charts, a red dot shows the cut-off value for each analysis (see numbers in the Section 2 of the manuscript). For further downstream analysis, only bins that have a frequency of this value or higher were used. In all cases, self-loops were discarded and not counted. (b) A 2D representation of interchromosomal filtered contacts of barley (See methods). Magenta nodes represent bins that have 14, or more than 14, edges in the graph. The layout indicates that contacts between the non-homologuous chromosomes are organized by dedicated genomic regions, suggesting hierarchical genomic structures. (c) The largest subgraph after filtering for bins of 14 or more different contacts. An intriguing linear layout of contacts has emerged, suggesting a signal transduction “highway” that might function like Newton’s cradle. Colors represent the clusters of the graph. The clusters were characterized by gene enrichment analysis which revealed housekeeping genes within the regions represented by the bins.
Figure 3
Figure 3
2D graph representation of the contact data of chromosome 7H of barley and microscopic evaluation of the organization of an individual (long) arm of the 7H barley chromosome (7HL) within the interphase nucleus. (a) A 2D graph representation of contact data of chromosome 7H. Contacts are filtered for intrachromosomal and 85 hits or above. Fully saturated blue and red colors represent the two telomeric ends of the chromosome. Positions are indicated by a gradient color in between the ends, where pale yellow marks the putative location of the pericentromeric region. Contacts are clustered within each telomeric regions with a few contacts between them. The pericentromeric region is well-separated from the telomeres, a contact pattern typical of the Rabl configuration. (b) A high-resolution image enlargement of the 7HL chromatin threads (white) intertwined with the neighboring chromatin captured within a mitotic nucleus of the 7BS-7HL wheat-barley translocation line with confocal laser-scanning microscopy. The 7BS-7HL wheat-barley translocation line carries the 7HL barley chromosome arms stably transferred into the wheat background, allowing the 3D visualization of the barley chromatin by genomic in-situ hybridization (GISH). (c) Side view of a three-dimensionally rendered z-stack captured from a mitotic nucleus of the 7BS-7HL wheat-barley translocation line. The 7HL barley chromatin is detected by GISH (shown in white), centromeres are visualized by simultaneous immunolabelling (red) and telomeres are shown by fluorescence in-situ hybridization (green). (d) Front view of the same three-dimensionally rendered z-stack, showing parallel arrangement of the two homologous 7H long arms. Rabl organization is clear from the polarized centromere (red signals)-telomere (green signals) arrangement and the signal of the perpendicularly running barley chromosome arms. Bar = 5 μm, except Figure 3b where bar represents 1 μm.
Figure 4
Figure 4
Going from 2D contact graph to multigraph model of 3D genome of barley. (a) Two-dimensional layouts of the multigraph of each barley chromosomes. Layout was calculated based on the intrachromosomal contacts only. Entanglement of the two ends of the chromosomes is clearly visible indicating the Rabl configuration. Right panel: interchromosomal contacts are added. (b) The three-dimensional pseudo-structure of barley genome. The two rows represent two orthogonal perspectives of the pseudo-structure. Coloring is based on different attributes. On the left panels, chromosomes are color coded (top) and the 5H chromosomes highlighted (bottom). On the central images, expression libraries of various tissues are mapped to the bins (source: the PRJEB14349 bioproject). On the right panels, colors indicate the frequency of interchromosomal contacts. Telomeric regions are enriched in highly conserved interchromosomal contacts.
Figure 5
Figure 5
Mean distances of bins grouped by chromosomes. The diagonal white rectangles indicate that in the pseudo-structure of barley (a) and rice (b), bins of the same chromosomes are closer to each other compared to bins located on other chromosomes. The darker the shade the larger is the value, white is the minimum of the row.
Figure 6
Figure 6
In situ and in silico. Fluorescence in-situ hybridization (FISH) showing centromeres (orange, red) and telomeres (green) on a 3D-fixed barley mitotic nucleus. Barley centromeres are labelled by the barley centromere-specific G+C repeat probe (red) while telomeres are visualized by the plant telomeric repeat sequences (TRS) used as a probe (green). Chromosomes are counterstained with DAPI. Bar = 5 μm. (a) Side view of a 3D-rendered z-stack captured from a barley mitotic nucleus. (b,c) FISH on individual image frames of a barley mitotic nucleus showing polarized centromere-telomere arrangement and chromosome arms laying parallel with the telomere-centromere axis. (d) In silico, cross-section images of the pseudo-structure of Barley genome. Green indicates telomeric regions. A well-distinguished nucleolus-like region is visible inside the spherical topology. Telomeres are clustered on one side of the spherical model.
Figure 7
Figure 7
Rice scHi-C data-based genome graph construction. (a) The 2D multigraph image of rice sperm cell. Left without interchromosomal contacts, right interchromosomal contacts drawn. (b) Three-dimensional pseudo-structure of rice sperm cell. The two rows represent two orthogonal perspectives of the pseudo-structure. Coloring is based on different attributes. Chromosome color coding shows apparent chromosome territories (top left). Green highlight indicates chr5 (bottom left). On the central images, expression library of sperm cells (GEO accession number: GSE50777) is mapped to the bins.

Similar articles

References

    1. Heslop-Harrison J.S.P., Schwarzacher T. Organisation of the Plant Genome in Chromosomes. Plant J. 2011;66:18–33. doi: 10.1111/j.1365-313X.2011.04544.x. - DOI - PubMed
    1. Gibcus J.H., Samejima K., Goloborodko A., Samejima I., Naumova N., Nuebler J., Kanemaki M.T., Xie L., Paulson J.R., Earnshaw W.C., et al. A Pathway for Mitotic Chromosome Formation. Science. 2018;359:139–148. doi: 10.1126/science.aao6135. - DOI - PMC - PubMed
    1. Paulson J.R., Hudson D.F., Cisneros-Soberanis F., Earnshaw W.C. Mitotic Chromosomes. Semin. Cell Dev. Biol. 2021;117:7–29. doi: 10.1016/j.semcdb.2021.03.014. - DOI - PMC - PubMed
    1. Beseda T., Cápal P., Kubalová I., Schubert V., Doležel J., Šimková H. Mitotic Chromosome Organization: General Rules Meet Species-Specific Variability. Comput. Struct. Biotechnol. J. 2020;18:1311–1319. doi: 10.1016/j.csbj.2020.01.006. - DOI - PMC - PubMed
    1. Vietri Rudan M., Barrington C., Henderson S., Ernst C., Odom D.T., Tanay A., Hadjur S. Comparative Hi-C Reveals That CTCF Underlies Evolution of Chromosomal Domain Architecture. Cell Rep. 2015;10:1297–1309. doi: 10.1016/j.celrep.2015.02.004. - DOI - PMC - PubMed

Publication types

LinkOut - more resources