. 2022 Dec 4;13(12):2283.
doi: 10.3390/genes13122283.

In Vitro Analysis of Biological Activity of Circulating Cell-Free DNA Isolated from Blood Plasma of Schizophrenic Patients and Healthy Controls-Part 2: Adaptive Response

Affiliations

In Vitro Analysis of Biological Activity of Circulating Cell-Free DNA Isolated from Blood Plasma of Schizophrenic Patients and Healthy Controls-Part 2: Adaptive Response

Svetlana V Kostyuk et al. Genes (Basel). .

Abstract

Oxidized in vitro genomic DNA (gDNA) is known to launch an adaptive response in human cell cultures. The cfDNA extracted from the plasma of schizophrenic patients (sz-cfDNA) and healthy controls (hc-cfDNA) contains increased amounts of 8-oxodG, a DNA-oxidation marker. The aim of the research was answering a question: can the human cfDNA isolated from blood plasma stimulate the adaptive response in human cells? In vitro responses of ten human skin fibroblasts (HSFs) and four peripheral blood mononuclear cell (PBMC) lines after 1-24 h of incubation with sz-cfDNA, gDNA and hc-cfDNA containing different amounts of 8-oxodG were examined. Expressions of RNA of eight genes (NOX4, NFE2L2, SOD1, HIF1A, BRCA1, BRCA2, BAX and BCL2), six proteins (NOX4, NRF2, SOD1, HIF1A, γH2AX and BRCA1) and DNA-oxidation marker 8-oxodG were analyzed by RT-qPCR and flow cytometry (when analyzing the data, a subpopulation of lymphocytes (PBL) was identified). Adding hc-cfDNA or sz-cfDNA to HSFs or PBMC media in equal amounts (50 ng/mL, 1-3 h) stimulated transient synthesis of free radicals (ROS), which correlated with an increase in the expressions of NOX4 and SOD1 genes and with an increase in the levels of the markers of DNA damage γH2AX and 8-oxodG. ROS and DNA damage induced an antioxidant response (expression of NFE2L2 and HIF1A), DNA damage response (BRCA1 and BRCA2 gene expression) and anti-apoptotic response (changes in BAX and BCL2 genes expression). Heterogeneity of cells of the same HSFs or PBL population was found with respect to the type of response to (sz,hc)-cfDNA. Most cells responded to oxidative stress with an increase in the amount of NRF2 and BRCA1 proteins along with a moderate increase in the amount of NOX4 protein and a low amount of 8-oxodG oxidation marker. However, upon the exposure to (sz,hc)-cfDNA, the size of the subpopulation with apoptosis signs (high DNA damage degree, high NOX4 and low NRF2 and BRCA1 levels) also increased. No significant difference between the responses to sz-cfDNA and hc-cfDNA was observed. Sz-cfDNA and hc-cfDNA showed similarly high bioactivity towards fibroblasts and lymphocytes. Conclusion: In cultured human cells, hc-cfDNA and sz-cfDNA equally stimulated an adaptive response aimed at launching the antioxidant, repair, and anti-apoptotic processes. The mediator of the development of the adaptive response are ROS produced by, among others, NOX4 and SOD1 enzymes.

Keywords: BRCA1; HIF1A; NOX4; NRF2; SOD1; adaptive response; cell-free DNA; schizophrenia; γH2AX.


Conflict of interest statement

The authors declare no conflict of interest.

Figures

Figure 1
Figure 1
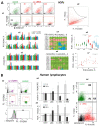
The exposure to cfDNA leads to an increase in ROS production. (A). Synthesis of ROS in HSFs, which were incubated for 1 h in the presence of DNA samples (50 ng/mL). a1—The results of the quantification of fluorescence using plate reader. The time kinetics of fluorescence outputs in cells treated with H2DCFH-DA. The data from the device are given for sz-HSF3. a2—Change of the kdcf in the presence of DNA samples. The DNA samples are indicated on the graph; medians—dotted lines. a3—Analysis of relative changes in ROS levels in the presence of DNA samples compared to control. Green color—no significant differences with the control (p > 0.01), red—increased RNA content in the presence of the DNA sample (p < 0.01). (*) the response to sz-cfDNA differs from the response to hc-cfDNA for this HSF (p < 0.01). (B). Synthesis of ROS in PBL, which were incubated for 1 and 24 h in the presence of DNA samples. b1—The most typical examples of ROS assay with FCA in PBL. b2—Change of the ROS level in PBL in the presence of DNA samples (50 ng/mL). Average values for four lymphocyte samples and the standard deviation are given. (*)—the differences with the control are significant (p < 0.01).
Figure 2
Figure 2
The exposure of HSFs and PBL to cfDNA (50 ng/mL) leads to the changes in NOX4 expression. (A). Change of the RNA NOX4 in HSFs in the presence of DNA samples. Average values for three measurements and standard deviation are given. The cultivation time and the DNA samples are indicated on the graph. The response to cfDNA differs from the control HSFs (p < 0.01). (B). b1—The most typical examples of NOX4 assay with FCA in HSFs. The data from the device are given for sz-HSF3 (1 h). b2—Index NOX4: the values of the medians of FL-NOX4i, normalized to the control signal value. Average values for three measurements and standard deviation are given. b3—Analysis of relative changes in NOX4 levels in the presence of DNA samples compared to control. Figures indicate the ratio (NOX4 DNA sample—NOX4control)/NOX4control. Green color—no significant differences with the control (p > 0.01), red—increased RNA content in the presence of the DNA probe (p < 0.01) and blue—decreased RNA content (p < 0.01). (*) the response to sz-cfDNA differs from the response to hc-cfDNA for this HSF (p < 0.01). b4—Changes in the NOX4 index in sample of HSFs (n = 10). (C). Localization of the labeled DNA sample (green) and NOX4 (red) in HSFs. An example is given for the sz-HSF3 line (probe sz-cfDNA, 1 h). (D). Change of the RNA NOX4 in PBL in the presence of DNA samples (50 ng/mL). Average values for four lymphocyte samples and standard deviation are given. (E). e1—The most typical examples of the NOX4 analysis with FCA in lymphocytes. e2—Changes in the NOX4 index in sample of lymphocytes (n = 4).
Figure 3
Figure 3
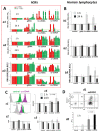
The influence of the DNA samples (50 ng/mL) on the expression of NFE2L2 gene in HSFs and lymphocytes. (A). Change of the RNA NFE2L2 in HSFs in the presence of DNA samples (50 ng/mL). Average values for three measurements and standard deviation are given. The cultivation time and the DNA samples are indicated on the graph. (*) The response to cfDNA differs from the control HSFs (p < 0.01). (B). b1—The most typical examples of the NRF2 assay with FCA in HSFs. The data from the device are given for sz-HSF1. b2—Index NRF2: the values of the medians of FL-NRF2i, normalized to the control signal value. Average values for three measurements and standard deviation are given. b3—Analysis of relative changes in NRF2 levels in the presence of DNA samples compared to control. Green color—no significant differences with the control (p > 0.01), red—increased RNA content in the presence of the DNA probe (p < 0.01) and blue—decreased RNA content (p < 0.01). (C). FCA. Sz-HSF4 staining with two types of antibodies with different labels: NRF2 (FITC) and NOX4 (PC5.5). (D). Change of the RNA NFE2L2 in the PBL in the presence of DNA samples (50 ng/mL). Average values for four lymphocyte samples and standard deviation are given. (E). e1—The most typical examples of NRF2 assay with FCA in lymphocytes. e2—Changes in the NRF2 index in sample of lymphocytes (n = 4). (F) The amounts of NOX4 and NRF2 proteins in PBL.
Figure 4
Figure 4
The influence of the DNA samples (50 ng/mL) on the expression of SOD1 and HIF1A genes in HSFs and PBL. (A). Change of the RNA SOD1 in HSFs. Average values for three measurements and standard deviation are given. The cultivation time and the DNA samples are indicated on the graph. The response to cfDNA differs from the control HSFs (p < 0.01). (B). b1—The most typical examples of the SOD1 assay with FCA in HSFs. The data from the device are given for sz-HSF3. b2—Index SOD1: the values of the medians of FL-NRF2i, normalized to the control signal value. Average values for three measurements and standard deviation are given. b3—Analysis of relative changes in SOD1 levels in the presence of DNA samples compared to control. Green color—no significant differences with the control (p > 0.01), red—increased RNA content in the presence of the DNA probe (p < 0.01) and blue—decreased RNA content (p < 0.01). b4—Changes in the SOD1 index in sample of sz-HSFs (n = 5) and hc-HSF(n = 5). (C). Change of the RNA HIF1A in HSFs. Average values for three measurements and standard deviation are given. The cultivation time and the DNA samples are indicated on the graph. (*) The response to cfDNA differs from the control HSFs (p < 0.01). (D). d1—The most typical examples of the HIF1A assay with FCA in HSFs. The data from the device are given for sz-HSF3. d2—Index HIF1A: the values of the medians of FL-NRF2i, normalized to the control signal value. Average values for three measurements and standard deviation are given. d3—Analysis of relative changes in HIF1A levels in the presence of DNA samples compared to control. Green color—no significant differences with the control (p > 0.01), red—increased RNA content in the presence of the DNA probe (p < 0.01) and blue—decreased RNA content (p < 0.01). (E). e1 and e2—Change of the RNA SOD1 and RNA HIV1A in the PBL in the presence of DNA samples (50 ng/mL). Average values for four lymphocyte samples and standard deviation are given.
Figure 5
Figure 5
The influence of the DNA samples on the 8-oxodG levels in HSFs and PBL. (A). a1—The most typical examples of the 8-oxodG assay with FCA in HSFs. The data from the device are given for sz-HSF2. a2—Proportion of R1 fraction cells. a3—Analysis of the changes in R1(8-oxodG) levels in the presence of DNA samples compared to control. a4—Changes in the R1(8-oxodG) levels in sample of HSFs (n = 10). a5—Index 8-oxodG(R2): the values of the medians of 8-oxodG(R2), normalized to the control signal value. Average values for three measurements and standard deviation are given. a6—Analysis of relative changes in 8-oxodG(R2) levels in the presence of DNA samples compared to control. a7—Changes in the 8-oxodG(R2) levels in sample of HSFs (n = 10). a8—Dependence of R1(8-oxodG) on 8-oxodG(R2). (B). b1—The most typical examples of the 8-oxodG assay with FCA in lymphocytes. b2,b3—Changes in the R1(8-oxodG) index and 8-oxodG(R2) index in sample of lymphocytes (n = 4). The asterisk * marks significant differences (p < 0.01 when n = 10 and p < 0.05 when n = 4).
Figure 6
Figure 6
The influence of the DNA samples on the γH2AX levels in HSFs and PBL. (A). a1—The most typical examples of the γH2AX assay with FCA in HSFs. The data from the device are given for sz-HSF3. a2—Proportion of R1(γH2AX) fraction cells. a3—Analysis of relative changes in R1(γH2AX) levels in the presence of DNA samples compared to control. a4—Changes in the R1(γH2AX) levels in sample of HSFs (n = 10). a5—Index γH2AX (R2): the values of the medians of γH2AX (R2), normalized to the control signal value. Average values for three measurements and standard deviation are given. a6—Analysis of relative changes in γH2AX (R2) levels in the presence of DNA samples compared to control. a7—Dependence of R1(8-oxodG) on R1(γH2AX). a8—sz-HSF4 staining with two types of antibodies with different labels: γH2AX (PB450) and 8-oxodG (PE). (B). b1—The most typical examples of the γH2AX assay with FCA in lymphocytes. b2,b3—Changes in the R1(γH2AX) index and γH2AX (R2) index in sample of lymphocytes (n = 4). b4—PBL staining with two types of antibodies with different labels: γH2AX (PB450) and 8-oxodG (PE).
Figure 7
Figure 7
The influence of the DNA samples (50 ng/mL) on the expression of BRCA1 and BRCA2 genes in HSFs and PBL. (A,B). Change of the RNA BRCA1 and RNA BRCA2 levels. Average values for three measurements and standard deviation are given. The cultivation time and the DNA samples are indicated on the graph. (*) The response to cfDNA differs from the control HSFs (p < 0.01). (C). c1—The most typical examples (for sz-HSF1,1h) of the BRCA1 assay with FCA in HSFs. c2—Index BRCA1: the values of the ratio m(FL-BRCA1)i/m(FL-BRCA1c). Average values for three measurements and standard deviation are given. c3—Analysis of relative changes in BRCA1 levels in the presence of DNA samples compared to control. c4—Changes in the BRCA1 levels in sample of HSFs (n = 10). c5—Dependence of NOX4 index on BRCA1 index. c6—sz-HSF2 and hc-HSFs4 staining with two types of antibodies with different labels: NOX4 (PC5.5) and BRCA1 (FITC). (D,E). Change of the RNA BRCA1 and RNA BRCA2 in the PBL in the presence of DNA samples. Average values for four lymphocyte samples and standard deviation are given.
Figure 8
Figure 8
The influence of the DNA samples (50 ng/mL) on the expression of BCL2 and BAX genes in HSFs and PBL. (A). a1a3—Change of the RNA BCL2, RNA BAX and the ratio RNA BAX/RNA BCL2 in HSFs. (*) The response to cfDNA differs from the control HSFs (p < 0.01). (B). b1b3—Change of the RNA BCL2, RNA BAX and the ratio RNA BAX/RNA BCL2 in PBL. (C). c1—The most typical examples of the BCL2 and BAX assay with FCA in lymphocytes. c2c4—Changes in the index BCL2, index BAX and the ratio BAX/BCL2 in the sample of lymphocytes (n = 4). (D). d1—The most typical example of the apoptosis assay in PBL. d2—Proportion of R2 (annexin V+) fraction cells.
Figure 9
Figure 9
Scheme describing the cell response to the action of cfDNA fragments. A photo from the previous article of a cell interacting with the sz-cfDNA is provided [29].

References

    1. Bronkhorst A.J., Ungerer V., Oberhofer A., Gabriel S., Polatoglou E., Randeu H., Uhlig C., Pfister H., Mayer Z., Holdenrieder S. New Perspectives on the Importance of Cell-Free DNA Biology. Diagnostics. 2022;2:2147. doi: 10.3390/diagnostics12092147. - DOI - PMC - PubMed
    1. Han D.S.C., Lo Y.M.D. The Nexus of cfDNA and Nuclease Biology. Trends Genet. 2021;37:758–770. doi: 10.1016/j.tig.2021.04.005. - DOI - PubMed
    1. Szilágyi M., Pös O., Márton É., Buglyó G., Soltész B., Keserű J., Penyige A., Szemes T., Nagy B. Circulating Cell-Free Nucleic Acids: Main Characteristics and Clinical Application. Int. J. Mol. Sci. 2020;21:6827. doi: 10.3390/ijms21186827. - DOI - PMC - PubMed
    1. Kustanovich A., Schwartz R., Peretz T., Grinshpun A. Life and death of circulating cell-free DNA. Cancer Biol. Ther. 2019;20:1057–1067. doi: 10.1080/15384047.2019.1598759. - DOI - PMC - PubMed
    1. Hu Z., Chen H., Long Y., Li P., Gu Y. The main sources of circulating cell-free DNA: Apoptosis, necrosis and active secretion. Crit. Rev. Oncol. Hematol. 2021;157:103166. doi: 10.1016/j.critrevonc.2020.103166. - DOI - PubMed

Publication types