. 2022 Dec 6;13(12):2300.
doi: 10.3390/genes13122300.

Pantothenate and L-Carnitine Supplementation Improves Pathological Alterations in Cellular Models of KAT6A Syndrome

Affiliations

Pantothenate and L-Carnitine Supplementation Improves Pathological Alterations in Cellular Models of KAT6A Syndrome

Manuel Munuera-Cabeza et al. Genes (Basel). .

Abstract

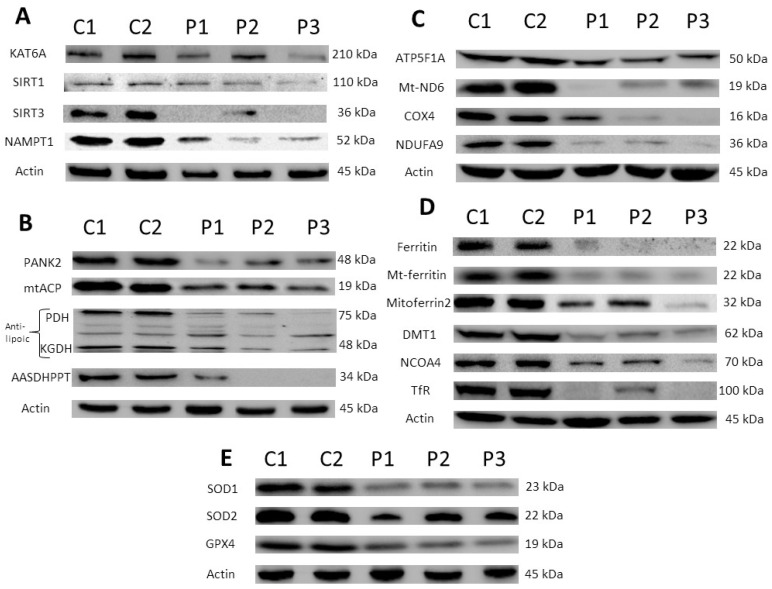
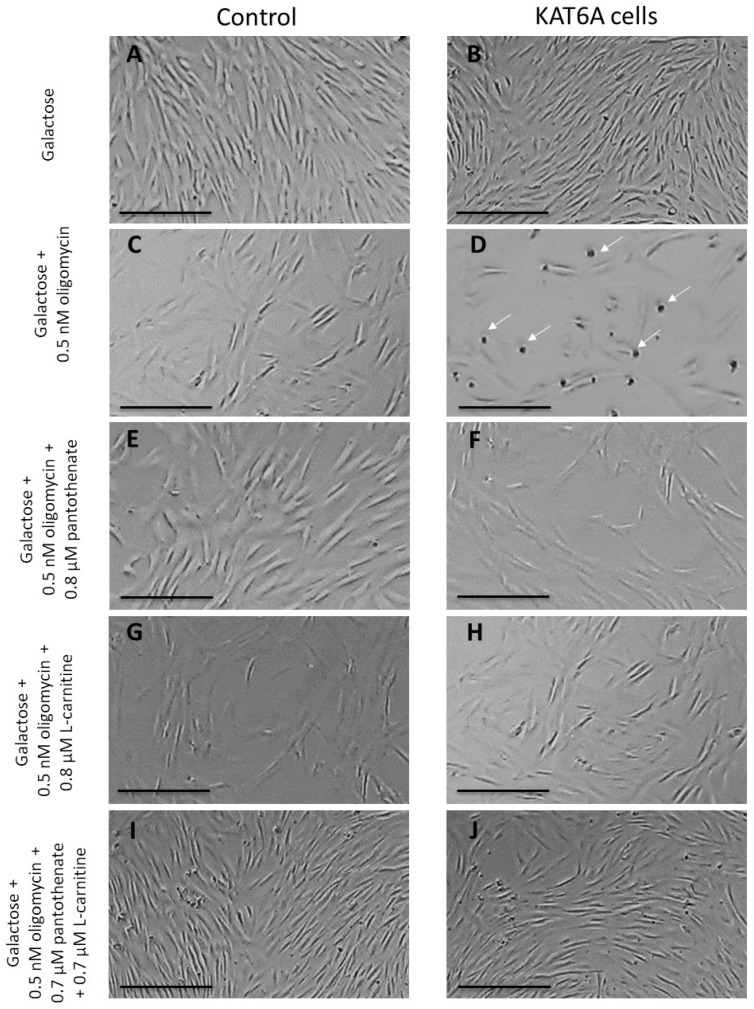
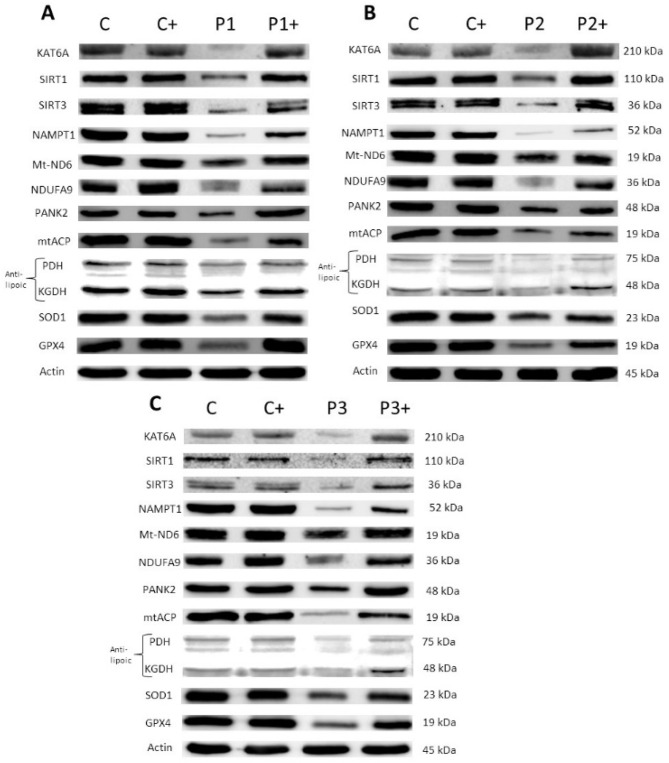
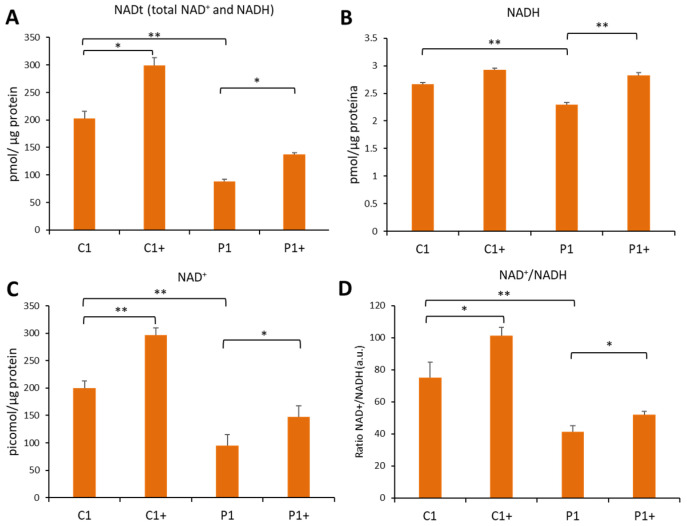
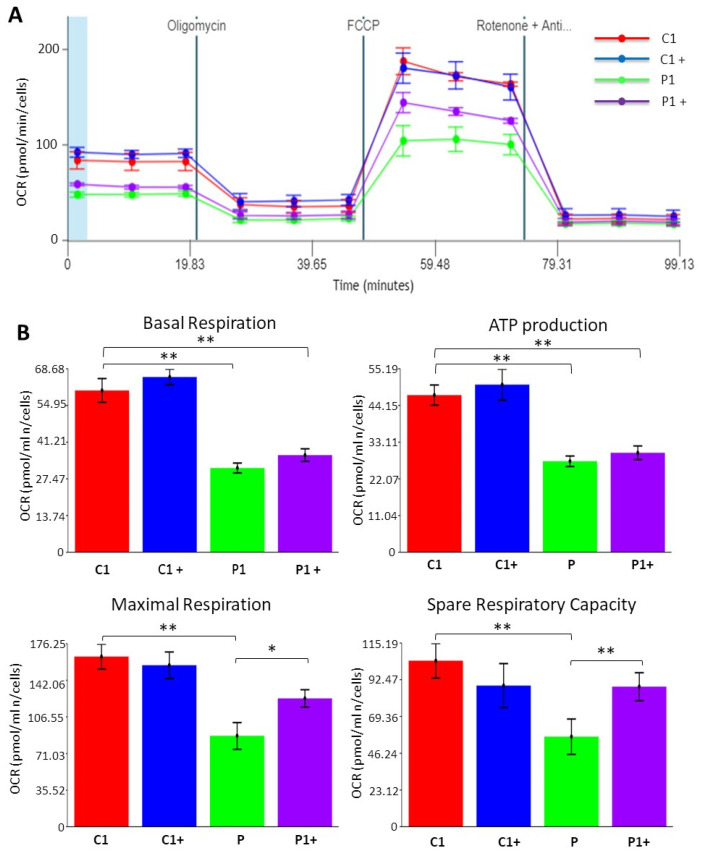
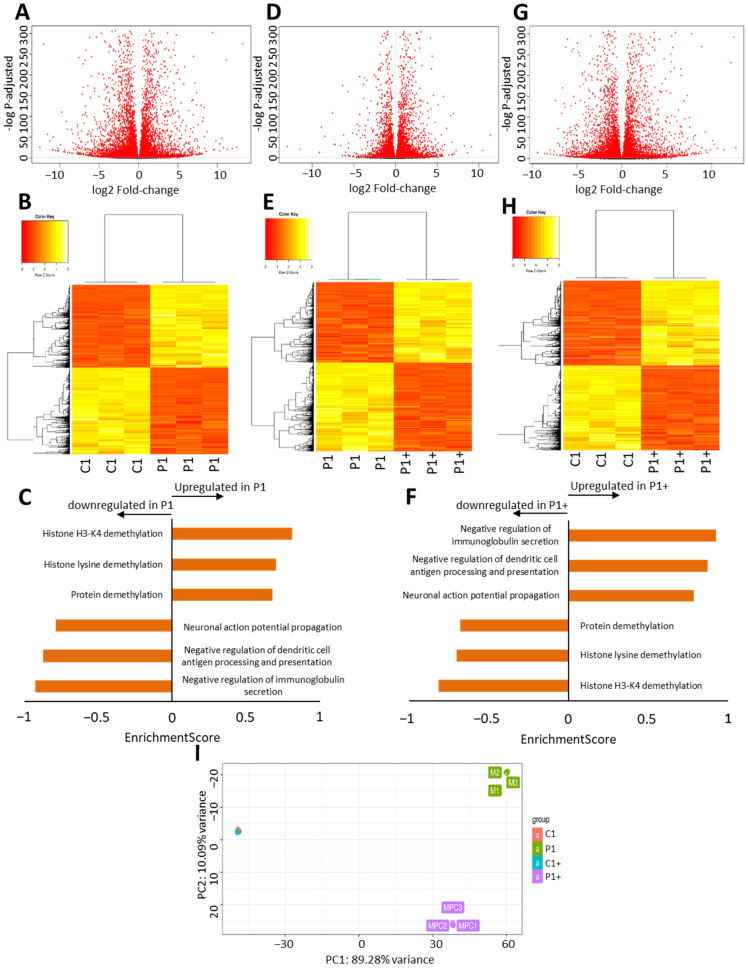
Mutations in several genes involved in the epigenetic regulation of gene expression have been considered risk alterations to different intellectual disability (ID) syndromes associated with features of autism spectrum disorder (ASD). Among them are the pathogenic variants of the lysine-acetyltransferase 6A (KAT6A) gene, which causes KAT6A syndrome. The KAT6A enzyme participates in a wide range of critical cellular functions, such as chromatin remodeling, gene expression, protein synthesis, cell metabolism, and replication. In this manuscript, we examined the pathophysiological alterations in fibroblasts derived from three patients harboring KAT6A mutations. We addressed survival in a stress medium, histone acetylation, protein expression patterns, and transcriptome analysis, as well as cell bioenergetics. In addition, we evaluated the therapeutic effectiveness of epigenetic modulators and mitochondrial boosting agents, such as pantothenate and L-carnitine, in correcting the mutant phenotype. Pantothenate and L-carnitine treatment increased histone acetylation and partially corrected protein and transcriptomic expression patterns in mutant KAT6A cells. Furthermore, the cell bioenergetics of mutant cells was significantly improved. Our results suggest that pantothenate and L-carnitine can significantly improve the mutant phenotype in cellular models of KAT6A syndrome.

Keywords: KAT6A syndrome; L-carnitine; histone acetylation; intellectual disability; lysine acetyltransferase 6 A; pantothenate.


Conflict of interest statement

The authors declare no conflict of interest.

Figures

Figure 1
Figure 1
Protein expression patterns in control and KAT6A mutant fibroblasts. Protein extracts of Control (C1 and C2) and patient (P1, P2 and P3) cell lines were separated on an SDS polyacrylamide gel and immunostained with primary antibodies. (A) Proteins related to acetylation-deacetylation reactions: KAT6A, SIRT1, SIRT3, and NAMPT1; (B) proteins related to CoA metabolism: PANK2, mtACP, lipoylated PDH, lipoylated KGDH, and AASDHPPT; (C) mitochondrial proteins: ATP Syntase, Mt-NAD6, COX4 subunit, and NDUFA9; (D) proteins related to iron metabolism: ferritin, Mt-ferritin, mitoferrin 2, DMT1; NCOA4, and TfR; (E) antioxidant enzymes. A representative actin lane is shown, although loading control was additionally checked for every Western blot. Data represent the mean ± SD of three separate experiments. Quantification of protein bands using densitometry is shown in Supplementary Figures S1 and S2.
Figure 2
Figure 2
Pantothenate and L-carnitine supplementation increases cell survival in stress medium. First, Control (C1) and mutant KAT6A fibroblasts (P1) were cultured in DMEM high glucose. After 3 days, the glucose medium was replaced by a galactose medium with 0.5 nM oligomycin. Images were acquired right after changing the medium and after 72 h of incubation. (A,B) Control and mutant KAT6A fibroblasts in glucose medium. (C,D) Control and mutant KAT6A fibroblasts in stress medium. (E,F) Control and mutant KAT6A fibroblasts (P1) treated with 0.8 µM pantothenate in stress medium. (G,H) Control and mutant KAT6A fibroblasts treated with 0.8 µM L-carnitine in stress medium. (I,J) Control and mutant KAT6A fibroblasts (P1) treated with 0.7 µM pantothenate and 0.7 µM L-carnitine in stress medium. Data represent the mean ± SD of three separate experiments. The quantification of cellular proliferation rate is shown in Supplementary Figures S4–S6. Scale bar = 200 μm. White arrows = dead cells.
Figure 3
Figure 3
Pantothenate and L-carnitine supplementation improves protein expression levels in mutant KAT6A fibroblasts. Control (C) and mutant P1 and P3 fibroblasts (P1 and P3) were treated with 0.7 µM pantothenate and 0.7 µM L-carnitine for 15 days (C+, P1+ and P3+), while Control (C) and P2 fibroblasts (P2) were treated with 0.4 µM pantothenate and 0.4 µM L-carnitine for 15 days (C+ and P2+). Immunoblotting analysis of cellular extracts from Control and P1 fibroblasts (A), P2 fibroblasts (B), and P3 fibroblasts (C). Protein extracts were separated on an SDS polyacrylamide gel (12.5%) and immunostained with antibodies against KAT6A protein, SIRT1, SIRT3, NAMPT1, Mt-ND6, NDUFA9, PANK2, mtACP, lipoic acid (lipoylated PDH and lipoylated KGDH), SOD1, GPX4, and actin. A representative actin band is shown, although loading control was additionally checked for every Western blot. Data represent the mean ± SD of three separate experiments. Protein band densitometry is shown in Supplementary Figures S7 and S8.
Figure 4
Figure 4
Pantothenate and L-carnitine treatment increases histone acetylation levels in KAT6A fibroblasts (P1). Control (C) and mutant P1 fibroblasts (P1) were treated with 0.7 µM pantothenate and 0.7 µM L-carnitine for 15 days (C+ and P1+). (A) Control and KAT6A fibroblasts were incubated with Mitotracker CMXRos FM 100 nM for 45 min, then they were fixed and immunostained with anti-H3K9/K14 and examined by fluorescence microscopy. Fifty cells per condition were analyzed. (B) Histone H3 total acetylation levels in P1 cellular pellets were assessed by the Histone H3 Total Acetylation Colorimetric Detection Fast Kit (Abcam, Hercules, CA, USA, ab115124) protocol. Data represent the mean ± SD of three separate experiments. Absorbance was measured using a POLARstar Omega plate reader (BMG Labtech, Offenburg, Germany). The mitotracker CMX-ROS and H3K9/K14 intensity assessment were performed using FIJI software, as shown in Supplementary Figure S9. * p-value < 0.05 and ** p-value < 0.01. Scale bar = 15 μm. C+ and P1+, treated control and P1 cell lines, respectively.
Figure 5
Figure 5
Pantothenate and L-carnitine supplementation increases cellular NAD+/NADH levels in KAT6A mutant fibroblasts (P1). Control (C) and KAT6A fibroblasts (P1) were treated for 15 days with 0.7 µM pantothenate and 0.7 µM L-carnitine (C+ and P1+). NAD+/NADH assay was performed using the NAD+/NADH Assay Kit. NADt (total NAD+ and NADH) (A) and NADH (B) were quantified as described in the Section 2. NAD+ was calculated by subtraction (NADt − NADH) (C) and NAD+/NADH ratio was calculated by the equation ((NADt − NADH)/NADH) (D). Data represent the mean ± SD of three separate experiments. * p-value < 0.05 and ** p-value < 0.01.
Figure 6
Figure 6
Pantothenate and L-carnitine supplementation improves cell bioenergetics of mutant KAT6A fibroblasts (P1). Control (C) and KAT6A fibroblasts (P1) were treated for 15 days with 0.7 µM pantothenate and 0.7 µM L-carnitine (C+ and P1+). (A) Mitochondrial respiration profile was measured with a Seahorse XFe24 analyzer. Fibroblasts were treated for 15 days with 0.7 µM pantothenate and 0.7 µM L-carnitine. (B) Basal respiration, ATP production, maximal respiration, and spare respiratory capacity were assessed by the Seahorse analytics website. * p-value < 0.05 and ** p-value < 0.01.
Figure 7
Figure 7
Pantothenate and L-carnitine supplementation modifies transcriptome of mutant KAT6A fibroblasts. Control (C) and KAT6A fibroblasts (P1) were treated for 15 days with 0.7 µM pantothenate and 0.7 µM L-carnitine (C+ and P1+). Volcano plot displays the relationship between fold-change and p-values (represented as −log p-adjusted, adj) on the differentiation between control and mutant KAT6A fibroblasts (A), mutant KAT6A and treated mutant KAT6A fibroblasts (D), and control and treated mutant KAT6A fibroblasts (G). Genes differentially expressed with P adj < 0.05 are highlighted in red. Heatmap of the relative expression of all differentially expressed genes in the control and mutant KAT6A fibroblasts (B), mutant KAT6A and treated mutant KAT6A fibroblasts (E), and control and treated mutant KAT6A fibroblasts (H). To better interpret RNAseq results, genes were annotated using a functional classification scheme, biological process ontology (BP), which covers gene functions. The results were the comparison between control and mutant KAT6A fibroblasts (C) and mutant KAT6A and treated mutant KAT6A fibroblasts (F). A PCA (principal component analysis) plot is shown to indicate transcriptomic level differences (I).

Similar articles

Cited by

References

    1. Kennedy J., Goudie D., Blair E., Chandler K., Joss S., McKay V., Green A., Armstrong R., Lees M., Kamien B., et al. KAT6A Syndrome: Genotype-phenotype correlation in 76 patients with pathogenic KAT6A variants. Genet. Med. 2019;21:850–860. doi: 10.1038/s41436-018-0259-2. - DOI - PMC - PubMed
    1. Lee H., Deignan J.L., Dorrani N., Strom S.P., Kantarci S., Quintero-Rivera F., Das K., Toy T., Harry B., Yourshaw M., et al. Clinical exome sequencing for genetic identification of rare Mendelian disorders. JAMA. 2014;312:1880–1887. doi: 10.1001/jama.2014.14604. - DOI - PMC - PubMed
    1. Arboleda V.A., Lee H., Dorrani N., Zadeh N., Willis M., Macmurdo C.F., Manning M.A., Kwan A., Hudgins L., Barthelemy F., et al. De novo nonsense mutations in KAT6A, a lysine acetyl-transferase gene, cause a syndrome including microcephaly and global developmental delay. Am. J. Hum. Genet. 2015;96:498–506. doi: 10.1016/j.ajhg.2015.01.017. - DOI - PMC - PubMed
    1. Tham E., Lindstrand A., Santani A., Malmgren H., Nesbitt A., Dubbs H.A., Zackai E.H., Parker M.J., Millan F., Rosenbaum K., et al. Dominant mutations in KAT6A cause intellectual disability with recognizable syndromic features. Am. J. Hum. Genet. 2015;96:507–513. doi: 10.1016/j.ajhg.2015.01.016. - DOI - PMC - PubMed
    1. Millan F., Cho M.T., Retterer K., Monaghan K.G., Bai R., Vitazka P., Everman D.B., Smith B., Angle B., Roberts V., et al. Whole exome sequencing reveals de novo pathogenic variants in KAT6A as a cause of a neurodevelopmental disorder. Am. J. Med. Genet. A. 2016;170:1791–1798. doi: 10.1002/ajmg.a.37670. - DOI - PubMed

Publication types