. 2022 Dec 7;13(12):2306.
doi: 10.3390/genes13122306.

Effects of N-Acetylcysteine on the Proliferation, Hormone Secretion Level, and Gene Expression Profiles of Goat Ovarian Granulosa Cells

Affiliations

Effects of N-Acetylcysteine on the Proliferation, Hormone Secretion Level, and Gene Expression Profiles of Goat Ovarian Granulosa Cells

Taotao Ji et al. Genes (Basel). .

Abstract

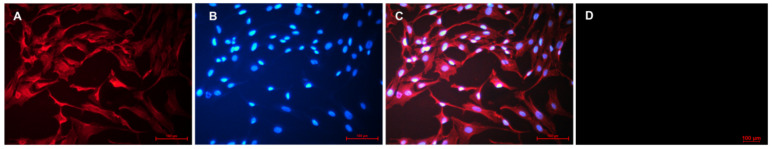
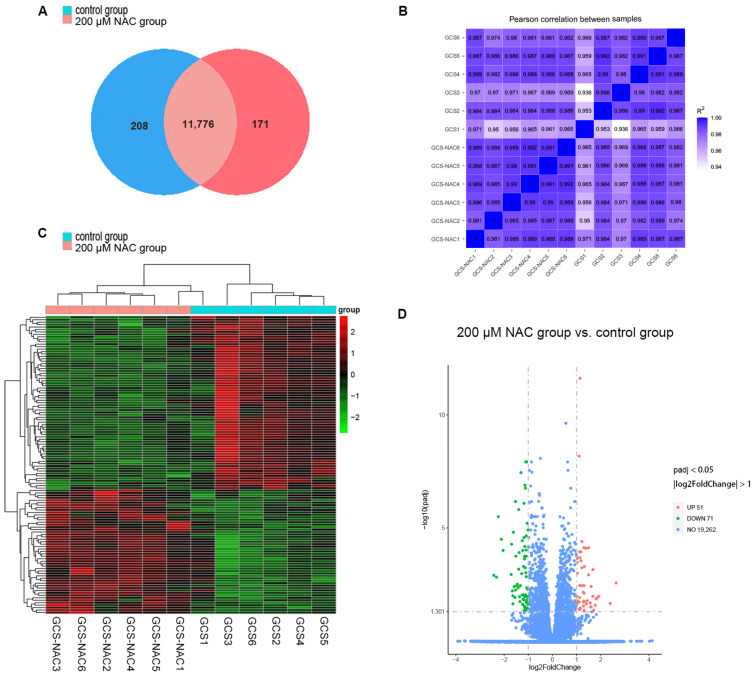
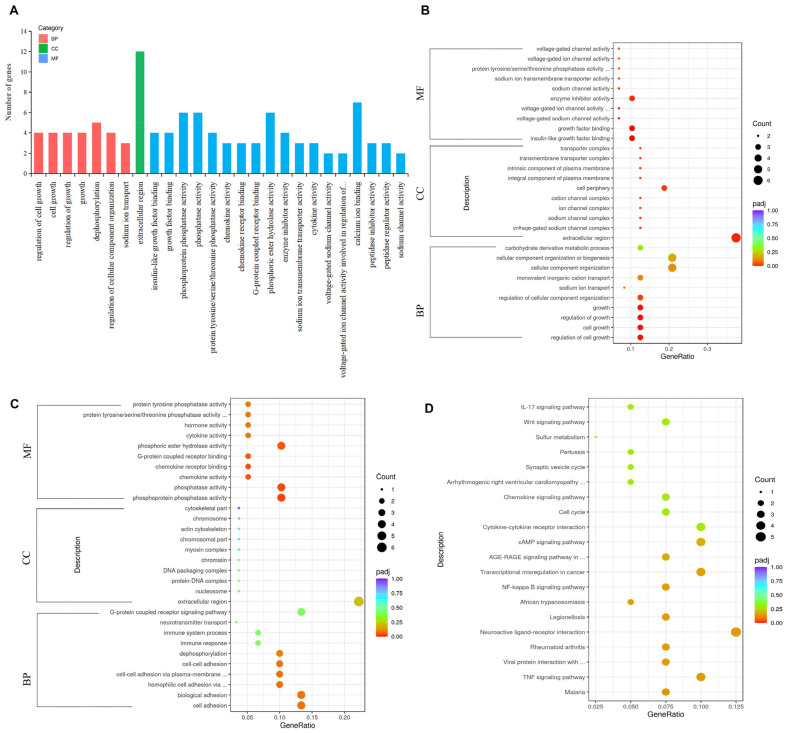
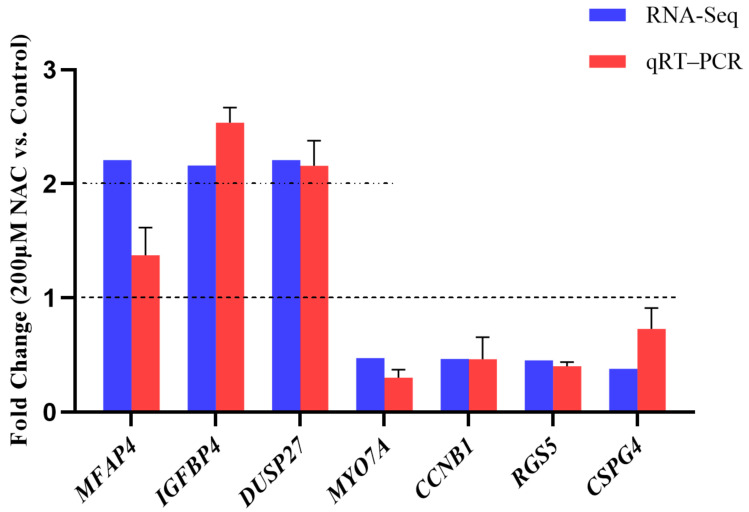
The purpose of this paper was to investigate the effects of N-acetylcysteine (NAC) on the proliferation, hormone secretion, and mRNA expression profiles of ovarian granulosa cells (GCs) in vitro. A total of 12 ovaries from 6 follicular-stage goats were collected for granulosa cell extraction. The optimum concentration of NAC addition was determined to be 200 μM via the Cell Counting Kit 8 (CCK-8) method. Next, GCs were cultured in a medium supplemented with 200 μM NAC (200 μM NAC group) and 0 μ M NAC (control group) for 48 h. The effects of 200 μM NAC on the proliferation of granulosa cells and hormones were studied by 5-ethynyl-2'-deoxyuridine (EdU) assay and enzyme-linked immunosorbent assay (ELISA). mRNA expression was analyzed by transcriptome sequencing. The results indicate that 200 μM NAC significantly increased cell viability and the proportion of cells in the S phase but promoted hormone secretion to a lesser degree. Overall, 122 differentially expressed genes (DEGs) were identified. A total of 51 upregulated and 71 downregulated genes were included. Gene Ontology (GO) and Kyoto Encyclopedia of Genes and Genomes (KEGG) enrichment analyses indicated that the most DEGs were enriched in terms of cell growth regulation, cell growth, neuroactive ligand-receptor interaction, cytokine-cytokine receptor interaction, the cAMP-signaling pathway, and the Wnt-signaling pathway. Seven genes related to granulosa cell proliferation were screened, IGFBP4, HTRA4, SST, SSTR1, WISP1, DAAM2, and RSPO2. The above results provide molecular theoretical support for NAC as a feed additive to improve follicle development and improve reproductive performance in ewes.

Keywords: N-acetylcysteine; RNA-seq; mRNA expression; ovarian granulosa cells.


Conflict of interest statement

The authors declare no conflict of interest.

Figures

Figure 1
Figure 1
Representative immunofluorescence images of fixed GCs. (A) GCs were stained with cy3 to visualize FSHR (shown in red). (B) DNA was stained with DAPI (shown in blue). (C) Merged image of (A) and (B). (D) Blank control without FSHR antibody staining. The fluorescence in the cells in the same field was observed under a fluorescence inverted microscope under ultraviolet and green excitation light and camera. N = 3.
Figure 2
Figure 2
Regulation of NAC on the growth of granulosa cells. (A) Effect of different concentrations of NAC on cell proliferation. (B) Cell proliferation of 200 μM NAC and control groups was detected by EdU assay at 48 h. EdU: The thymidine analog EdU in the kit replaces thymidine and infiltrates the newly synthesized DNA in the S-phase of the cell cycle. After the Click reaction, the newly synthesized DNA was labeled with red fluorescence. Hoechst: Hoechst 33342, Hoechst coloration presented light blue, round morphous, and formed fairly dark particles inside normal cell nuclei; Merge: Superimposing and merging the red fluorescence and blue fluorescence images in the same field of view. Histogram of cell proliferation ratio: The proportion of cell proliferation in the 200 μM group was significantly higher than that in the control group. * Indicates a significant difference between the two groups at the 0.05 level. (C) Estradiol levels. Estrogen contents in the culture medium of the 200 μM NAC group and control group were detected at 0 h and 48 h, respectively, n = 3. (D) Progesterone levels. Progesterone contents in the culture medium of the 200 μM NAC group and control group were detected at 0 h and 48 h, respectively, n = 3. * Indicates a significant difference between the two groups at the 0.05 level. ** Indicates a significant difference between the two groups at the 0.01 level.
Figure 3
Figure 3
Analysis of gene expression. (A) Venn diagram of gene expression. (B) Pearson correlation between samples. (C) Heat map of the DEGs cluster analysis. Columns represent samples, and different rows represent genes. (D) Volcano plot of DEGs (|log2(FoldChange)| ≥ 1 and padj < 0.05). Up, upregulated DEGs; Down, downregulated DEGs. GCS-NAC1, GCS-NAC2, GCS-NAC3, GCS-NAC4, GCS-NAC5, and GCS-NAC6 are representative of the 200 μM NAC group. GCS1, GCS2, GCS3, GCS4, GCS5, and GCS6 are representative of the control group.
Figure 4
Figure 4
GO and KEGG enrichment analyses of DEGs of GCs between the 200 μM NAC group and control group. (A) Statistics of GO enrichment. Histogram plots were generated with all differential significance terms. The abscissa is the GO term, and the ordinate is the number of genes enriched by the GO term. (B) Dot plot of upregulated gene-enriched GO terms. (C) Dot plot of downregulated gene-enriched GO terms. (D) Dot plot of top 20 KEGG pathways. The size of the dots represents the number of genes annotated onto GO terms and the KEGG pathways, and the colors from red to purple represent the significant size of enrichment.
Figure 5
Figure 5
Relative abundance of 7 DEGs. RNA-Seq: Gene expression abundance obtained from transcriptome sequencing data, expressed as fold change. When the value corresponding to a gene is greater than 2, the gene is significantly expressed in the 200 μM NAC group. If it is greater than 0 but less than 1, it is expressed significantly in the control group. qRT-PCR: Gene expression abundance by qRT-PCR. 2−ΔΔCt was taken as the fold change. When the value corresponding to a gene is greater than 1, the gene is significantly expressed in the 200 μM NAC group. N = 3.
Figure 6
Figure 6
Regulation of RSPO2 gene on GCs. (A) RSPO2 overexpression efficiency validation. (B) Expression abundance of related genes. * Shows that there is a significant difference at the 0.05 level among groups, ** Indicates a significant difference at the 0.01 level. The genes to be tested were normalized using housekeeping genes, the relative expression abundance was expressed as 2−ΔΔCt, and the results are shown as means ± SD (N = 3).

Similar articles

Cited by

References

    1. Wu W., Goldstein G., Adams C., Matthews R.H., Ercal N. Separation and quantification of N-acetyl-l-cysteine and N-acetyl-cysteine-amide by HPLC with fluorescence detection. Biomed. Chromatogr. 2006;20:415–422. doi: 10.1002/bmc.583. - DOI - PubMed
    1. Slattery J., Kumar N., Delhey L., Berk M., Dean O., Spielholz C., Frye R. Clinical trials of N-acetylcysteine in psychiatry and neurology: A systematic review. Neurosci. Biobehav. Rev. 2015;55:294–321. doi: 10.1016/j.neubiorev.2015.04.015. - DOI - PubMed
    1. Whitaker B.D., Knight J.W. Effects of N-acetyl-cysteine and N-acetyl-cysteine-amide supplementation on in vitro matured porcine oocytes. Reprod. Domest. Anim. 2010;45:755–759. doi: 10.1111/j.1439-0531.2009.01344.x. - DOI - PubMed
    1. Ding H., Yang Y., Wei S., Spicer L.J., Kenéz Á., Xu W., Liu Y., Feng T. Influence of N-acetylcysteine on steroidogenesis and gene expression in porcine placental trophoblast cells. Theriogenology. 2021;161:49–56. doi: 10.1016/j.theriogenology.2020.11.005. - DOI - PubMed
    1. Liu J., Liu M., Ye X., Liu K., Huang J., Wang L., Ji G., Liu N., Tang X., Baltz J.M., et al. Delay in oocyte aging in mice by the antioxidant N-acetyl-L-cysteine (NAC) Hum. Reprod. 2012;27:1411–1420. doi: 10.1093/humrep/des019. - DOI - PubMed

Publication types