

Significance of Identifying Key Genes Involved in HBV-Related Hepatocellular Carcinoma for Primary Care Surveillance of Patients with Cirrhosis
- PMID: 36553600
- PMCID: PMC9778294
- DOI: 10.3390/genes13122331
Significance of Identifying Key Genes Involved in HBV-Related Hepatocellular Carcinoma for Primary Care Surveillance of Patients with Cirrhosis
Abstract
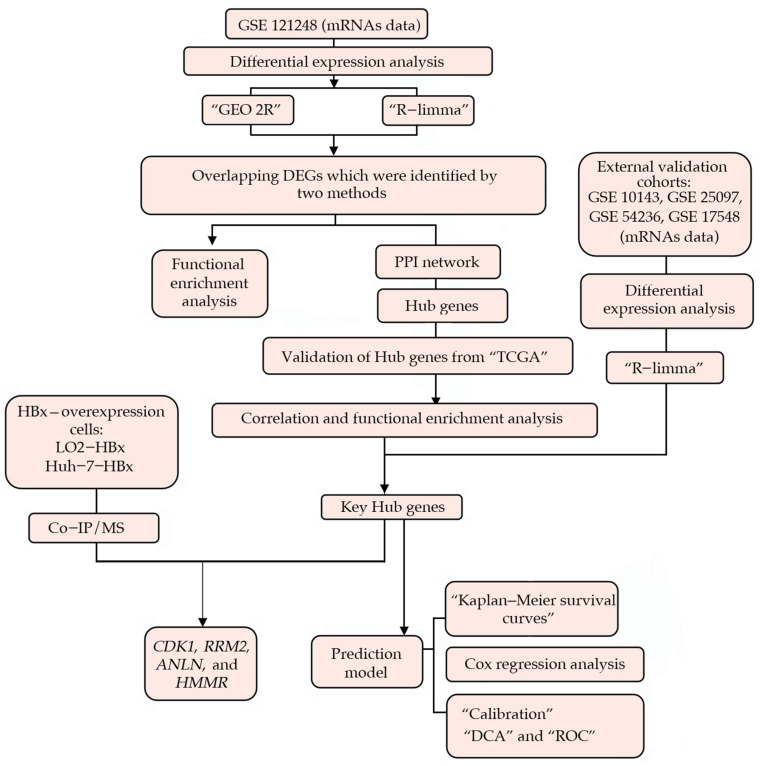
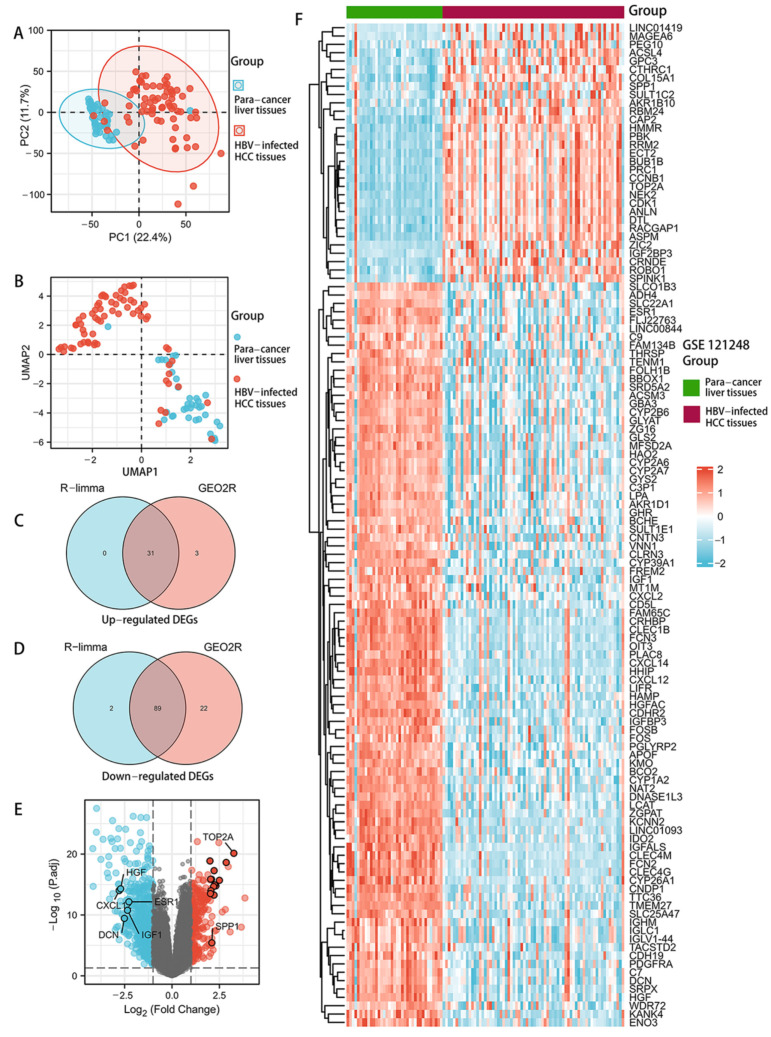
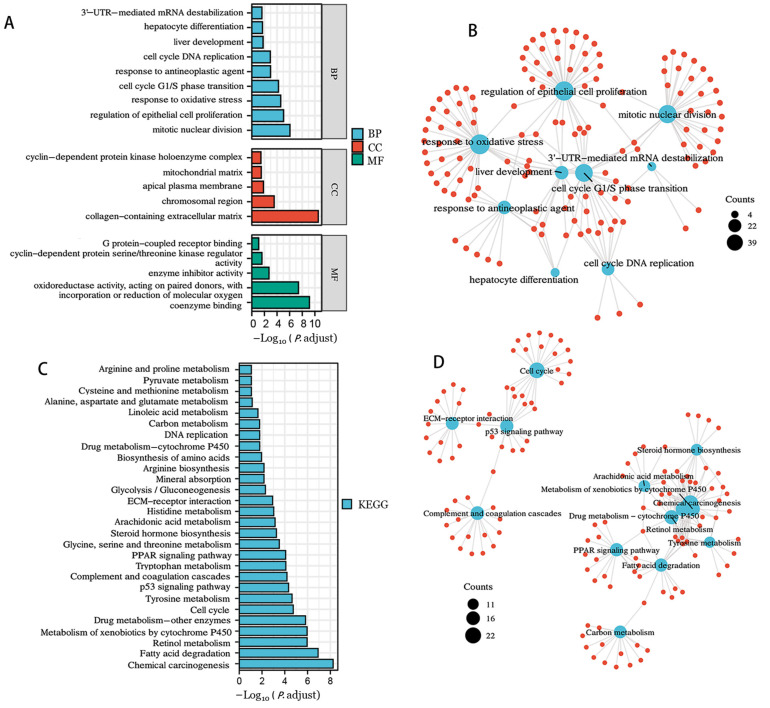
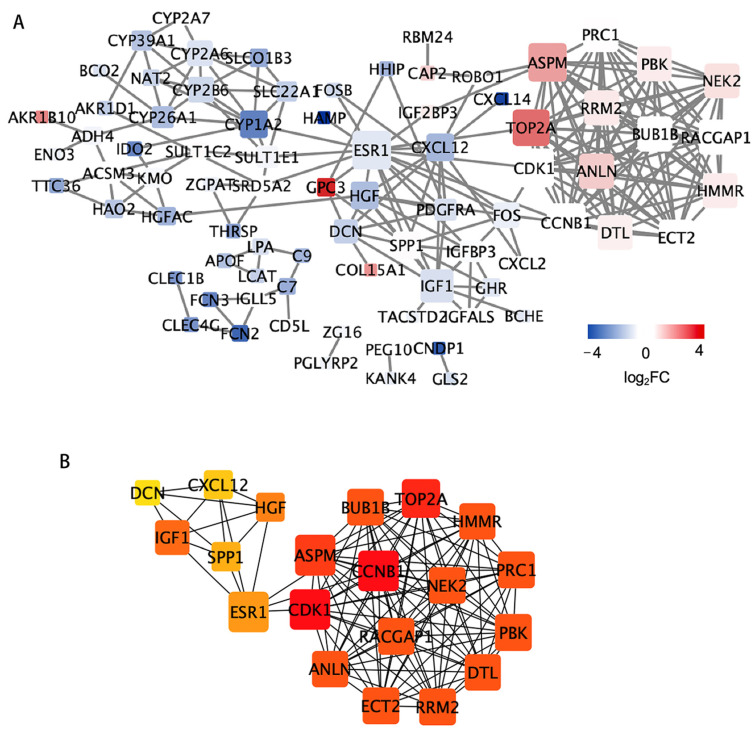
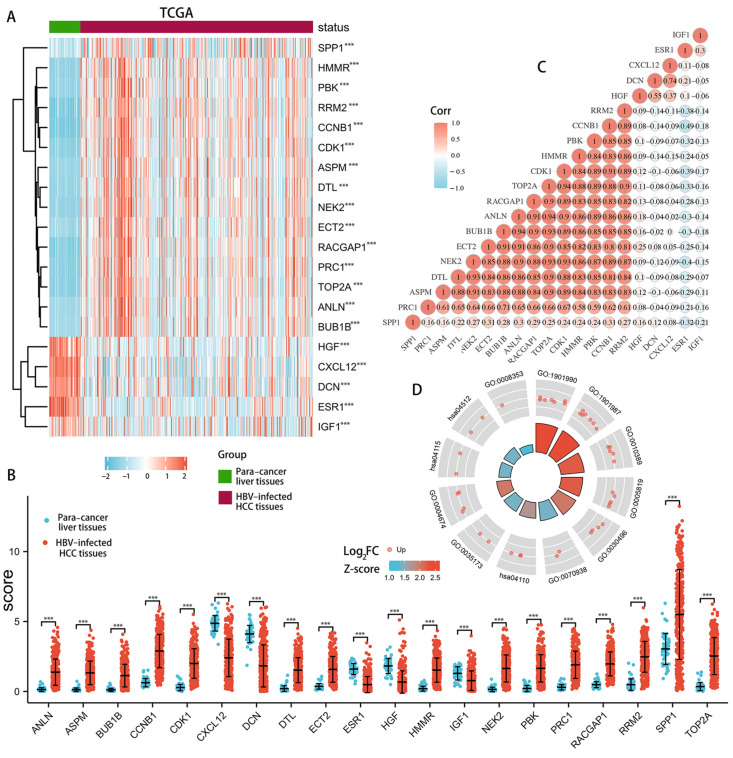
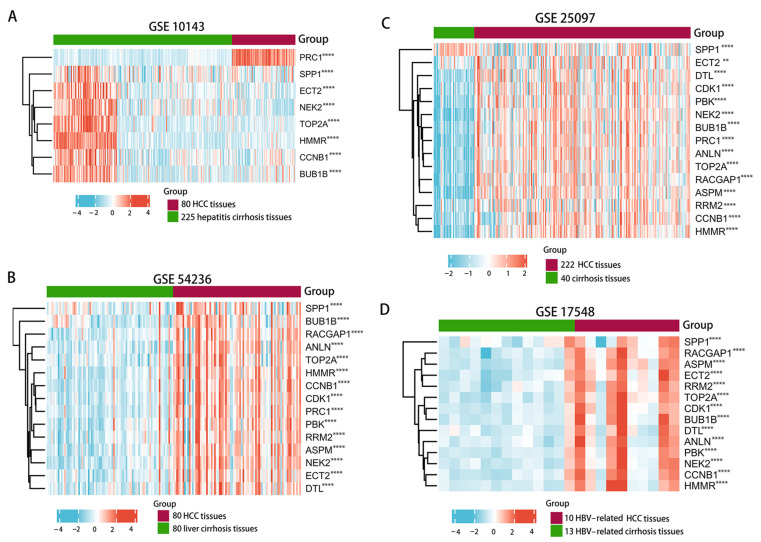
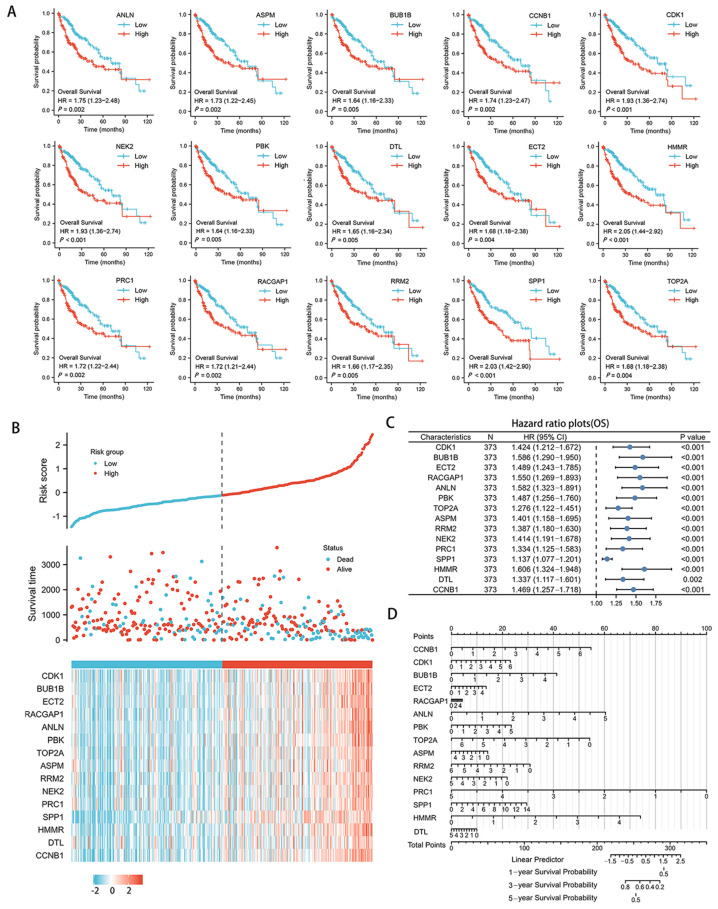
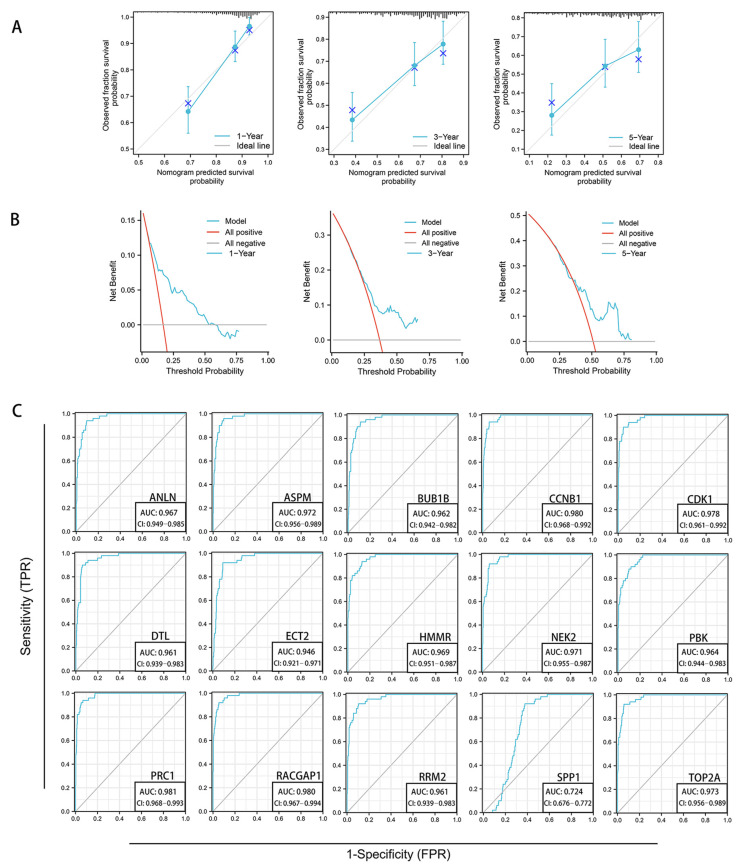
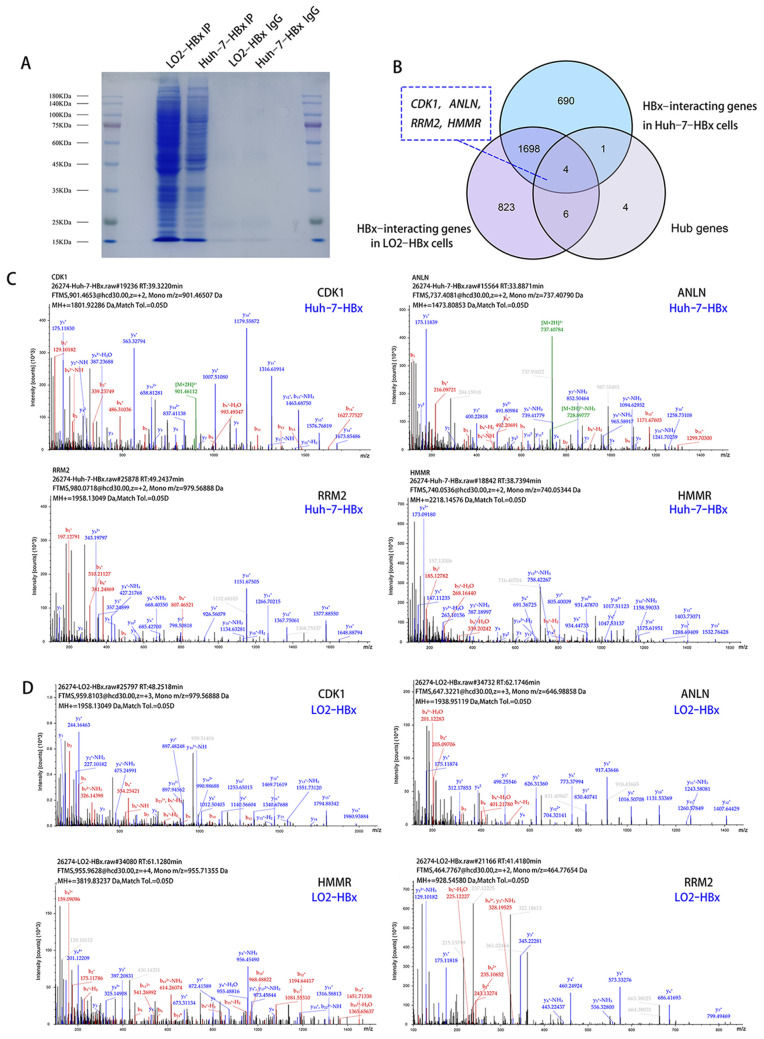
Cirrhosis is frequently the final stage of disease preceding the development of hepatocellular carcinoma (HCC) and is one of the risk factors for HCC. Preventive surveillance for early HCC in patients with cirrhosis is advantageous for achieving early HCC prevention and diagnosis, thereby enhancing patient prognosis and reducing mortality. However, there is no highly sensitive diagnostic marker for the clinical surveillance of HCC in patients with cirrhosis, which significantly restricts its use in primary care for HCC. To increase the accuracy of illness diagnosis, the study of the effective and sensitive genetic biomarkers involved in HCC incidence is crucial. In this study, a set of 120 significantly differentially expressed genes (DEGs) was identified in the GSE121248 dataset. A protein-protein interaction (PPI) network was constructed among the DEGs, and Cytoscape was used to extract hub genes from the network. In TCGA database, the expression levels, correlation analysis, and predictive performance of hub genes were validated. In total, 15 hub genes showed increased expression, and their positive correlation ranged from 0.80 to 0.90, suggesting they may be involved in the same signaling pathway governing HBV-related HCC. The GSE10143, GSE25097, GSE54236, and GSE17548 datasets were used to investigate the expression pattern of these hub genes in the progression from cirrhosis to HCC. Using Cox regression analysis, a prediction model was then developed. The ROC curves, DCA, and calibration analysis demonstrated the superior disease prediction accuracy of this model. In addition, using proteomic analysis, we investigated whether these key hub genes interact with the HBV-encoded oncogene X protein (HBx), the oncogenic protein in HCC. We constructed stable HBx-expressing LO2-HBx and Huh-7-HBx cell lines. Co-immunoprecipitation coupled with mass spectrometry (Co-IP/MS) results demonstrated that CDK1, RRM2, ANLN, and HMMR interacted specifically with HBx in both cell models. Importantly, we investigated 15 potential key genes (CCNB1, CDK1, BUB1B, ECT2, RACGAP1, ANLN, PBK, TOP2A, ASPM, RRM2, NEK2, PRC1, SPP1, HMMR, and DTL) participating in the transformation process of HBV infection to HCC, of which 4 hub genes (CDK1, RRM2, ANLN, and HMMR) probably serve as potential oncogenic HBx downstream target molecules. All these findings of our study provided valuable research direction for the diagnostic gene detection of HBV-related HCC in primary care surveillance for HCC in patients with cirrhosis.
Keywords: HBV-encoded oncogene X protein (HBx); bioinformatic analysis; co-immunoprecipitation/mass spectrometry (CO-IP/MS); hepatitis B virus (HBV); hepatocellular carcinoma (HCC).
Conflict of interest statement
The authors declare no conflict of interest.
Figures
Similar articles
-
Screening Hub Genes as Prognostic Biomarkers of Hepatocellular Carcinoma by Bioinformatics Analysis.Cell Transplant. 2019 Dec;28(1_suppl):76S-86S. doi: 10.1177/0963689719893950. Epub 2019 Dec 11. Cell Transplant. 2019. PMID: 31822116 Free PMC article.
-
Identification of genes predicting unfavorable prognosis in hepatitis B virus-associated hepatocellular carcinoma.Ann Transl Med. 2021 Jun;9(12):975. doi: 10.21037/atm-21-2085. Ann Transl Med. 2021. PMID: 34277775 Free PMC article.
-
Unveiling novel prognostic biomarkers and therapeutic targets for HBV-associated hepatocellular carcinoma through integrated bioinformatic analysis.Medicine (Baltimore). 2024 Oct 25;103(43):e40134. doi: 10.1097/MD.0000000000040134. Medicine (Baltimore). 2024. PMID: 39470543 Free PMC article.
-
Molecular mechanistic insight of hepatitis B virus mediated hepatocellular carcinoma.Microb Pathog. 2019 Mar;128:184-194. doi: 10.1016/j.micpath.2019.01.004. Epub 2019 Jan 3. Microb Pathog. 2019. PMID: 30611768 Review.
-
Hepatitis B virus, HBx mutants and their role in hepatocellular carcinoma.World J Gastroenterol. 2014 Aug 14;20(30):10238-48. doi: 10.3748/wjg.v20.i30.10238. World J Gastroenterol. 2014. PMID: 25132741 Free PMC article. Review.
Cited by
-
HBx promotes tumorigenicity through RRM2-mediated autophagy in hepatocellular carcinoma.Cell Biosci. 2024 Sep 10;14(1):116. doi: 10.1186/s13578-024-01298-2. Cell Biosci. 2024. PMID: 39256879 Free PMC article.
-
Role of Epigenetic Factors in Determining the Biological Behavior and Prognosis of Hepatocellular Carcinoma.Diagnostics (Basel). 2024 Aug 31;14(17):1925. doi: 10.3390/diagnostics14171925. Diagnostics (Basel). 2024. PMID: 39272711 Free PMC article.
-
Identification and verification of novel immune-related ferroptosis signature with excellent prognostic predictive and clinical guidance value in hepatocellular carcinoma.Front Genet. 2023 Aug 21;14:1112744. doi: 10.3389/fgene.2023.1112744. eCollection 2023. Front Genet. 2023. PMID: 37671041 Free PMC article.
-
A systematic study on the treatment of hepatitis B-related hepatocellular carcinoma with drugs based on bioinformatics and key target reverse network pharmacology and experimental verification.Infect Agent Cancer. 2023 Jul 1;18(1):41. doi: 10.1186/s13027-023-00520-z. Infect Agent Cancer. 2023. PMID: 37393234 Free PMC article.
-
Identification of hub genes and pathways in hepatitis B virus-associated hepatocellular carcinoma: A comprehensive in silico study.Health Sci Rep. 2024 Jun 17;7(6):e2185. doi: 10.1002/hsr2.2185. eCollection 2024 Jun. Health Sci Rep. 2024. PMID: 38895552 Free PMC article.
References
-
- Jiang C.H., Yuan X., Li J.F., Xie Y.F., Zhang A.Z., Wang X.L., Yang L., Liu C.X., Liang W.H., Pang L.J., et al. Bioinformatics-based screening of key genes for transformation of liver cirrhosis to hepatocellular carcinoma. J. Transl. Med. 2020;18:40. doi: 10.1186/s12967-020-02229-8. - DOI - PMC - PubMed
Publication types
MeSH terms
LinkOut - more resources
Full Text Sources
Medical
Research Materials
Miscellaneous
