. 2022 Dec 11;13(12):2337.
doi: 10.3390/genes13122337.

Influence of Melatonin Treatment on Cellular Mechanisms of Redox Adaptation in K562 Erythroleukemic Cells

Affiliations

Influence of Melatonin Treatment on Cellular Mechanisms of Redox Adaptation in K562 Erythroleukemic Cells

Flaviene Felix Torres et al. Genes (Basel). .

Abstract

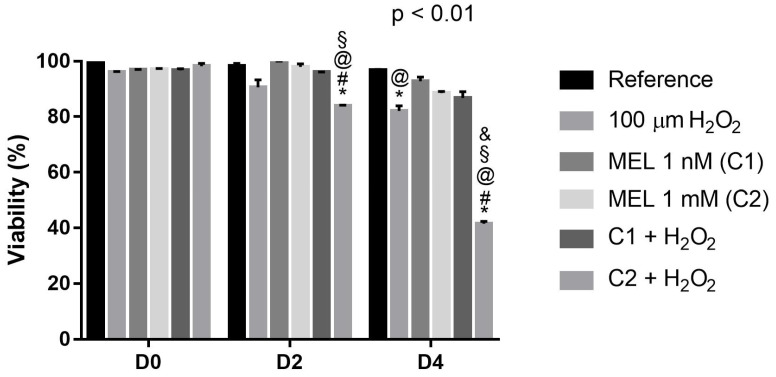
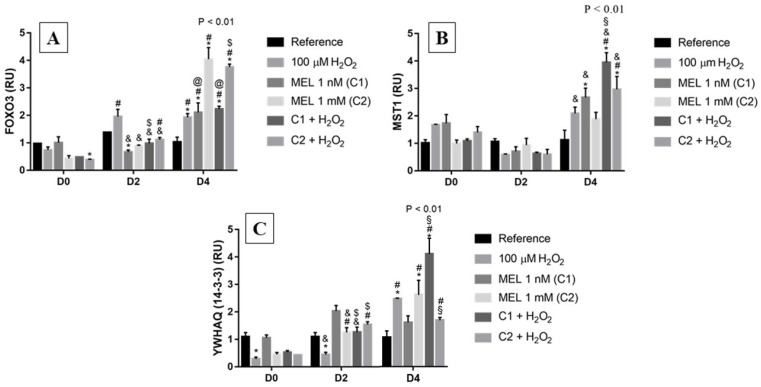
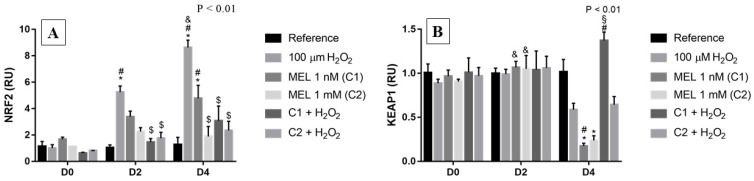
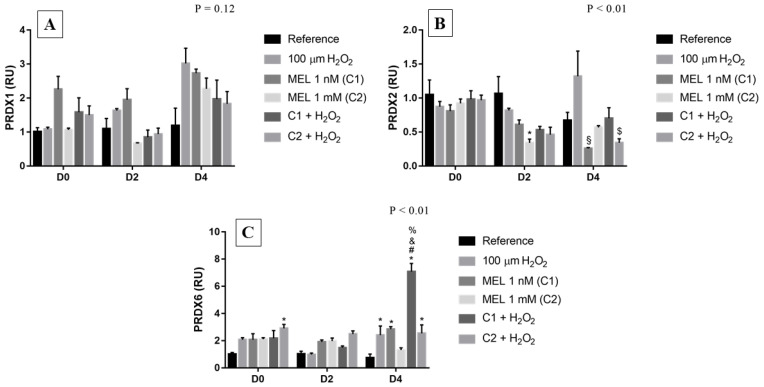
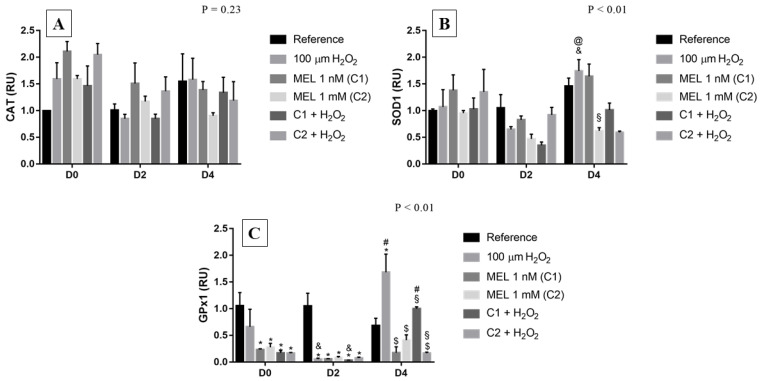
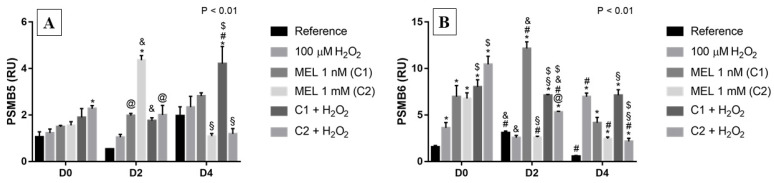
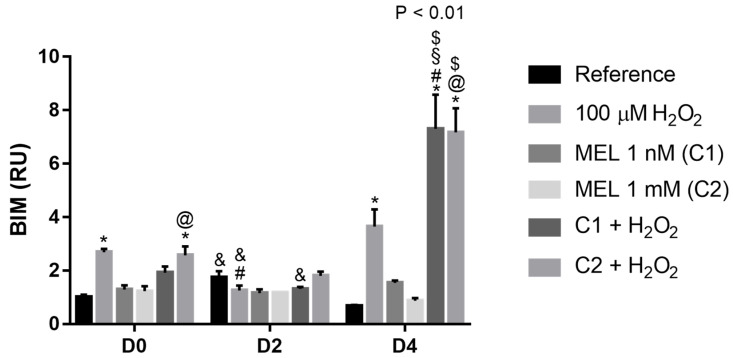
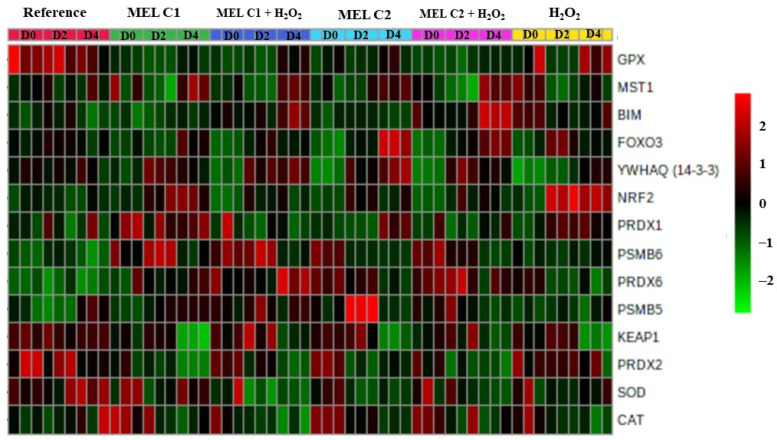
Melatonin (MEL) presents well-documented pleiotropic actions against oxidative stress (OS), acting indirectly through activation of transcription factors, e.g., FoxO3 and Nrf2. Thus, this study aimed to investigate the possible modulating effects of MEL on the redox signaling pathways PI3K/AKT/FoxO3 and Keap1/Nrf2/ARE in K562 erythroleukemic cells subjected to OS induction. For this, the viability, and transcript levels of genes involved in redox adaptation were evaluated in K562 cells in different periods of erythroid differentiation: under OS induction by hydrogen peroxide (100 µM H2O2); treated with 1 nM (C1) and 1 mM (C2) MEL; and associated or not with stress induction. We observed a restoration of physiological levels of Nrf2 in both MEL concentrations under OS. The C1 was related to enhanced expression of antioxidant and proteasome genes through the Nrf2-ARE pathway, while C2 to the induction of FOXO3 expression, suggesting an involvement with apoptotic pathway, according to BIM transcript levels. The effects of MEL administration in these cells showed a period and dose-dependent pattern against induced-OS, with direct and indirect actions through different pathways of cellular adaptation, reinforcing the importance of this indolamine in the regulation of cellular homeostasis, being a promising therapeutic alternative for diseases that present an exacerbated OS.

Keywords: FoxO3; N-[2-(5-methoxy-1H-indol-3-yl)ethyl]; Nrf2; antioxidant therapy.


Conflict of interest statement

The authors declare no conflict of interest.

Figures

Figure 1
Figure 1
Viability of K562 cells followed for 5 days of culture with and without induction of oxidative stress by 100 μM of H2O2. Reference: K562 cells without induction of oxidative stress and not treated with melatonin; 100 µM H2O2: Cells under stress induction with hydrogen peroxide; C1: cells treated with 1 nM melatonin; C2: cells treated with 1 mM melatonin; C1 + 100µM H2O2 and C2 + 100 µM H2O2: sets of cells treated with the same melatonin concentrations associated with stress induction; D0: before the differentiation, D2: beginning of cell differentiation; D4: maximum of the differentiation process. * Effects of treatments within each period compared to the respective reference groups; # Effect of the incubation period within each treatment compared to their counterparts in D0; & Effect of the incubation period between D2 and D4 within the same treatment; § Effect of C1 + 100 µM H2O2 compared to treatment C2 + 100 µM H2O2 within the same period; @ Effect of C2 compared to other treatments within the same period. Test performed: GLM with 2-way ANOVA design, complemented by Bonferroni test.
Figure 2
Figure 2
Relative expression of the FOXO3 pathway in K562 erythroid cells: (A) FOXO3 gene expression, (B) MST1 gene expression, and (C) YWHAQ (14-3-3) gene expression. Reference: K562 cells without induction of oxidative stress and not treated with melatonin; 100 µM H2O2: Cells under stress induction with hydrogen peroxide; C1: cells treated with 1 nM melatonin; C2: cells treated with 1 mM melatonin; C1 + 100 µM H2O2 and C2 + 100 µM H2O2: sets of cells treated with the same melatonin concentrations associated with stress induction; D0: before the differentiation, D2: beginning of cell differentiation; D4: maximum of the differentiation process. * Effects of treatments within each period compared to the respective reference groups; # Effect of the incubation period within each treatment compared to their counterparts in D0; & Effect of the incubation period between D2 and D4 within the same treatment; § Effect of C1 compared to other treatments within the same period; @ Effect of C2 compared to other treatments within the same period; $ Effect of melatonin when compared to 100 µM H2O2. Test performed: GLM with 2-way ANOVA design, complemented by Bonferroni test.
Figure 3
Figure 3
Relative expression of NRF2 and of its regulator KEAP1 in K562 erythroid cells: (A) NRF2 gene expression and (B) KEAP1 gene expression. Reference: K562 cells without induction of oxidative stress and not treated with melatonin; 100 µM H2O2: Cells under stress induction with hydrogen peroxide; C1: cells treated with 1 nM melatonin; C2: cells treated with 1 mM melatonin; C1 + 100 µM H2O2 and C2 + 100 µM H2O2: sets of cells treated with the same melatonin concentrations associated with stress induction; D0: before the differentiation, D2: beginning of cell differentiation; D4: maximum of the differentiation process. * Effects of treatments within each period compared to the respective reference groups; # Effect of the incubation period within each treatment compared to their counterparts in D0; & Effect of the incubation period between D2 and D4 within the same treatment; § Effect of C1 compared to other treatments within the same period; $ Protective effect of melatonin. Test performed: GLM with 2-way ANOVA design, complemented by Bonferroni test.
Figure 4
Figure 4
Relative expression of PRDXs in K562 erythroid cells: (A) Peroxiredoxin 1 (PRDX1) gene expression, (B) Peroxiredoxin 2 (PRDX2) gene expression, and (C) Peroxiredoxin 6 (PRDX6) gene expression. Reference: K562 cells without induction of oxidative stress and not treated with melatonin; 100 µM H2O2: Cells under stress induction with hydrogen peroxide; C1: cells treated with 1 nM melatonin; C2: cells treated with 1 mM melatonin; C1 + 100 µM H2O2 and C2 + 100 µM H2O2: sets of cells treated with the same melatonin concentrations associated with stress induction; D0: before the differentiation, D2: beginning of cell differentiation; D4: maximum of the differentiation process. * Effects of treatments within each period compared to the respective reference groups; # Effect of the incubation period within each treatment compared to their counterparts in D0; & Effect of the incubation period between D2 and D4 within the same treatment; § Effect of C1 compared to peroxide treatment within the same period; $ Effect of melatonin; % Effect of treatment within the same period; Test performed: GLM with 2-way ANOVA design, complemented by Bonferroni test.
Figure 5
Figure 5
Relative expression of CAT, SOD1, and GPx1 in K562 erythroid cells: (A) CAT gene expression, (B) SOD1 gene expression, and (C) GPx1 gene expression. Reference: K562 cells without induction of oxidative stress and not treated with melatonin; 100 µM H2O2: Cells under stress induction with hydrogen peroxide; C1: cells treated with 1 nM melatonin; C2: cells treated with 1 mM melatonin; C1 + 100 µM H2O2 and C2 + 100 µM H2O2: sets of cells treated with the same melatonin concentrations associated with stress induction; D0: before the differentiation, D2: beginning of cell differentiation; D4: maximum of the differentiation process. * Effects of treatments within each period compared to the respective reference groups; # Effect of the incubation period within each treatment compared to their counterparts in D0; & Effect of the incubation period between D2 and D4 within the same treatment; § Effect of C1 compared to other treatments within the same period; @ Effect of C2 compared to other treatments within the same period; $ Effect of melatonin; Test performed: GLM with 2-way ANOVA design, complemented by Bonferroni test.
Figure 6
Figure 6
Relative expression of proteasome subunits PSMB5 and PSMB6 in K562 erythroid cells: (A) PSMB5 gene expression and (B) PSMB6 gene expression. Reference: K562 cells without induction of oxidative stress and not treated with melatonin; 100 µM H2O2: Cells under stress induction with hydrogen peroxide; C1: cells treated with 1 nM melatonin; C2: cells treated with 1 mM melatonin; C1 + 100 µM H2O2 and C2 + 100 µM H2O2: sets of cells treated with the same melatonin concentrations associated with stress induction; D0: before the differentiation, D2: beginning of cell differentiation; D4: maximum of the differentiation process. * Effects of treatments within each period compared to the respective reference groups; # Effect of the incubation period within each treatment compared to their counterparts in D0; & Effect of the incubation period between D2 and D4 within the same treatment; § Effect of C1 compared to other treatments within the same period; @ Effect of C2 compared to other treatments within the same period; $ Effect of melatonin when compared to 100 µM H2O2. Test performed: GLM with 2-way ANOVA design, complemented by Bonferroni test.
Figure 7
Figure 7
Relative expression of BIM in K562 erythroid cells. Reference: K562 cells without induction of oxidative stress and not treated with melatonin; 100 µM H2O2: Cells under stress induction with hydrogen peroxide; C1: cells treated with 1 nM melatonin; C2: cells treated with 1 mM melatonin; C1 + 100 µM H2O2 and C2 + 100 µM H2O2: sets of cells treated with the same melatonin concentrations associated with stress induction; D0: before the differentiation, D2: beginning of cell differentiation; D4: maximum of the differentiation process. * Effects of treatments within each period compared to the respective reference groups; # Effect of the incubation period within each treatment compared to their counterparts in D0; & Effect of the incubation period between D2 and D4 within the same treatment; § Effect of C1 compared to other treatments within the same period; @ Effect of C2 compared to other treatments within the same period; $ Effect of melatonin when compared to 100 µM H2O2. Test performed: GLM with 2-way ANOVA design, complemented by Bonferroni test.
Figure 8
Figure 8
Overview of the expression pattern of the genes involved in the redox adaptation mechanisms in K562 cells. Genes are clustered hierarchically (full clustering method) using Euclidean correlation as the distance metric, with colors ranging from green (lowest) to red (highest) indicating the level of gene expression in each treatment and period evaluated. Reference: K562 cells without induction of oxidative stress and not treated with melatonin; 100 µM H2O2: Cells under stress induction with hydrogen peroxide; C1: cells treated with 1 nM melatonin; C2: cells treated with 1 mM melatonin; C1 + 100 µM H2O2 and C2 + 100 µM H2O2: sets of cells treated with the same melatonin concentrations associated with stress induction; D0: before the differentiation, D2: beginning of cell differentiation; D4: maximum of the differentiation process.

Similar articles

Cited by

References

    1. Pisoschi A.M., Pop A. The Role of Antioxidants in the Chemistry of Oxidative Stress: A Review. Eur. J. Med. Chem. 2015;97:55–74. doi: 10.1016/j.ejmech.2015.04.040. - DOI - PubMed
    1. Poljsak B., Šuput D., Milisav I. Achieving the Balance between ROS and Antioxidants: When to Use the Synthetic Antioxidants. Oxid. Med. Cell. Longev. 2013;2013:956792. doi: 10.1155/2013/956792. - DOI - PMC - PubMed
    1. Klotz L., Sánchez-ramos C., Prieto-arroyo I., Urbánek P., Steinbrenner H., Monsalve M. Redox Regulation of FoxO Transcription Factors. Redox Biol. 2015;6:51–72. doi: 10.1016/j.redox.2015.06.019. - DOI - PMC - PubMed
    1. Sies H., Berndt C., Jones D.P. Oxidative Stress. Annu. Rev. Biochem. 2017;86:715–748. doi: 10.1146/annurev-biochem-061516-045037. - DOI - PubMed
    1. Calnan D.R. Brunet, a the FoxO Code. Oncogene. 2008;27:2276–2288. doi: 10.1038/onc.2008.21. - DOI - PubMed

MeSH terms