. 2022 Dec 15;13(12):2368.
doi: 10.3390/genes13122368.

Potential Cytoprotective and Regulatory Effects of Ergothioneine on Gene Expression of Proteins Involved in Erythroid Adaptation Mechanisms and Redox Pathways in K562 Cells

Affiliations

Potential Cytoprotective and Regulatory Effects of Ergothioneine on Gene Expression of Proteins Involved in Erythroid Adaptation Mechanisms and Redox Pathways in K562 Cells

Victoria Simões Bernardo et al. Genes (Basel). .

Abstract

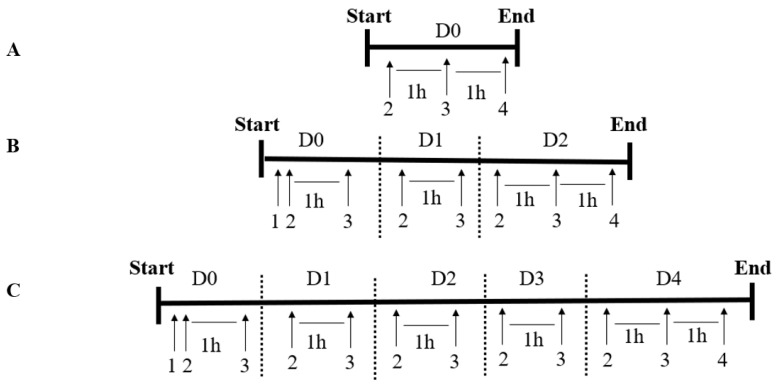
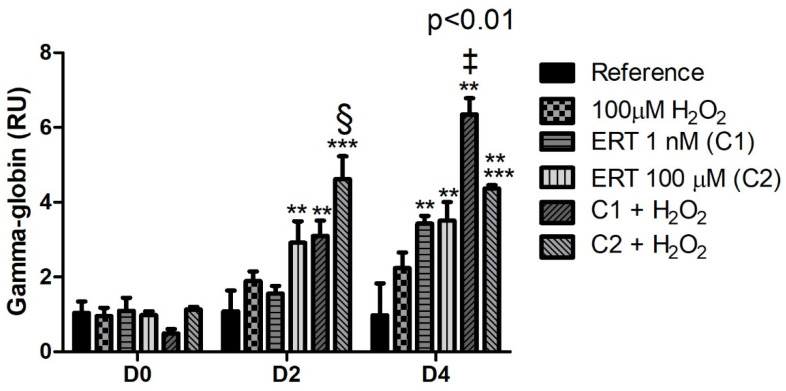
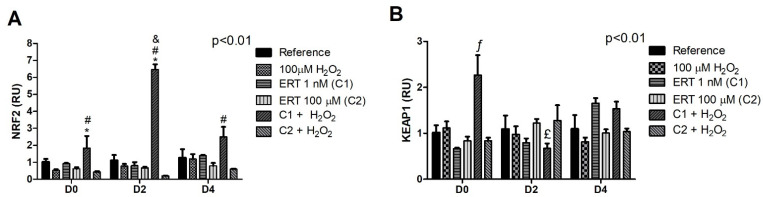
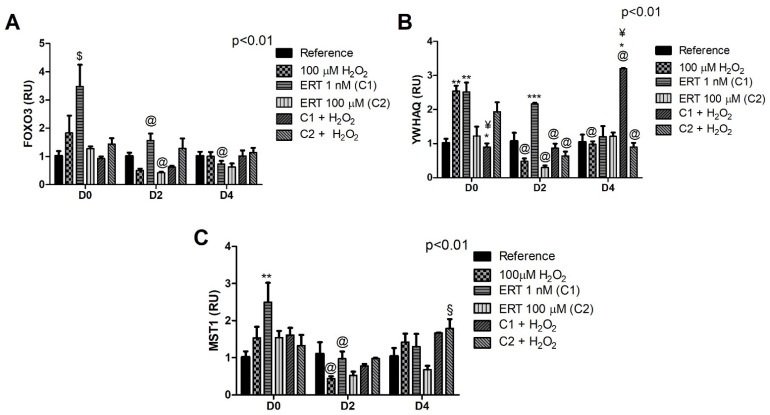
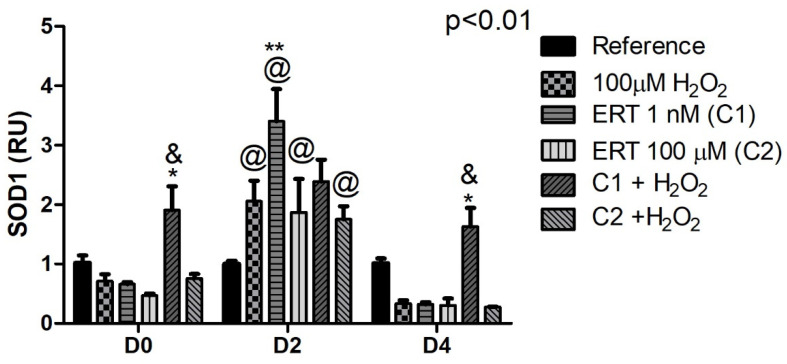
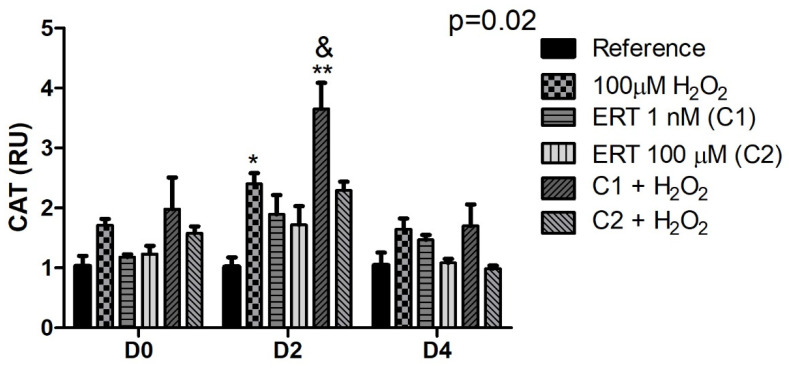
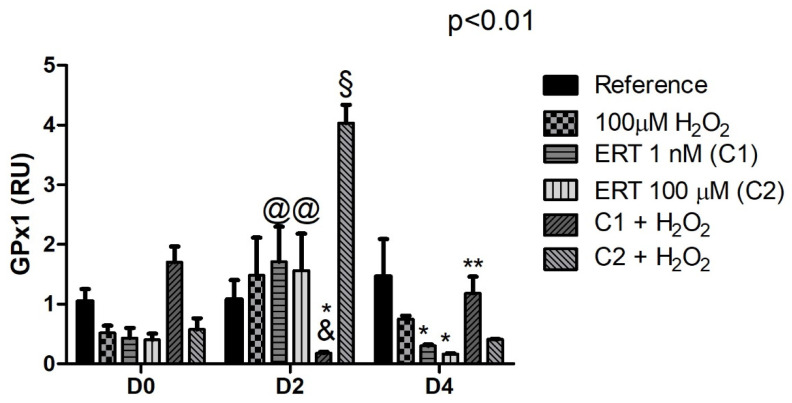
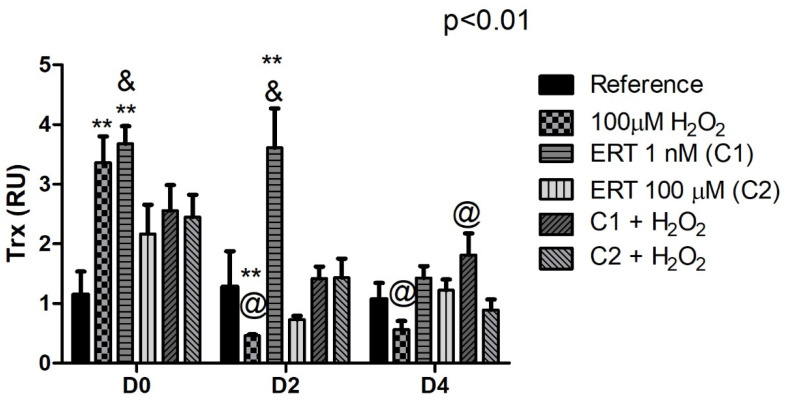
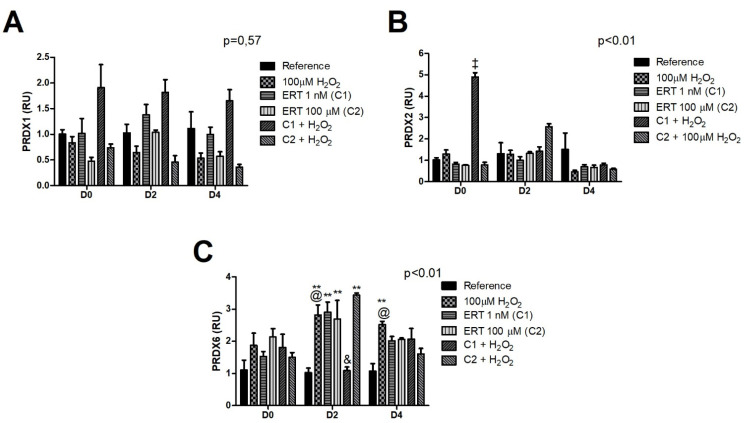
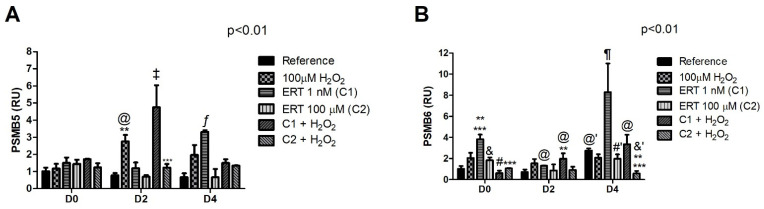
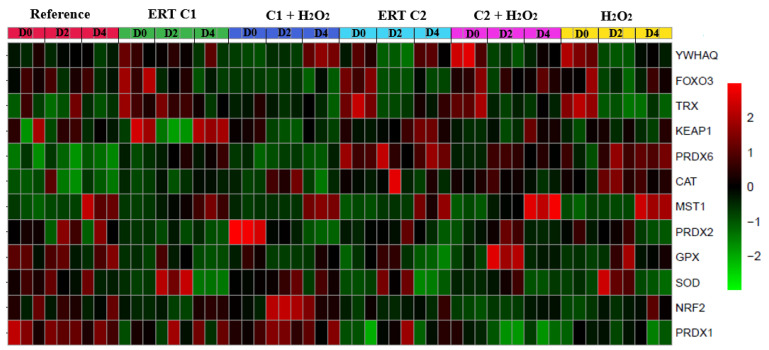
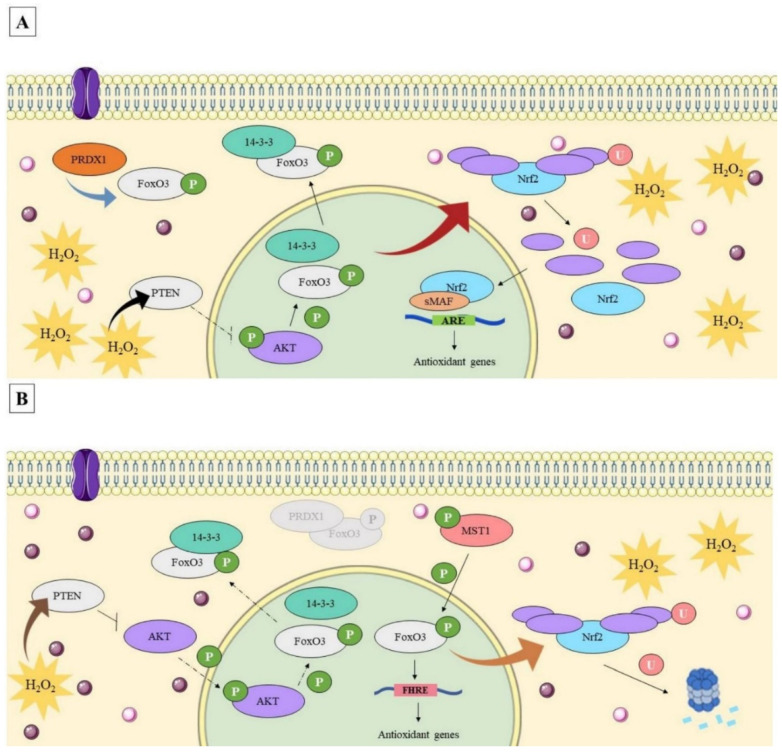
This study aimed to establish the importance of ergothioneine (ERT) in the erythroid adaptation mechanisms by appraising the expression levels of redox-related genes associated with the PI3K/AKT/FoxO3 and Nrf2-ARE pathways using K562 cells induced to erythroid differentiation and H2O2-oxidative stress. Cell viability and gene expression were evaluated. Two concentrations of ERT were assessed, 1 nM (C1) and 100 µM (C2), with and without stress induction (100 µM H2O2). Assessments were made in three periods of the cellular differentiation process (D0, D2, and D4). The C1 treatment promoted the induction of FOXO3 (D0 and 2), PSMB5, and 6 expressions (D4); C1 + H2O2 treatment showed the highest levels of NRF2 transcripts, KEAP1 (D0), YWHAQ (D2 and 4), PSMB5 (D2) and PSMB6 (D4); and C2 + H2O2 (D2) an increase in FOXO3 and MST1 expression, with a decrease of YWHAQ and NRF2 was observed. in C2 + H2O2 (D2) an increase in FOXO3 and MST1, with a decrease in YWHAQ and NRF2 was observed All ERT treatments increased gamma-globin expression. Statistical multivariate analyzes highlighted that the Nrf2-ARE pathway presented a greater contribution in the production of PRDX1, SOD1, CAT, and PSBM5 mRNAs, whereas the PI3K/AKT/FoxO3 pathway was associated with the PRDX2 and TRX transcripts. In conclusion, ERT presented a cytoprotective action through Nrf2 and FoxO3, with the latter seeming to contribute to erythroid proliferation/differentiation.

Keywords: antioxidants; proteasome; redox adaptation; therapeutic agent.


Conflict of interest statement

The authors declare no conflict of interest.

Figures

Figure 1
Figure 1
Experimental Design. (A)—Summary of the experimental design for the treatments evaluated at D0 (day 0). (B)—Summary of the experimental design for the treatments evaluated on D2 (day 2). (C)—Summary of the experimental design for the treatments evaluated on D4 (day 4). D0: before the differentiation process; D2: the beginning of cell differentiation, with increased hemoglobin F (HbF) expression; and D4: maximum of the differentiation process, with the peak of HbF expression and increase in cell volume along with cellular complexity and the presence of cells with different shapes can be observed (pear-shaped, circular, cells with vesicles, among other shapes). (1) Induction of erythroid differentiation with hemin and hydroxyurea administration. (2) Ergothioneine treatments (1 nM or 100 µM). (3) Stressor agent administration (100 µM H2O2). (4) Biological material separation.
Figure 2
Figure 2
Relative expression of Gamma-Globin in K562 erythroid cells. Reference: K562 cells without H2O2 and not treated with ERT; 100 µM H2O2: Cells under stress induction with hydrogen peroxide; C1: cells translated with 1 nM ergothioneine (ERT); C2: cells translated with 100 µM ERT; C1 + 100 µM H2O2 and C2 + 100 µM H2O2: sets of cells treated with the same concentrations of ERT associated with stress induction; D0: before the differentiation process, D2: beginning of cell differentiation; D4: end of the process; and RU: Relative Unit-fold-change of the transcripts related to the Reference subgroup in D0. The symbols indicate the following statistical differences: § Effect of the higher concentration of ERT (C2) associated with 100 µM H2O2 compared to treatment C2; ‡ Effect of ERT C1 + 100 µM H2O2 treatment compared to all treatments; ** Effect of treatment within each period, compared to treatment Reference; and *** Effect of treatment within each period, compared to treatment 100 µM H2O2. The representative values of the three pseudoreplicates were expressed as mean with standard error (±SEM). General Linear Models (GLM) with two-way ANOVA format, complemented by the Bonferroni test.
Figure 3
Figure 3
Relative expression of the Keap1/Nrf2/ARE pathway in K562 erythroid cells. (A)—Nrf2 gene expression. (B)—Keap1 gene expression. Reference: K562 cells without H2O2 and not treated with ERT; 100 µM H2O2: Cells under stress induction with hydrogen peroxide; C1: cells translated with 1 nM ergothioneine (ERT); C2: cells translated with 100 µM ERT; C1 + 100 µM H2O2 and C2 + 100 µM H2O2: sets of cells treated with the same concentrations of ERT associated with stress induction; D0: before the differentiation process; D2: the beginning of cell differentiation; D4: end of the process; and RU: Relative Unit-fold-change of the transcripts related to the Reference subgroup in D0. The symbols indicate the following statistical differences: * Effect of treatment C1 + 100 µM H2O2 within each period; # Effect of the differentiation period (D2) compared to the same treatment (C1 + 100 µM H2O2) in the other differentiation periods; & Effect of lower concentration of ERT (C1) compared to higher (C2), both associated with 100 µM H2O2; ƒ Increased levels of transcripts in the C1 + 100 µM H2O2 group compared to the others within the D0 period (except for the 100 µM H2O2 group); and £ Effect of the differentiation period (D2) compared to the same treatment (C1 + 100 µM H2O2) only on D0. The representative values of the three pseudoreplicates were expressed as mean with standard error (± SEM). General Linear Models (GLM) with two-way ANOVA format, complemented by the Bonferroni test.
Figure 4
Figure 4
Relative expression of FOXO3 pathway in K562 erythroid cells. (A)—FOXO3 gene expression. (B)—YWHAQ (14-3-3) gene expression. (C)—MST1 gene expression. Reference: K562 cells without H2O2 and not treated with ERT; 100 µM H2O2: Cells under stress induction with hydrogen peroxide; C1: cells translated with 1 nM ergothioneine (ERT); C2: cells translated with 100 µM ERT; C1 + 100 µM H2O2 and C2 + 100 µM H2O2: sets of cells treated with the same concentrations of ERT associated with stress induction; D0: before the differentiation process; D2: the beginning of cell differentiation; D4: end of the process; and RU: Relative Unit-fold-change of the transcripts related to the Reference subgroup in D0. The symbols indicate the following statistical differences: $ Effect of the lowest concentration of ERT (C1) within each period; ¥ Effect of lower concentration of ERT (C1) compared to higher (C2), both associated with 100 µM H2O2; § Effect of the higher concentration of ERT (C2) associated with 100 µM H2O2 compared to treatment C2; @ Effect of the differentiation period within each treatment, compared to its counterpart in D0; * Effect of treatment C1 + 100 µM H2O2 within each period, compared to the treatments 100 µM H2O2 and ERT C1; ** Effect of treatment within each period, compared to the Reference; and *** Effect of treatment within each period, compared to treatment 100 µM H2O2. The representative values of the three pseudoreplicates were expressed as mean with standard error (± SEM). General Linear Models (GLM) with two-way ANOVA format, complemented by the Bonferroni test.
Figure 5
Figure 5
Relative expression of Superoxide Dismutase 1 (SOD1) in erythroid cells K562. Reference: K562 cells without H2O2 and not treated with ERT; 100 µM H2O2: Cells under stress induction with hydrogen peroxide; C1: cells translated with 1 nM ergothioneine (ERT); C2: cells translated with 100 µM ERT; C1 + 100 µM H2O2 and C2 + 100 µM H2O2: sets of cells treated with the same concentrations of ERT associated with stress induction; D0: before the differentiation process; D2: the beginning of cell differentiation; D4: end of the process; and RU: Relative Unit-fold-change of the transcripts related to the Reference subgroup in D0. The symbols indicate the following statistical differences: * Effect of treatment C1 + 100 µM H2O2 within each period, compared to treatment with peroxide (100 µM H2O2); ** Effect of treatment C1 compared to the reference; & Effect of lower concentration of ERT (C1) compared to higher (C2), both associated with the induction of oxidative stress (100 µM H2O2); and @ Effect of the differentiation period within each treatment, compared to its counterpart in D0 and D4. The representative values of the three pseudoreplicates were expressed as mean with standard error (±SEM). General Linear Models (GLM) with two-way ANOVA format, complemented by the Bonferroni test.
Figure 6
Figure 6
Relative expression of the catalase gene (CAT) in K562 erythroid cells. Reference: K562 cells without H2O2 and not treated with ERT; 100 µM H2O2: Cells under stress induction with hydrogen peroxide; C1: cells translated with 1 nM ergothioneine (ERT); C2: cells translated with 100 µM ERT; C1 + 100 µM H2O2 and C2 + 100 µM H2O2: sets of cells treated with the same concentrations of ERT associated with stress induction; D0: before the differentiation process; D2: the beginning of cell differentiation; D4: end of the process; and RU: Relative Unit-fold-change of the transcripts related to the Reference subgroup in D0. The symbols indicate the following statistical differences: * Effect of the Peroxide treatment, on day 2, compared to the reference; ** Effect of C1 + 100 µM H2O2 treatment within each period, compared to reference; and & Effect of lower concentration of ERT (C1) compared to higher (C2), both associated with H2O2. The representative values of the three pseudoreplicates were expressed as mean with standard error (±SEM). General Linear Models (GLM) with two-way ANOVA format, complemented by the Bonferroni test.
Figure 7
Figure 7
Relative expression of the Glutathione Peroxidase 1 (GPX1) gene in K562 erythroid cells. Reference: K562 cells without H2O2 and not treated with ERT; 100 µM H2O2: Cells under stress induction with hydrogen peroxide; C1: cells translated with 1 nM ergothioneine (ERT); C2: cells translated with 100 µM ERT; C1 + 100 µM H2O2 and C2 + 100 µM H2O2: sets of cells treated with the same concentrations of ERT associated with stress induction; D0: before the differentiation process; D2: the beginning of cell differentiation; D4: end of the process; RU: Relative Unit-fold-change of the transcripts related to the Reference subgroup in D0. The symbols indicate the following statistical differences: @ Effect of the differentiation period within each treatment, compared to its counterpart in D0 and D4; * Treatment effect, within each period, compared Peroxide treatment (100 µM H2O2); ** Effect of lower concentration of ERT (C1), on day 4, compared to higher concentration (C2), both associated with H2O2; & Decrease in gene expression resulting from the effect of the lower concentration of ERT (C1) compared to the higher (C2), both associated with the induction of oxidative stress (100 µM H2O2); and § Increase in gene expression resulting from the effect of a higher concentration of ERT (C2) compared to a lower one (C1), both associated with H2O2. The representative values of the three pseudoreplicates were expressed as mean with standard error (± SEM). General Linear Models (GLM) with two-way ANOVA format, complemented by the Bonferroni test.
Figure 8
Figure 8
Relative expression of the thioredoxin (TRX) gene in K562 erythroid cells. Reference: K562 cells without H2O2 and not treated with ERT; 100 µM H2O2: Cells under stress induction with hydrogen peroxide; C1: cells translated with 1 nM ergothioneine (ERT); C2: cells translated with 100 µM ERT; C1 + 100 µM H2O2 and C2 + 100 µM H2O2: sets of cells treated with the same concentrations of ERT associated with stress induction; D0: before the differentiation process; D2: the beginning of cell differentiation; D4: end of the process; and RU: Relative Unit-fold-change of the transcripts related to the Reference subgroup in D0. The symbols indicate the following statistical differences: ** Effect of treatment within each period, compared to reference; & Effect of the lowest concentration of ERT (C1) compared to the highest (C2), within each period; and @ Effect of the differentiation period within each treatment, compared to its counterpart in D0. The representative values of the three pseudoreplicates were expressed as mean with standard error (±SEM). General Linear Models (GLM) with two-way ANOVA format, complemented by the Bonferroni test.
Figure 9
Figure 9
Relative expression of the Peroxiredoxins in K562 erythroid cells. (A)—Peroxiredoxin 1 (PRDX1). (B)—Peroxiredoxin 2 (PRDX2). (C)—Peroxiredoxin 6 (PRDX6). Reference: K562 cells without H2O2 and not treated with ERT; 100 µM H2O2: Cells under stress induction with hydrogen peroxide; C1: cells translated with 1 nM ergothioneine (ERT); C2: cells translated with 100 µM ERT; C1 + 100 µM H2O2 and C2 + 100 µM H2O2: sets of cells treated with the same concentrations of ERT associated with stress induction; D0: before the differentiation process; D2: the beginning of cell differentiation; D4: end of the process; and RU: Relative Unit-fold-change of the transcripts related to the Reference subgroup in D0. The symbols indicate the following statistical difference: ‡ Effect of ERT C1 + 100 µM H2O2 treatment compared to all treatments; ** Effect of treatment within each period, compared to reference; & Effect of lower concentration of ERT (C1) compared to higher (C2), both associated with the induction of oxidative stress (100 µM H2O2); and @ Effect of the differentiation period within each treatment, compared to its counterpart in D0. The representative values of the three pseudoreplicates were expressed as mean with standard error (±SEM). General Linear Models (GLM) with two-way ANOVA format.
Figure 10
Figure 10
Relative expression of the Proteasome (PSMB5 and PSMB6) in K562 erythroid cells. (A)—Proteasome 20S Subunit Beta 5 (PSMB5). (B)—Proteasome 20S Subunit Beta 1 or Proteasome Subunit Beta Type 6 (PSMB6). Reference: K562 cells without H2O2 and not treated with ERT; 100 µM H2O2: Cells under stress induction with hydrogen peroxide; C1: cells translated with 1 nM ergothioneine (ERT); C2: cells translated with 100 µM ERT; C1 + 100 µM H2O2 and C2 + 100 µM H2O2: sets of cells treated with the same concentrations of ERT associated with stress induction; D0: before the differentiation process; D2: the beginning of cell differentiation; D4: end of the process; and RU: Relative Unit-fold-change of the transcripts related to the Reference subgroup in D0. The symbols indicate the following statistical differences: @ Effect of the differentiation period within each treatment, compared to its counterpart in D0; @’ Effect of the differentiation period within each treatment, compared to its counterpart in D0 and D2; ** Effect of treatment within each period, compared to treatment Reference; *** Effect of treatment within each period, compared to treatment 100 µM H2O2; ‡ Effect of ERT C1 + 100 µM H2O2 treatment compared to all treatments; ¶ Increased levels of transcripts in the ERT C1 group compared to all treatments; ƒ Effect of ERT C1 group compared to the others (except for the 100 µM H2O2 group in D2-non-significant difference); # Effect of lowest concentration of ERT (C1) compared to ERT C1 + 100 µM H2O2; #’ Effect of the highest concentration of ERT (C2) compared to the ERT C2 + 100 µM H2O2; & Effect of the highest concentration of ERT (C2) compared to the lowest (C1), within each period; and &’ Effect of the highest concentration of ERT (C2) compared to the lowest (C1), both associated with 100 µM H2O2. The representative values of the three pseudoreplicates were expressed as mean with standard error (±SEM). General Linear Models (GLM) with two-way ANOVA format, complemented by the Bonferroni test.
Figure 11
Figure 11
Overview of the expression pattern of the genes involved in the redox adaptation mechanisms in K562 cells. Genes are clustered hierarchically (full clustering method) using Euclidean correlation as the distance metric, with colors ranging from green (lowest) to red (highest), indicating the level of gene expression in each treatment and period evaluated. Reference: K562 cells without H2O2 and not treated with ERT; 100 µM H2O2: Cells under stress induction with hydrogen peroxide; C1: cells translated with 1 nM ergothioneine (ERT); C2: cells translated with 100 µM ERT; C1 + 100 µM H2O2 and C2 + 100 µM H2O2: sets of cells treated with the same concentrations of ERT associated with stress induction; D0: before the differentiation process; D2: the beginning of cell differentiation; and D4: end of the process.
Figure 12
Figure 12
Proposed mechanism of action for cytoprotective action of ergothioneine in erythroid K562 cells under oxidative stress. (A)—Proposed mechanism for the low concentration of ergothioneine. Ergothioneine (ERT), represented by a circle (purple, reduced form and pink represents the ERT oxidized intermediaries), is internalized by its specific transporter ETT (shown in purple, on the left side of the figure) acts directly detoxifying the hydrogen peroxide (H2O2). However, the H2O2 resulting concentration is enough to activate the PI3K/AKT signaling pathway (thick black arrow), which results in the cytoplasmic concentration of FoxO3 (thru the chaperone 14-3-3). The reduced expression of FOXO3 results in the expression of a second transcription factor, NRF2 (red arrow) which, once activated, acts on the transcription of antioxidant enzymes (via Nrf2-ARE pathway), such as PRDX1. This oxidative stress sensor acts in the last stage of this regulation (blue arrow), aiding in the cytoplasmic maintenance of FoxO3. (B)—Proposed mechanism for the high concentration of ergothioneine. ERT acts directly detoxifying the H2O2 and, in this concentration, ERT detoxifies enough H2O2 to prevent the activation of the PI3K/AKT pathway and, consequently, the translocation of the FoxO3 to the cytoplasm (thick brown arrow). The high nuclear concentration of FoxO3 and the increase in its expression, especially on D2, results in a decreased expression of NRF2 (orange arrow) which is forwarded for degradation via proteasome. PRDX1 present a low expression in this treatment. Thus, PRDX1 is not enough to concentrate FoxO3 in the cytoplasm (represent in the center as gray proteins) buttressing the proposed theory of the transactivation of the target genes via FoxO3 pathway. ARE: Human Antioxidant Response Element; ERT: ergothioneine; FHRE: FoxO responsive element; FoxO3, Forkhead box O3 protein; Nrf2, erythroid nuclear factor 2 related to factor 2; P: phosphorylation; PER: hydrogen peroxide; PTEN: Phosphatase and tensin homology; sMAF, small Maf protein; U, ubiquitination. Triggered line: inactive pathway; Continuous line: active pathway. For interpretation of the references to color in this figure legend, the reader is referred to the web version of this article. Source: This figure was created by the authors adapting images from Servier Medical Art Commons Attribution 3.0 Unported License ((http://smart.servier.com), accessed on 15 January 2021).

Similar articles

Cited by

References

    1. Jones D.P., Sies H. The Redox Code. Antioxid. Redox Signal. 2015;23:734–746. doi: 10.1089/ars.2015.6247. - DOI - PMC - PubMed
    1. Poprac P., Jomova K., Simunkova M., Kollar V., Rhodes C.J., Valko M. Targeting Free Radicals in Oxidative Stress-Related Human Diseases. Trends Pharmacol. Sci. 2017;38:592–607. doi: 10.1016/j.tips.2017.04.005. - DOI - PubMed
    1. Liguori I., Russo G., Curcio F., Bulli G., Aran L., Della-Morte D., Gargiulo G., Testa G., Cacciatore F., Bonaduce D., et al. Oxidative Stress, Aging, and Diseases. Clin. Interv. Aging. 2018;13:757–772. doi: 10.2147/CIA.S158513. - DOI - PMC - PubMed
    1. Vona R., Sposi N.M., Mattia L., Gambardella L., Straface E., Pietraforte D. Sickle Cell Disease: Role of Oxidative Stress and Antioxidant Therapy. Antioxidants. 2021;10:296. doi: 10.3390/antiox10020296. - DOI - PMC - PubMed
    1. Singh A., Kukreti R., Saso L., Kukreti S. Oxidative Stress: A Key Modulator in Neurodegenerative Diseases. Molecules. 2019;24:1583. doi: 10.3390/molecules24081583. - DOI - PMC - PubMed

MeSH terms