

Proteomic and Transcriptomic Landscapes of Alström and Bardet-Biedl Syndromes
- PMID: 36553637
- PMCID: PMC9777683
- DOI: 10.3390/genes13122370
Proteomic and Transcriptomic Landscapes of Alström and Bardet-Biedl Syndromes
Abstract
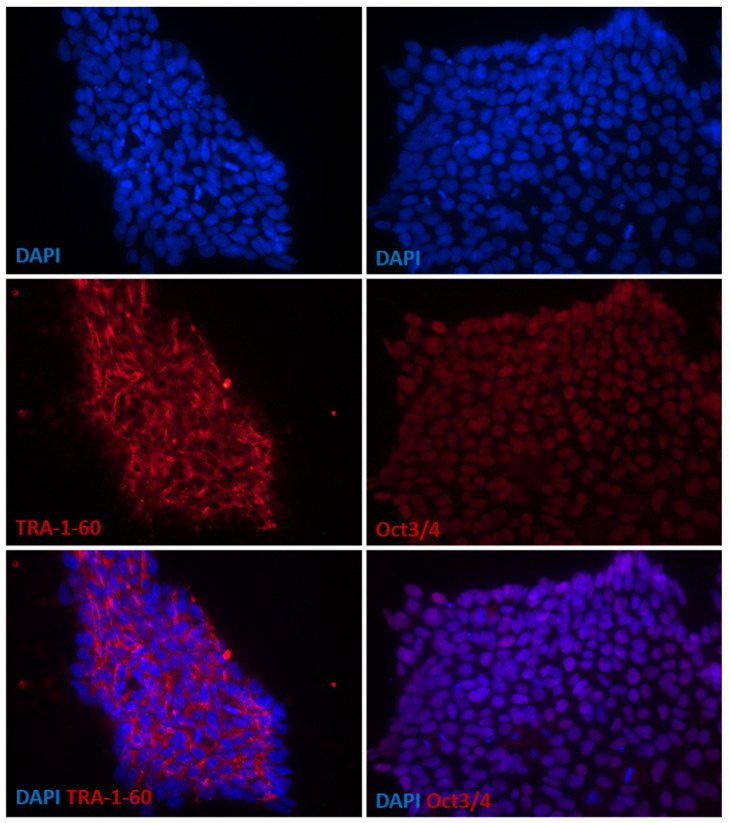
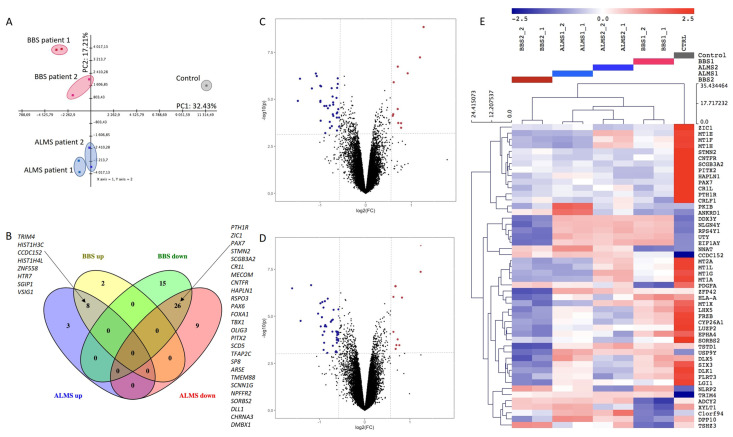
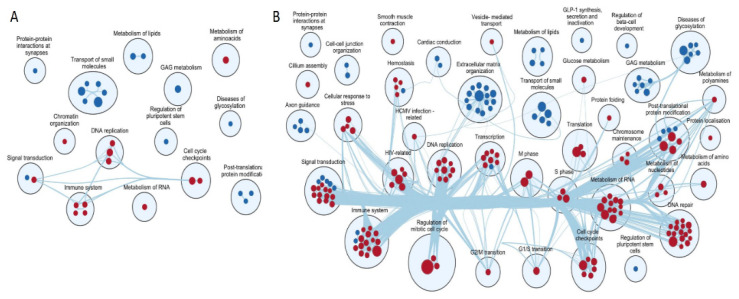
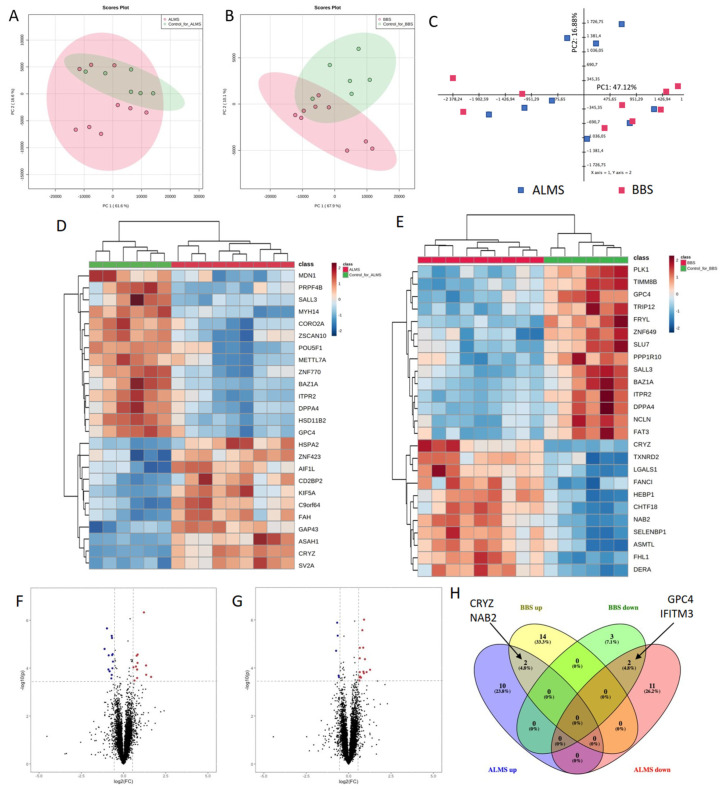
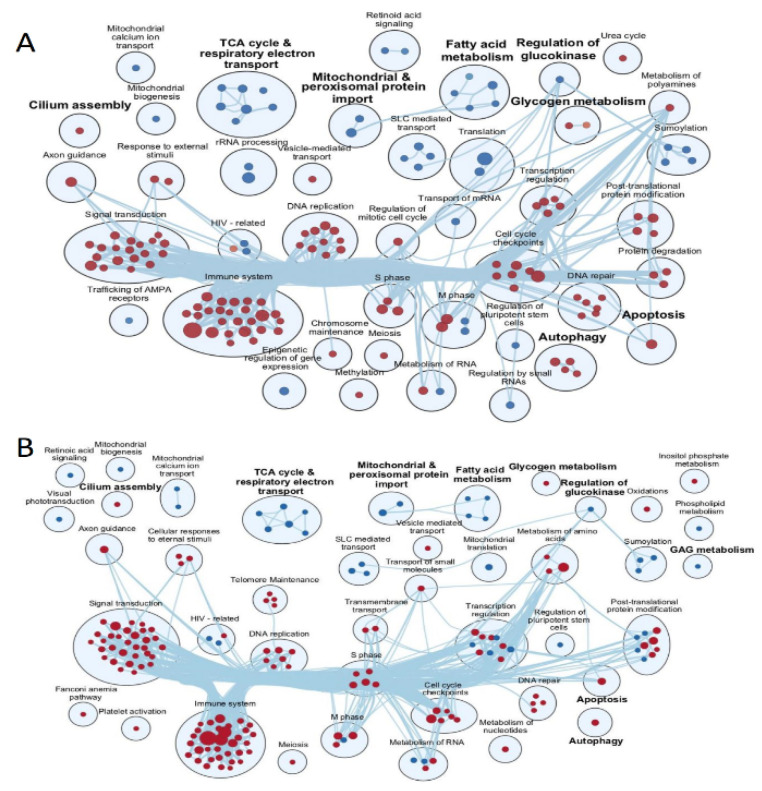
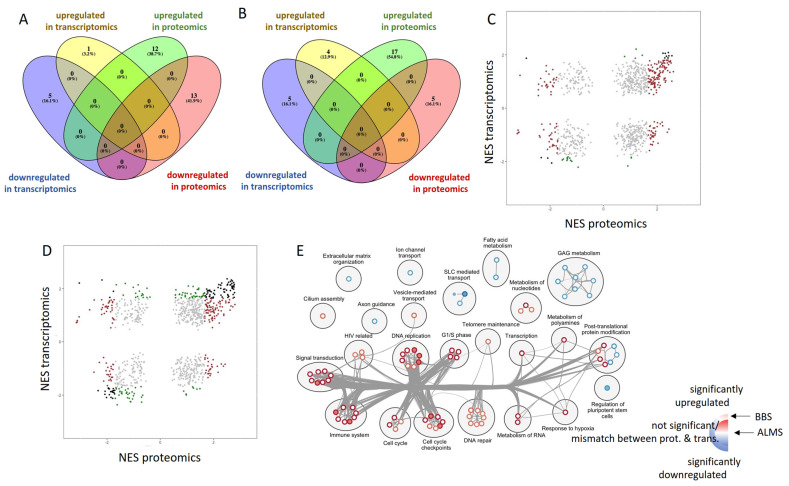
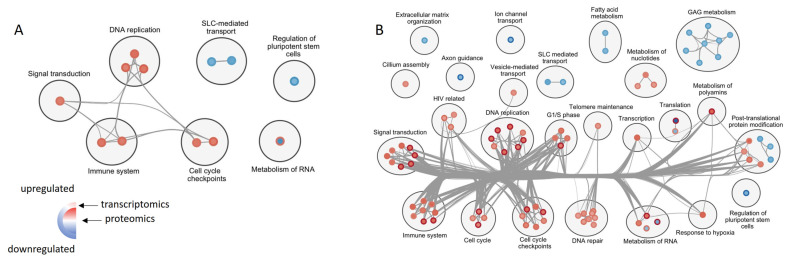
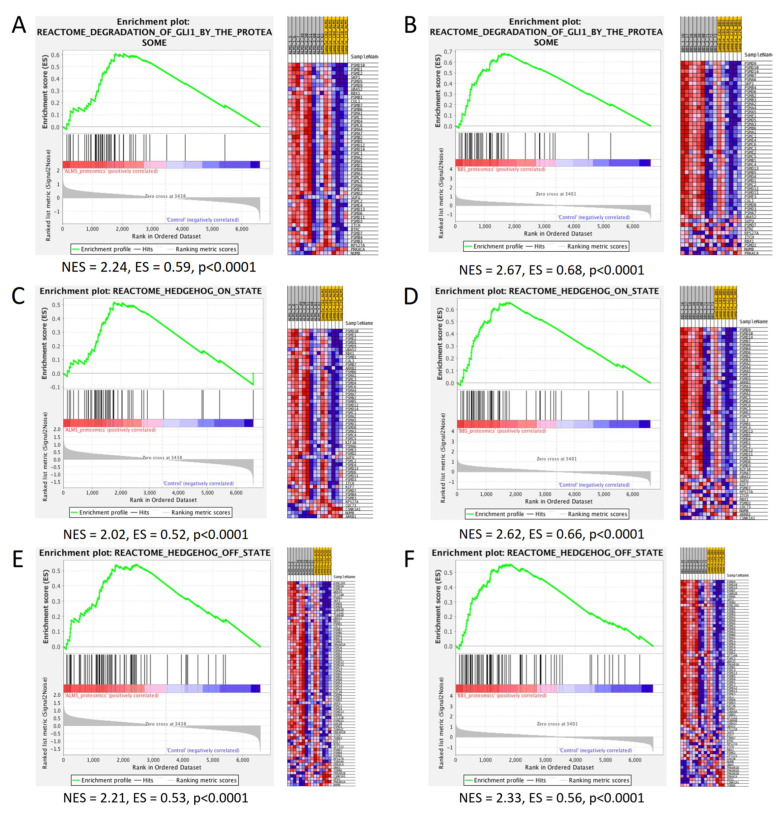
Alström syndrome (ALMS) and Bardet-Biedl syndrome (BBS) are rare genetic diseases with a number of common clinical features ranging from early-childhood obesity and retinal degeneration. ALMS and BBS belong to the ciliopathies, which are known to have the expression products of genes, encoding them as cilia-localized proteins in multiple target organs. The aim of this study was to perform transcriptomic and proteomic analysis on cellular models of ALMS and BBS syndromes to identify common and distinct pathological mechanisms present in both syndromes. For this purpose, epithelial cells were isolated from the urine of patients and healthy subjects, which were then cultured and reprogrammed into induced pluripotent stem (iPS) cells. The pathways of genes associated with the metabolism of lipids and glycosaminoglycan and the transport of small molecules were found to be concomitantly downregulated in both diseases, while transcripts related to signal transduction, the immune system, cell cycle control and DNA replication and repair were upregulated. Furthermore, protein pathways associated with autophagy, apoptosis, cilium assembly and Gli1 protein were upregulated in both ciliopathies. These results provide new insights into the common and divergent pathogenic pathways between two similar genetic syndromes, particularly in relation to primary cilium function and abnormalities in cell differentiation.
Keywords: Alström syndrome; Bardet–Biedl syndrome; cilia; proteomics; transcriptomics.
Conflict of interest statement
The authors declare no conflict of interest.
Figures
Similar articles
-
Whole organism transcriptome analysis of zebrafish models of Bardet-Biedl Syndrome and Alström Syndrome provides mechanistic insight into shared and divergent phenotypes.BMC Genomics. 2016 May 3;17:318. doi: 10.1186/s12864-016-2679-1. BMC Genomics. 2016. PMID: 27142762 Free PMC article.
-
Alström syndrome: insights into the pathogenesis of metabolic disorders.Nat Rev Endocrinol. 2011 Feb;7(2):77-88. doi: 10.1038/nrendo.2010.210. Epub 2010 Dec 7. Nat Rev Endocrinol. 2011. PMID: 21135875 Review.
-
Searching for Effective Methods of Diagnosing Nervous System Lesions in Patients with Alström and Bardet-Biedl Syndromes.Genes (Basel). 2023 Sep 10;14(9):1784. doi: 10.3390/genes14091784. Genes (Basel). 2023. PMID: 37761924 Free PMC article.
-
Arrayed primer extension technology simplifies mutation detection in Bardet-Biedl and Alström syndrome.Eur J Hum Genet. 2011 Apr;19(4):485-8. doi: 10.1038/ejhg.2010.207. Epub 2010 Dec 15. Eur J Hum Genet. 2011. PMID: 21157496 Free PMC article.
-
Obesity-Related Ciliopathies: Focus on Advances of Biomarkers.Int J Mol Sci. 2024 Aug 3;25(15):8484. doi: 10.3390/ijms25158484. Int J Mol Sci. 2024. PMID: 39126056 Free PMC article. Review.
Cited by
-
Pharmaceutical inhibition of the Chk2 kinase mitigates cone photoreceptor degeneration in an iPSC model of Bardet-Biedl syndrome.iScience. 2025 Mar 1;28(4):112130. doi: 10.1016/j.isci.2025.112130. eCollection 2025 Apr 18. iScience. 2025. PMID: 40151639 Free PMC article.
-
The hope, hype and obstacles surrounding cell therapy.J Cell Mol Med. 2024 May;28(10):e18359. doi: 10.1111/jcmm.18359. J Cell Mol Med. 2024. PMID: 38770886 Free PMC article. Review.
-
Posttranslational modifications of proteins in diseased retina.Front Cell Neurosci. 2023 Mar 30;17:1150220. doi: 10.3389/fncel.2023.1150220. eCollection 2023. Front Cell Neurosci. 2023. PMID: 37066080 Free PMC article. Review.
-
Alström Syndrome: A Review Focusing on Its Diverse Clinical Manifestations and Their Etiology as a Ciliopathy.Yonago Acta Med. 2024 May 21;67(2):93-99. doi: 10.33160/yam.2024.05.010. eCollection 2024 May. Yonago Acta Med. 2024. PMID: 38803594 Free PMC article. Review.
-
Workability of mRNA Sequencing for Predicting Protein Abundance.Genes (Basel). 2023 Nov 11;14(11):2065. doi: 10.3390/genes14112065. Genes (Basel). 2023. PMID: 38003008 Free PMC article. Review.
References
Publication types
MeSH terms
Substances
LinkOut - more resources
Full Text Sources
Medical
