

Genetic Diversity and Population Structure Analysis of Castanopsis hystrix and Construction of a Core Collection Using Phenotypic Traits and Molecular Markers
- PMID: 36553650
- PMCID: PMC9778198
- DOI: 10.3390/genes13122383
Genetic Diversity and Population Structure Analysis of Castanopsis hystrix and Construction of a Core Collection Using Phenotypic Traits and Molecular Markers
Abstract
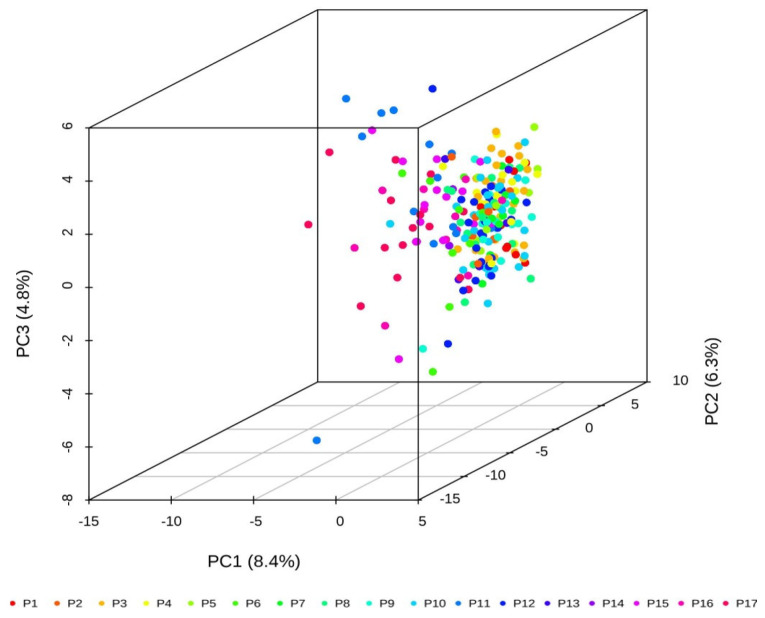
Castanopsis hystrix is a valuable native, broad-leaved, and fast-growing tree in South China. In this study, 15 phenotypic traits and 32 simple sequence repeat (SSR) markers were used to assess the genetic diversity and population structure of a natural population of C. hystrix and to construct a core germplasm collection by a set of 232 accessions. The results showed that the original population of C. hystrix had relatively high genetic diversity, with the number of alleles (Na), effective number of alleles (Ne), observed heterozygosity (Ho), expected heterozygosity (He), Shannon's information index (I), and polymorphism information content (PIC) averaging at 26.188, 11.565, 0.863, 0.897, 2.660, and 0.889, respectively. Three sub-populations were identified based on a STRUCTURE analysis, indicating a strong genetic structure. The results from the phylogenetic and population structures showed a high level of agreement, with 232 germplasms being classified into three main groups. The analysis of molecular variance (AMOVA) test indicated that 96% of the total variance was derived from within populations, which revealed a low differentiation among populations. A core collection composed of 157 germplasms was firstly constructed thereafter, of which the diversity parameters non-significantly differed from the original population. These results revealed the genetic diversity and population structure of C. hystrix germplasms, which have implications for germplasm management and genome-wide association studies on C. hystrix, as well as for core collection establishment applications in other wood-producing hardwood species.
Keywords: Castanopsis hystrix; core collection; genetic diversity; molecular markers; phenotypic traits; population genetics.
Conflict of interest statement
The authors declare no conflict of interest.
Figures


Similar articles
-
Genetic Diversity Analysis and Core Collection Construction of Ancient Sophora japonica L. Using SSR Markers.Int J Mol Sci. 2024 Nov 28;25(23):12776. doi: 10.3390/ijms252312776. Int J Mol Sci. 2024. PMID: 39684487 Free PMC article.
-
Genetic Diversity Analysis and Core Germplasm Collection Construction of Camellia oleifera Based on Fruit Phenotype and SSR Data.Genes (Basel). 2022 Dec 13;13(12):2351. doi: 10.3390/genes13122351. Genes (Basel). 2022. PMID: 36553618 Free PMC article.
-
Genetic Diversity of a Natural Population of Akebia trifoliata (Thunb.) Koidz and Extraction of a Core Collection Using Simple Sequence Repeat Markers.Front Genet. 2021 Aug 31;12:716498. doi: 10.3389/fgene.2021.716498. eCollection 2021. Front Genet. 2021. PMID: 34531899 Free PMC article.
-
Development and characterization of polymorphic microsatellite markers for Castanopsis hystrix (Fagaceae).Genet Mol Res. 2015 Mar 30;14(1):2436-9. doi: 10.4238/2015.March.30.1. Genet Mol Res. 2015. PMID: 25867389
-
Genetic Diversity and Population Structure Analysis of DalbergiaOdorifera Germplasm and Development of a Core Collection Using Microsatellite Markers.Genes (Basel). 2019 Apr 6;10(4):281. doi: 10.3390/genes10040281. Genes (Basel). 2019. PMID: 30959931 Free PMC article.
Cited by
-
Genetic structure analysis and core germplasm construction of Robinia pseudoacacia and its closely related species based on SNP.BMC Plant Biol. 2025 Jul 2;25(1):843. doi: 10.1186/s12870-025-06872-5. BMC Plant Biol. 2025. PMID: 40604451 Free PMC article.
-
Evolution of the Correlated Genomic Variation Landscape Across a Divergence Continuum in the Genus Castanopsis.Mol Biol Evol. 2024 Sep 4;41(9):msae191. doi: 10.1093/molbev/msae191. Mol Biol Evol. 2024. PMID: 39248185 Free PMC article.
-
An investigation of genetic diversity in three Dezhou donkey original breeding farms.Sci Rep. 2023 Jul 11;13(1):11203. doi: 10.1038/s41598-023-38219-1. Sci Rep. 2023. PMID: 37433834 Free PMC article.
-
Genetic Diversity and Evaluation of Agro-Morphological Traits in Lettuce Core Collection.Plants (Basel). 2024 Dec 19;13(24):3552. doi: 10.3390/plants13243552. Plants (Basel). 2024. PMID: 39771250 Free PMC article.
-
Genetic diversity and population structure of Polygonatum cyrtonema Hua in China using SSR markers.PLoS One. 2023 Aug 31;18(8):e0290605. doi: 10.1371/journal.pone.0290605. eCollection 2023. PLoS One. 2023. PMID: 37651363 Free PMC article.
References
-
- Yanchuk A.D. A Quantitative Framework for Breeding and Conservation of Forest Tree Genetic Resources in British Columbia. Can. J. For. Res. 2001;31:566–576. doi: 10.1139/x00-133. - DOI
-
- White T.L., Adams W.T., Neale D.B. Forest Genetics. CABI; Wallingford, UK: 2007.
Publication types
MeSH terms
Substances
LinkOut - more resources
Full Text Sources
