. 2022 Dec 16;13(12):2392.
doi: 10.3390/genes13122392.

A Whole-Genome Sequencing Study Implicates GRAMD1B in Multiple Sclerosis Susceptibility

Affiliations

A Whole-Genome Sequencing Study Implicates GRAMD1B in Multiple Sclerosis Susceptibility

Federica Esposito et al. Genes (Basel). .

Abstract

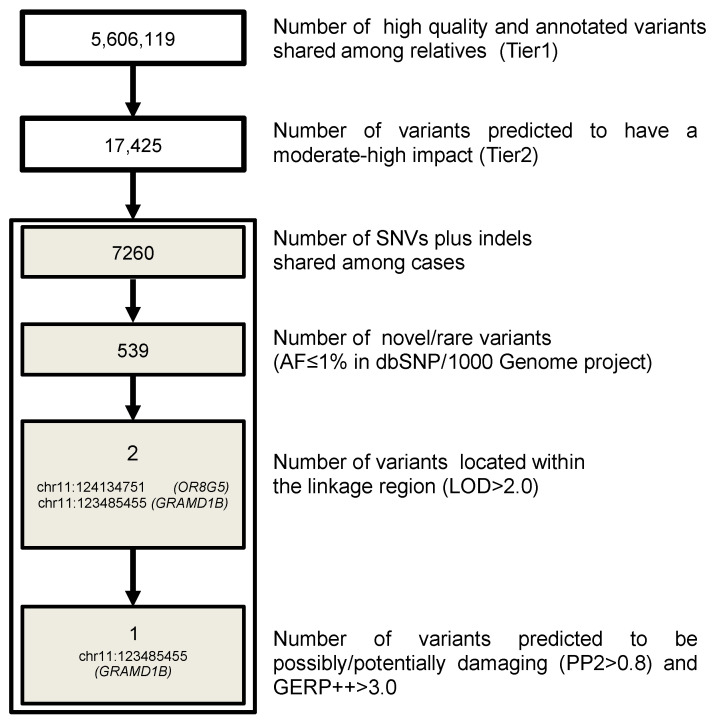
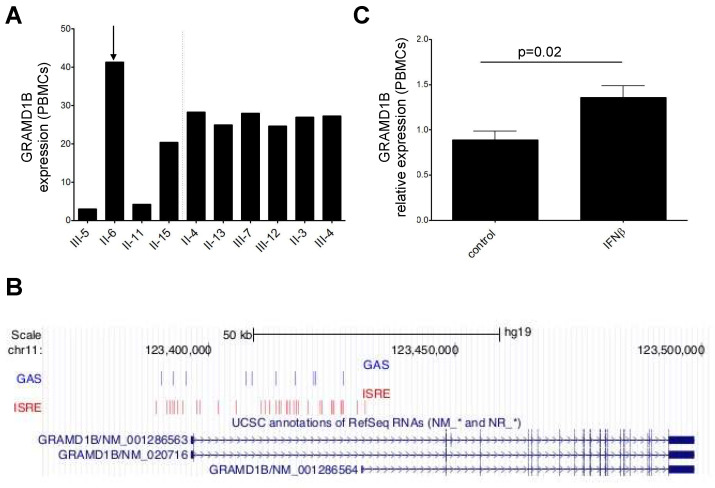
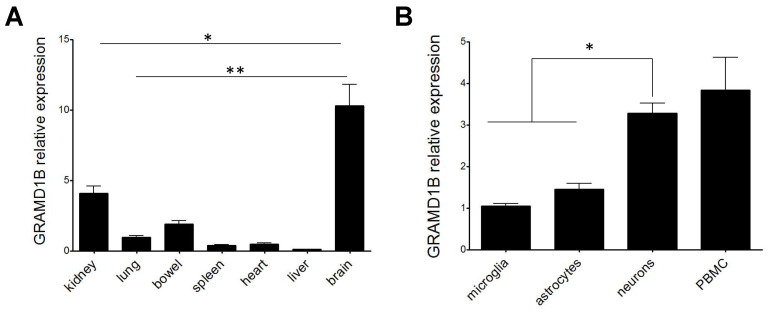
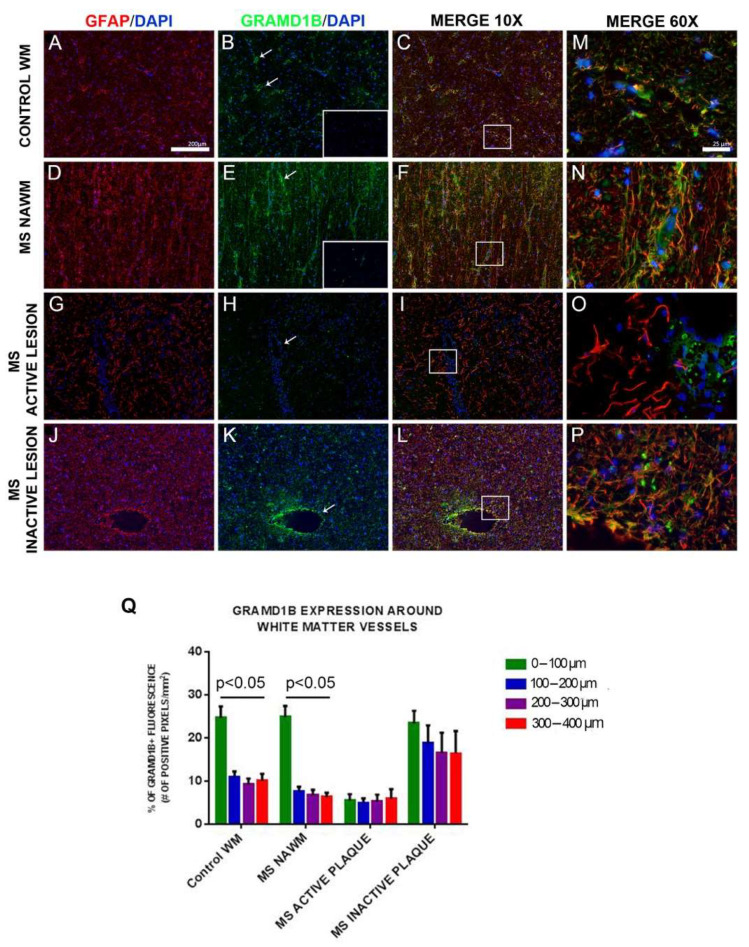
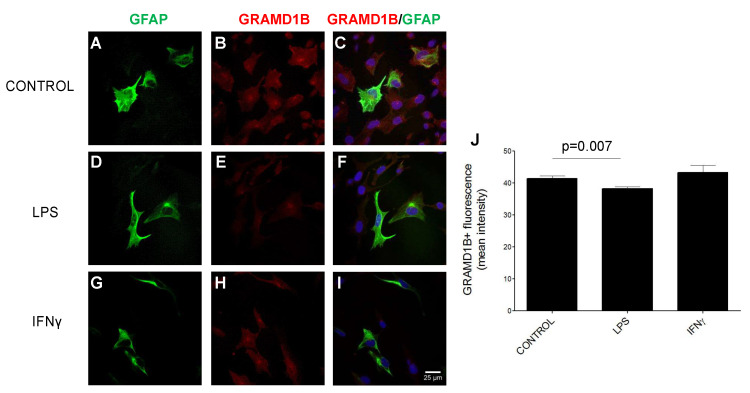
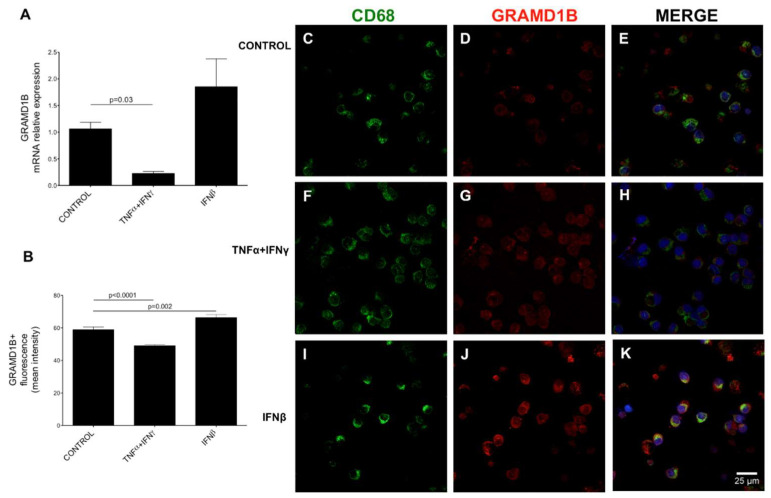
While the role of common genetic variants in multiple sclerosis (MS) has been elucidated in large genome-wide association studies, the contribution of rare variants to the disease remains unclear. Herein, a whole-genome sequencing study in four affected and four healthy relatives of a consanguineous Italian family identified a novel missense c.1801T > C (p.S601P) variant in the GRAMD1B gene that is shared within MS cases and resides under a linkage peak (LOD: 2.194). Sequencing GRAMD1B in 91 familial MS cases revealed two additional rare missense and two splice-site variants, two of which (rs755488531 and rs769527838) were not found in 1000 Italian healthy controls. Functional studies demonstrated that GRAMD1B, a gene with unknown function in the central nervous system (CNS), is expressed by several cell types, including astrocytes, microglia and neurons as well as by peripheral monocytes and macrophages. Notably, GRAMD1B was downregulated in vessel-associated astrocytes of active MS lesions in autopsied brains and by inflammatory stimuli in peripheral monocytes, suggesting a possible role in the modulation of inflammatory response and disease pathophysiology.

Keywords: multiple sclerosis; neurology; rare variants; sequencing.


Conflict of interest statement

Federica Esposito has received honoraria from Serono Symposia International Foundation. A. Dessa Sadovnick has received funding from Biogen and Ronald S. Roadburg Foundation, travel expenses from Biogen and honoraria from Biogen, Novartis, Momenta Pharmaceuticals, and Synofi. Giancarlo Comi has received consulting fees for participating on advisory boards from Novartis, Teva Pharmaceutical Ind. Ltd., Sanofi-Aventis, Merck Serono, Bayer Schering, Actelion and Geneuro and lecture fees from Novartis, Teva Pharmaceutical Industries Ltd., Sanofi-Aventis, Merck Serono, Biogen Dompè, Bayer Schering and Serono Symposia International Foundation. Filippo Martinelli Boneschi has received honoraria for consulting, research grant funding and travel expenses from TEVA Neuroscience, Biogen IDEC, Serono Symposia International Foundation and Genzyme Europe.

Figures

Figure 1
Figure 1
Pipeline for coding variant filtering. The different steps used to filter genetic variants in coding regions and the number of remaining variants in the family are reported. AF: allele frequency.
Figure 2
Figure 2
Pipeline applied for regulatory variant filtering. The different steps used to filter regulatory genetic variants and the number of left variants in the family are reported. AF: allele frequency; AD: autosomal dominant; AR: autosomal recessive.
Figure 3
Figure 3
Pedigree of the multiplex MS family and segregation of GRAMD1B c.1801T > C (p.S601P) variant. Squares represent men, circles represent women; slash, deceased subjects; black-filled symbols represent individuals diagnosed with MS. The first-cousin marriage between two unaffected individuals, subject I-1 and subject I-2, is indicated by a double line. +/+: homozygous individuals for mutated allele; −/−: homozygous individuals for wild-type allele; +/−: heterozygous individuals. The numbers reported inside circles and squares indicate age at sampling of the subject. The smaller arrowhead represents the proband; larger thick arrows represent samples subjected to whole-genome sequencing.
Figure 4
Figure 4
GRAMD1B mRNA expression in whole blood of members of the MS multiplex family, and in PBMC isolated from HC. (A) Relative GRAMD1B mRNA expression in whole blood from affected (on the left of the dashed line) and unaffected relatives (on the right of the dashed line) of the original MS multiplex family measured with Illumina arrays. The arrow indicates the unique MS patient who was IFNβ-treated. (B) ISRE and GAS elements in the GRAMD1B promoter and first intron identified in the in silico analysis are shown in the “GAS” and “ISRE” tracks, while the position of the gene is indicated in the “UCSC annotation of RefSeq RNAs” track; genomic position is indicated at the top. (C) Relative GRAMD1B mRNA expression in PBMC isolated from HC before and after stimulation with IFNβ immunomodulatory cytokine measured by qRT-PCR (n = 5). p-value refers to the comparison of expression values at baseline and after stimulation. Standard deviations are reported as bars. Error bars represent SEM.
Figure 5
Figure 5
GRAMD1B expression profile across different rat tissues and cell types. Relative expression of GRAMD1B gene in rat tissues from n = 3 rats (A) and rat cell types (B). Error bars represent SEM. p-values refer to the comparison of expression values between brain and other types of tissues (A) or between neurons and other cell types (B). * p < 0.05, ** p < 0.01.
Figure 6
Figure 6
GRAMD1B expression in astrocytes of human brain tissues from MS and control subjects. Histological analysis of GRAMD1B protein expression on astrocytes in brain autopsied tissues of MS subjects and control subjects without evidence of CNS pathology. GRAMD1B expression is shown in green, and the GFAP astrocyte marker is in red. (AC) Control subject, normal white matter (NWM). (DF) MS patient, normal-appearing white matter (NAWM). (GI) MS patient, active lesion site. (JL) MS patient, inactive lesion site (10× magnification). (MP) Higher (60×) magnification of boxed areas shown in the “Merge 10× column”. Isotype controls are represented in boxed areas of B and E pictures. (Q) Quantification of GRAMD1B expression at increasing distances from blood vessels (0–400 µM) in normal white matter (control WM), in MS normal-appearing white matter (MS NAWM), in an active lesion of an MS patient (MS active plaque), and in an MS inactive lesion. Distance from blood vessels: green color: 0–100 µm; blue color: 100–200 µm; pink color: 200–300 µm; red color: 300–400 µm. Arrows in boxes (B,E,H,K) indicate GRAMD1B expression in astrocytes on blood vessels. Error bars represent the SEM. p value refers to the comparison of GRAMD1B expression at different distances from blood vessel in each tissue/lesion type (by Kruskal–Wallis test).
Figure 7
Figure 7
GRAMD1B expression in culture of human astrocytes before and after stimulation with inflammatory stimuli. (AI) Immunohistochemistry of GRAMD1B expression in control conditions (AC) and after LPS (DF) and IFNγ (GI) stimulation. (J) Histogram of GRAMD1B quantification in control conditions and after LPS and IFNγ stimulation. p values refer to the comparison between LPS vs. baseline conditions and between IFNγ and baseline conditions.
Figure 8
Figure 8
GRAMD1B expression in macrophages/monocytes of control subjects before and after stimulation with inflammatory cytokines. Peripheral blood macrophages/monocytes from four HC blood samples were cultured and stimulated with different inflammatory cytokines. GRAMD1B expression was measured at mRNA level by quantitative RT-PCR (A) and at protein level by immunocytochemistry (BK). (A) Quantitative RT-PCR quantification of GRAMD1B mRNA expression in basal conditions, after TNFα- and IFNγ stimulation and after IFNβ stimulation. (B) Quantification of the GRAMD1B signal in different fields at resting conditions (control), after TNFα- and IFNγ stimulation and after IFNβ stimulation. (CE) Unstimulated cells. (FH) TNFα- and IFNγ-stimulated cells. (IK) IFNβ-stimulated cells. The panels on the right show the merged staining for GRAMD1B (in red) and the CD68 monocyte marker (in green).

Similar articles

Cited by

References

    1. Compston A. Genetic Epidemiology of Multiple Sclerosis. J. Neurol. Neurosurg. Psychiatry. 1997;62:553–561. doi: 10.1136/jnnp.62.6.553. - DOI - PMC - PubMed
    1. Sadovnick A.D., Baird P.A., Ward R.H. Multiple Sclerosis: Updated Risks for Relatives. Am. J. Med. Genet. 1988;29:533–541. doi: 10.1002/ajmg.1320290310. - DOI - PubMed
    1. International Multiple Sclerosis Genetics Consortium Multiple Sclerosis Genomic Map Implicates Peripheral Immune Cells and Microglia in Susceptibility. Science. 2019;365:eaav7188. doi: 10.1126/science.aav7188. - DOI - PMC - PubMed
    1. International Multiple Sclerosis Genetics Consortium Low-Frequency and Rare-Coding Variation Contributes to Multiple Sclerosis Risk. Cell. 2018;175:1679–1687.e7. doi: 10.1016/j.cell.2018.09.049. - DOI - PMC - PubMed
    1. Jacobsen M., Schweer D., Ziegler A., Gaber R., Schock S., Schwinzer R., Wonigeit K., Lindert R.B., Kantarci O., Schaefer-Klein J., et al. A Point Mutation in PTPRC Is Associated with the Development of Multiple Sclerosis. Nat. Genet. 2000;26:495–499. doi: 10.1038/82659. - DOI - PubMed

Publication types

Grants and funding