. 2022 Dec 19;13(12):2412.
doi: 10.3390/genes13122412.

In Silico Prediction of Hub Genes Involved in Diabetic Kidney and COVID-19 Related Disease by Differential Gene Expression and Interactome Analysis

Affiliations

In Silico Prediction of Hub Genes Involved in Diabetic Kidney and COVID-19 Related Disease by Differential Gene Expression and Interactome Analysis

Ulises Osuna-Martinez et al. Genes (Basel). .

Abstract

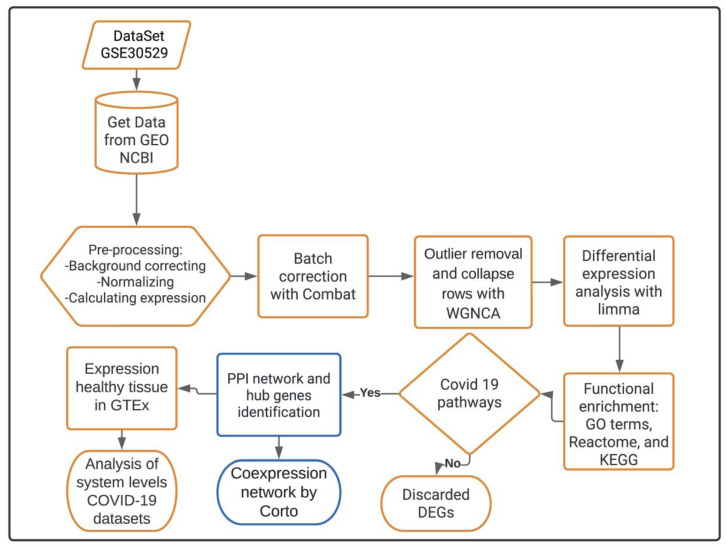
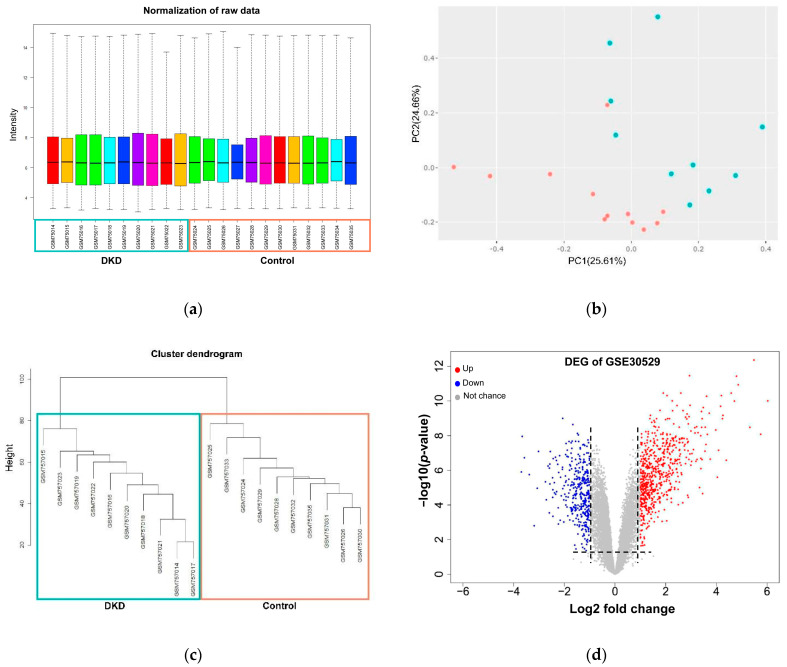
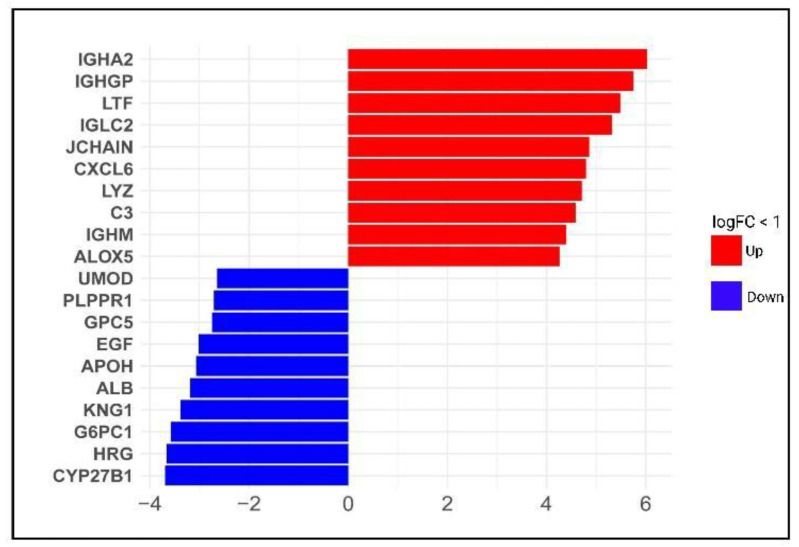
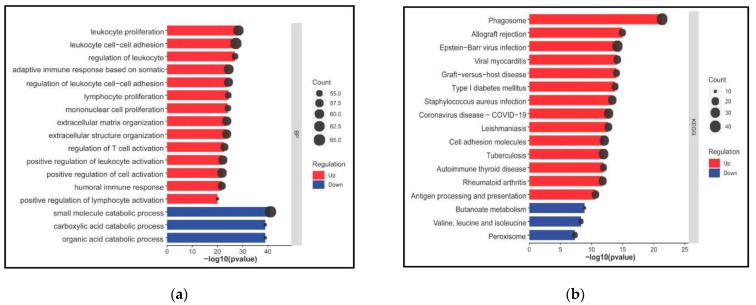
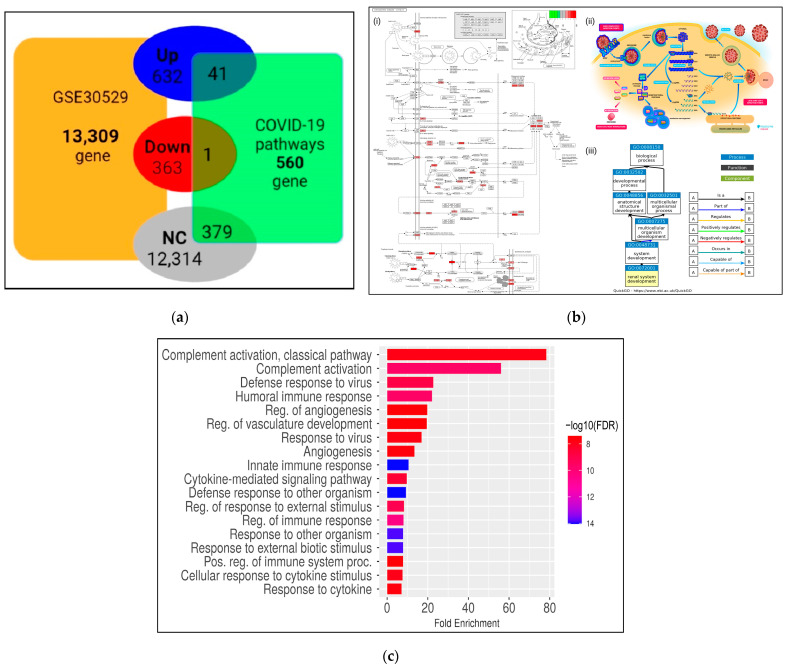
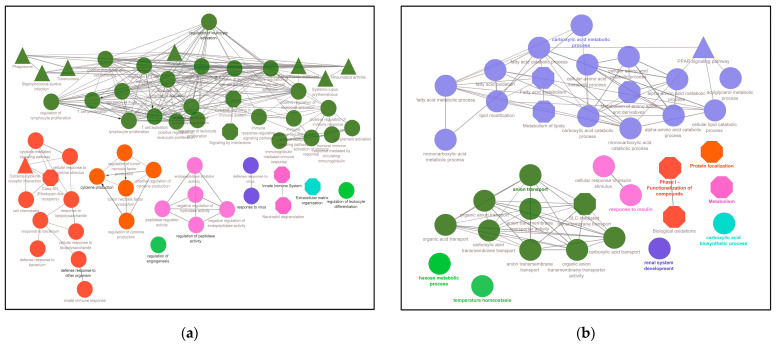
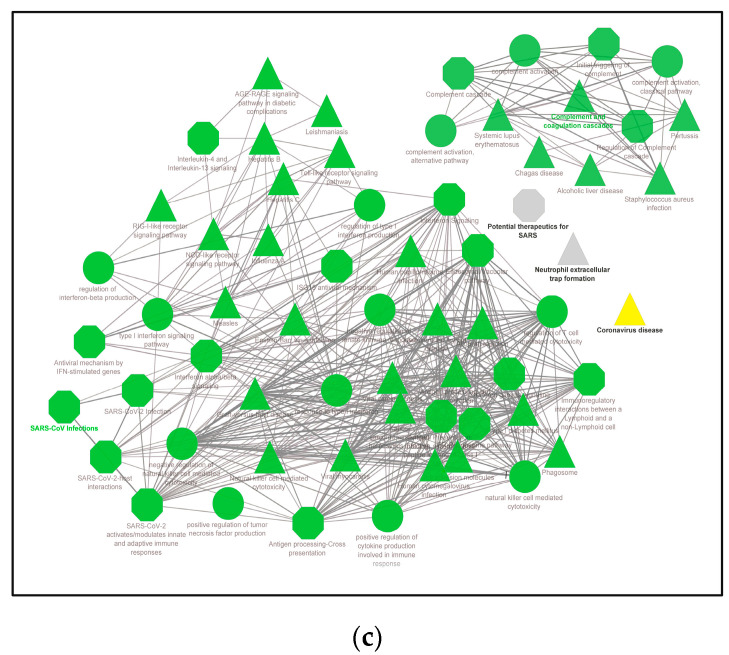
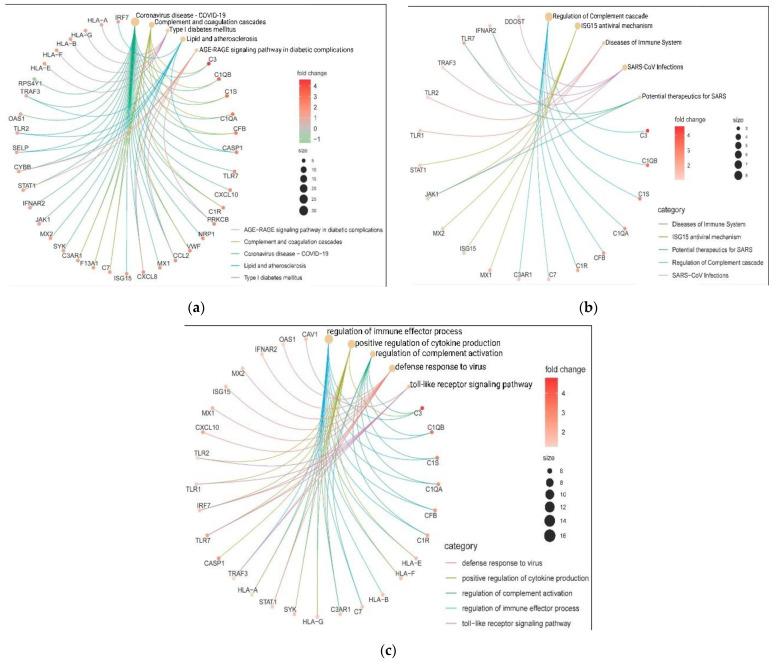
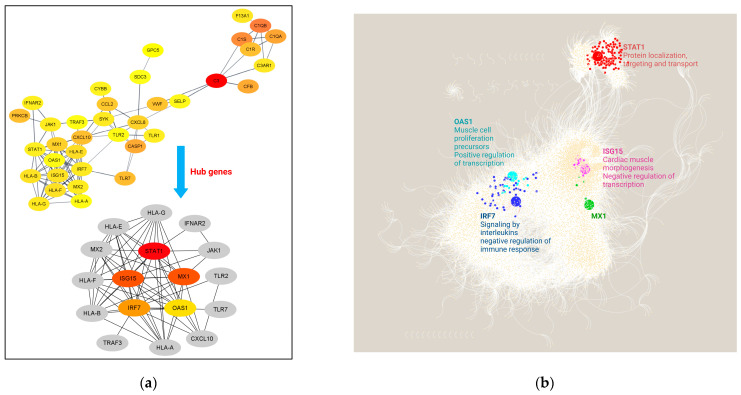
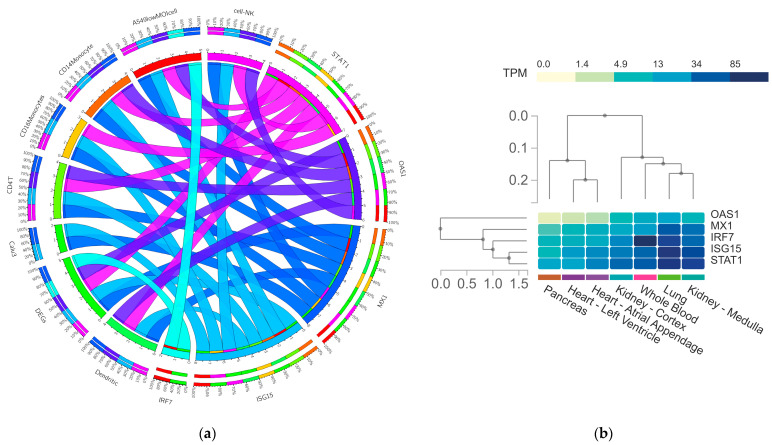
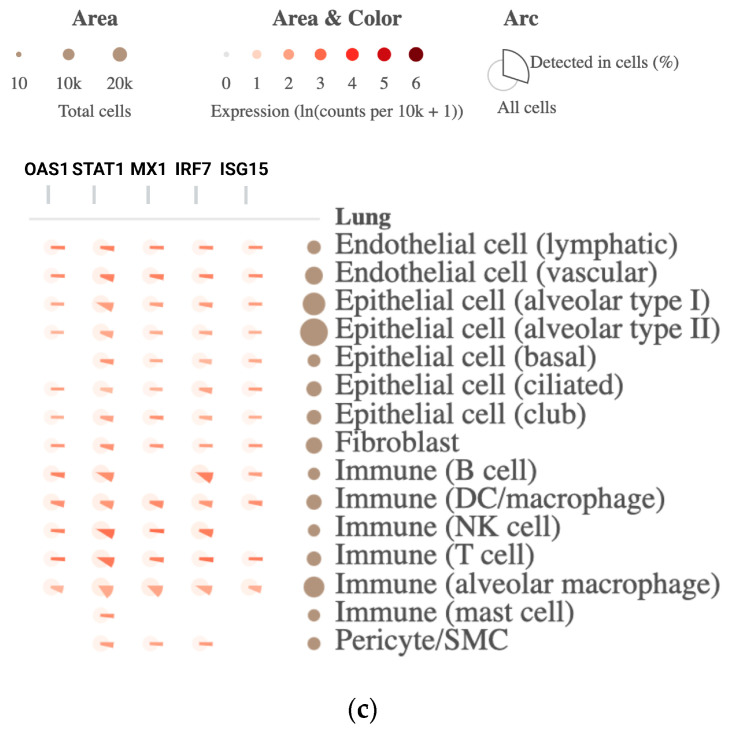
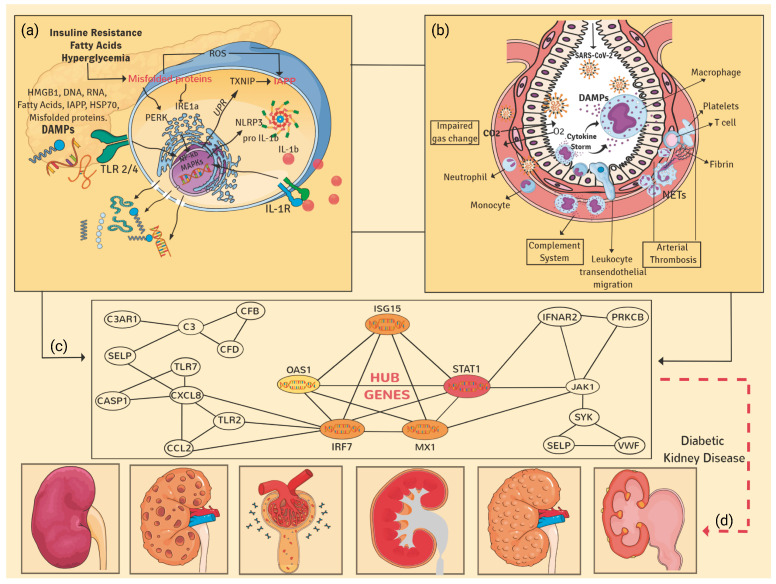
Diabetic kidney disease (DKD) is a frequently chronic kidney pathology derived from diabetes comorbidity. This condition has irreversible damage and its risk factor increases with SARS-CoV-2 infection. The prognostic outcome for diabetic patients with COVID-19 is dismal, even with intensive medical treatment. However, there is still scarce information on critical genes involved in the pathophysiological impact of COVID-19 on DKD. Herein, we characterize differential expression gene (DEG) profiles and determine hub genes undergoing transcriptional reprogramming in both disease conditions. Out of 995 DEGs, we identified 42 shared with COVID-19 pathways. Enrichment analysis elucidated that they are significantly induced with implications for immune and inflammatory responses. By performing a protein-protein interaction (PPI) network and applying topological methods, we determine the following five hub genes: STAT1, IRF7, ISG15, MX1 and OAS1. Then, by network deconvolution, we determine their co-expressed gene modules. Moreover, we validate the conservancy of their upregulation using the Coronascape database (DB). Finally, tissue-specific regulation of the five predictive hub genes indicates that OAS1 and MX1 expression levels are lower in healthy kidney tissue. Altogether, our results suggest that these genes could play an essential role in developing severe outcomes of COVID-19 in DKD patients.

Keywords: COVID-19; diabetic kidney disease; hub genes; in silico analysis; metabolic pathways; potential therapeutic.


Conflict of interest statement

The authors declare no conflict of interest.

Figures

Figure 1
Figure 1
Bioinformatics pipeline for obtaining predictive hub genes involved in the pathophysiological impact of COVID-19 on DKD condition. Highlighted in yellow are the steps to perform the transcriptomics analysis, while those in blue are steps for the interactomics methodology. First, transcriptomic data were acquired from the NCBI GEO database. Data were pre-processed and outlier detection with WGCNA analysis was performed. Then, we obtained the DEGs and determined their potential functional roles in biological and molecular pathways. Those DEGs that overlapped among COVID-19 and DKD pathways were selected and interactome analysis was performed using protein–protein interaction (PPI) associations. Subsequently, the potential hub genes were identified using the Maximal Clique Centrality (MCC) topological algorithm. Then, their co-expressed gene modules were determined using the Corto algorithm. Finally, hub gene expression was validated using analysis of systems levels employing the Coronascape COVID-19 datasets and gene expression value comparisons in healthy tissues using the GTEx database.
Figure 2
Figure 2
Pre-processing of GSE30529 dataset raw microarray data and differential expression analysis. (a) Boxplot of normalized raw data contrasting human patient healthy and DKD samples from kidney tubule. (b) PCA plots depict similarities and differences among DKD and control samples after data normalization. (c) WGCNA clustering represents 20 gene modules and two clusters. (d) Volcano plot of DEG, red (up) and blue (down) colored dots indicate the DEGs, while the grey dots represent genes without expression changes (NC) among DKD and control samples.
Figure 3
Figure 3
Top upregulated and downregulated DEGs in diabetic kidney disease dataset. Bars show the top upregulated (red) and downregulated (blue) genes, according to Log2FC values.
Figure 4
Figure 4
Functional enrichment analysis of DEGs. (a) Gene Ontology biological processes and (b) KEGG pathways. Bars for upregulated are colored in red while downregulated are depicted in blue.
Figure 5
Figure 5
Identification of upregulated genes in DKD associated with COVID-19 pathways. (a) Diagram of overlapping DEGs among DKD and the COVID-19 pathways. The intersection of 41 genes in the COVID-19 pathway is shown. (b) (i) The KEGG pathway map hsa05171 is involved in Coronavirus disease-COVID-19. The rectangle in red color (light to dark), according to log Log2FC, indicates the upregulated DEGs overlapping DKD and COVID-19. (ii) the Reactome pathway R-hsa-9694516 and (iii) the GO term corresponding to renal system development. (c) Functional enrichment analysis of the shared genes among DKD and COVID-19 pathways. FDR is calculated based on a nominal p-value from the hypergeometric test. Fold Enrichment is defined as the percentage of DEGs belonging to a pathway divided by the corresponding percentage in the background. FDR reports how likely the Enrichment is by chance. Higher values are colored on a scale of red to blue. In the x-axis, Fold Enrichment indicates how drastically genes of a specific pathway are overrepresented.
Figure 6
Figure 6
Network analysis of the functional role of deregulated genes in diabetic kidney disease. (a) Inter-relational pathway enrichment analysis is shown for the upregulated DEGs in DKD samples; (b) for the downregulated DEGs in DKD; (c) for the 41 DEGs overlapping DKD and COVID-19 pathways. Circle represents GO terms, triangle and octagon represent KEGG and REACTOME, respectively, while green, orange, purple and pink color represent pathways.
Figure 6
Figure 6
Network analysis of the functional role of deregulated genes in diabetic kidney disease. (a) Inter-relational pathway enrichment analysis is shown for the upregulated DEGs in DKD samples; (b) for the downregulated DEGs in DKD; (c) for the 41 DEGs overlapping DKD and COVID-19 pathways. Circle represents GO terms, triangle and octagon represent KEGG and REACTOME, respectively, while green, orange, purple and pink color represent pathways.
Figure 7
Figure 7
Category cnetplot depicts the linkages of upregulated genes and the biological pathways as a network. Cnetplot of (a) KEGG, (b) Reactome, and (c) Biological process shows the pathways and associated 41 up-DEGs networks. Red (light to dark) nodes indicate the Log2FC values, while yellow nodes indicate the functional enriched pathways whose size represents the number of genes that are DEGs in each of them.
Figure 8
Figure 8
Interactome analysis of shared DEGs among DKD and COVID-10 pathways. (a) PPI network of DEGs and their closest interactors. Edges represent experimental validated interactions among proteins with a high score value (0.7). Hub genes were retrieved from cytoHubba and are shown according to score nodes (from yellow to red); (b) Interactome of the five identified hubs genes. Each node represents a gene and the edges between nodes represent regulatory interactions among genes. The big, highlighted nodes with specific color represent each of the hub genes, while nodes sharing the same color surrounding these represent co-expressed gene modules. Enriched biological processes of each module are depicted in the same color as well. STAT1 (red); OAS1 (turquoise); ISG15 (pink); IRF7 (navy blue); MX1 (green).
Figure 9
Figure 9
In-silico validation of gene expression of hub genes across other databases. (a) Circa plot depicts the number of shared DEGS across the 8 types of COVID-19 datasets under study. In the hemisphere, the 5 hub DEGs are represented by an arc: OAS1, STAT1, CXCL10, ISG15 and MX1. The inner arcs represent the distribution of the hub genes in each COVID-19 dataset, while the outside arcs represent the intersection of both hemispheres on a scale of 0–100%. Data was obtained from the Coronascape database including dendritic cells, Calu3, CD4T, CD16 monocytes, CD14 monocytes, NK cells and A549lowMOI cell samples (https://metascape.org/COVID/, accessed on 14 September 2022). (b) Heatmap comparison of hub ‘ healthy tissue expression and (c) lung single-cell expression using the GTEx DB (https://www.gtexportal.org, accessed on 16 September 2022).
Figure 9
Figure 9
In-silico validation of gene expression of hub genes across other databases. (a) Circa plot depicts the number of shared DEGS across the 8 types of COVID-19 datasets under study. In the hemisphere, the 5 hub DEGs are represented by an arc: OAS1, STAT1, CXCL10, ISG15 and MX1. The inner arcs represent the distribution of the hub genes in each COVID-19 dataset, while the outside arcs represent the intersection of both hemispheres on a scale of 0–100%. Data was obtained from the Coronascape database including dendritic cells, Calu3, CD4T, CD16 monocytes, CD14 monocytes, NK cells and A549lowMOI cell samples (https://metascape.org/COVID/, accessed on 14 September 2022). (b) Heatmap comparison of hub ‘ healthy tissue expression and (c) lung single-cell expression using the GTEx DB (https://www.gtexportal.org, accessed on 16 September 2022).
Figure 10
Figure 10
Pathophysiological impact of COVID-19 on DKD condition. (a) An illustration that simplifies the multiple processes and proinflammatory pathways that initiate in an orchestrated manner, the primary stage of the chronic inflammatory response in pancreatic cells coupled with the activation of the complement system due to the presence of DAMPs, excessive synthesis of ROS and dysfunction endothelial, contribute to the progression of DM and the development of micro- and macrovascular complications in target organs, (b) pathogen-host interaction mechanisms, showing the alveolar microenvironment, where the localized inflammatory response is initiated by the presence of PAMPs and DAMPs, with the consequent endothelial activation, migration of immune cells, significant tissue damage and uncontrolled release of cytokines, as well as proinflammatory interleukins (cytokine storm). (c) Predictive hub genes and their impact on the pathophysiological process of diabetic kidney disease and SARS-CoV-2 infection; (d) representation of the multiple functional and morphological alterations in renal tissue due to dysfunction of podocytes, epithelial cells, endothelial cells and local macrophages, events that ultimately triggers the development of glomerular sclerosis, hyalinosis, deposition in the mesangial extracellular matrix and local fibrosis, alterations which together increased renal filtration, precipitation of glomerular nephrosis, acute kidney injury and progressive chronic kidney disease (CKD), among others comorbidities.

Similar articles

Cited by

References

    1. Papatheodorou K., Banach M., Edmonds M., Papanas N., Papazoglou D. Complications of diabetes. J. Diabetes Res. 2015;2015:189525. doi: 10.1155/2015/189525. - DOI - PMC - PubMed
    1. Avogaro A., Fadini G.P. Microvascular complications in diabetes: A growing concern for cardiologists. Int. J. Cardiol. 2019;291:29–35. doi: 10.1016/j.ijcard.2019.02.030. - DOI - PubMed
    1. de Boer I.H., Caramori M.L., Chan J.C., Heerspink H.J., Hurst C., Khunti K., Liew A., Michos E.D., Navaneethan S.D., Olowu W.A. KDIGO 2020 clinical practice guideline for diabetes management in chronic kidney disease. Kidney Int. 2020;98:S1–S115. doi: 10.1016/j.kint.2020.06.019. - DOI - PubMed
    1. Tye S.C., Denig P., Heerspink H.J. Precision medicine approaches for diabetic kidney disease: Opportunities and challenges. Nephrol. Dial. Transpl. 2021;36:ii3–ii9. doi: 10.1093/ndt/gfab045. - DOI - PMC - PubMed
    1. Yang X., Yu Y., Xu J., Shu H., Liu H., Wu Y., Zhang L., Yu Z., Fang M., Yu T. Clinical course and outcomes of critically ill patients with SARS-CoV-2 pneumonia in Wuhan, China: A single-centered, retrospective, observational study. Lancet Respir. Med. 2020;8:475–481. doi: 10.1016/S2213-2600(20)30079-5. - DOI - PMC - PubMed

Publication types