. 2022 Nov 29;24(12):1747.
doi: 10.3390/e24121747.

VeVaPy, a Python Platform for Efficient Verification and Validation of Systems Biology Models with Demonstrations Using Hypothalamic-Pituitary-Adrenal Axis Models

Affiliations

VeVaPy, a Python Platform for Efficient Verification and Validation of Systems Biology Models with Demonstrations Using Hypothalamic-Pituitary-Adrenal Axis Models

Christopher Parker et al. Entropy (Basel). .

Abstract

In order for mathematical models to make credible contributions, it is essential for them to be verified and validated. Currently, verification and validation (V&V) of these models does not meet the expectations of the system biology and systems pharmacology communities. Partially as a result of this shortfall, systemic V&V of existing models currently requires a lot of time and effort. In order to facilitate systemic V&V of chosen hypothalamic-pituitary-adrenal (HPA) axis models, we have developed a computational framework named VeVaPy-taking care to follow the recommended best practices regarding the development of mathematical models. VeVaPy includes four functional modules coded in Python, and the source code is publicly available. We demonstrate that VeVaPy can help us efficiently verify and validate the five HPA axis models we have chosen. Supplied with new and independent data, VeVaPy outputs objective V&V benchmarks for each model. We believe that VeVaPy will help future researchers with basic modeling and programming experience to efficiently verify and validate mathematical models from the fields of systems biology and systems pharmacology.

Keywords: HPA axis; Major Depressive Disorder; Python; Verification & Validation; differential equations model; stress test.


Conflict of interest statement

The authors declare no conflict of interest.

Figures

Figure 1
Figure 1
Timeline of hypothalamic-pituitary-adrenal (HPA) axis modeling. Models included, in chronological order: Goodwin [18], Veldhuis et al. [19], Gonzalez-Heydrich et al. [20], Liu et al. [21], Bairagi et al. [22], Sriram et al. [23], Andersen et al. [24], Malek et al. [25], Bangsgaard & Ottesen [26], and Somvanshi et al. [27].
Figure 2
Figure 2
Simplified diagram of VeVaPy, showing inputs and outputs of the tool.
Figure 3
Figure 3
Code diagram of VeVaPy.
Figure 4
Figure 4
Mean of MDD (blue) and Control (orange) Patients’ Trier social stress test (TSST) data. Adrenocorticotropic hormone (ACTH) concentration (top) and cortisol concentration (bottom) are graphed without any model simulations. Vertical bars indicate standard deviation at each data point.
Figure 5
Figure 5
Trier social stress test (TSST) data from (A) patient 1 and (B) patient 40. Adrenocorticotropic hormone (ACTH) concentrations (top) and cortisol concentrations (bottom) are graphed without any model simulations.
Figure 6
Figure 6
Sriram et al. [23] model without parameter optimization vs. Trier social stress test (TSST) data from patient 40. Graphs include model simulations of corticotropin-releasing hormone (CRH) concentration (upper left, blue), adrenocorticotropic hormone (ACTH) concentration (upper right, blue), cortisol concentration (lower right, blue) and bound glucocorticoid receptor (GR) concentration (lower left, blue) against ACTH concentration (upper right, orange) and cortisol concentration (lower right, orange) from patient 40. The blue lines represent the average of 5 iterations of the parameter optimization algorithm.
Figure 7
Figure 7
Sriram et al. [23] model vs. Trier social stress test (TSST) data from patient 40. Graphs include model simulations of corticotropin-releasing hormone (CRH) concentration (upper left, blue), adrenocorticotropic hormone (ACTH) concentration (upper right, blue), cortisol concentration (lower right, blue) and bound glucocorticoid receptor (GR) concentration (lower left, blue) against ACTH concentration (upper right, orange) and cortisol concentration (lower right, orange) from patient 40. The blue lines represent the average of 5 iterations of the parameter optimization algorithm.
Figure 8
Figure 8
Bangsgaard et al. [26] model without parameter optimization vs. Trier social stress test (TSST) data from patient 40. Graphs include model simulations of corticotropin-releasing hormone (CRH) concentration (left, blue), adrenocorticotropic hormone (ACTH) concentration (upper right, blue) and cortisol concentration (lower right, blue) against ACTH concentration (upper right, orange) and cortisol concentration (lower right, orange) from the patient 40. The blue lines represent the average of 5 iterations of the parameter optimization algorithm.
Figure 9
Figure 9
Bangsgaard et al. [26] model vs. Trier social stress test (TSST) data from patient 40. Graphs include model simulations of corticotropin-releasing hormone (CRH) concentration (left, blue), adrenocorticotropic hormone (ACTH) concentration (upper right, blue) and cortisol concentration (lower right, blue) against ACTH concentration (upper right, orange) and cortisol concentration (lower right, orange) from the patient 40. The blue lines represent the average of 5 iterations of the parameter optimization algorithm.
Figure 10
Figure 10
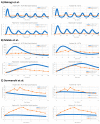
Further examples of models with and without parameter optimization. Simulated concentrations are in blue, patient 40 data is in orange. The left column of graphs shows the models running simulations with the parameters from the publication, while the right column of graphs shows the models running simulations with optimized parameters. Demonstrated models are (A) Bairagi et al. [22], (B) Malek et al. [25], (C) Somvanshi et al. [27].
Figure 11
Figure 11
Model validation figures for all five demonstration models against the mean of all MDD patients in the Nelson TSST data. Models depicted are: (A) Bairagi et al. [22], (B) Bangsgaard & Ottesen [26], (C) Malek et al. [25], (D) Somvanshi et al. [27], (E) Sriram et al. [23].
Figure 12
Figure 12
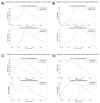
Results of Using Optimized Parameters in Generalized Cases. (A) The optimized parameter sets have some cases where they perform reasonably well (especially against patients from the same group). (B) Some of the parameter sets match certain patients very poorly, such as the parameters optimized against the mean of all MDD patients against patient 39 (MDD/neither subtype). (C) Many of the simulations matched either ACTH or cortisol but did not match the other. Parameters optimized against patient 40 (MDD/neither subtype) match the general cortisol concentration trend from patient 13 (MDD/atypical), but the simulated ACTH concentration is extremely high. (D) Similar to C, but with simulated cortisol concentration not matching while simulated ACTH concentration follows the correct general trend. Simulation run with parameters optimized against patient 50 (MDD/atypical), shown with data from patient 6 (MDD/atypical).

Similar articles

Cited by

References

    1. Thacker B.H., Doebling S.W., Hemez F.M., Anderson M.C., Pepin J.E., Rodriguez E.A. In: Concepts of Model Verification and Validation. Schaller C., editor. US Department of Energy, Los Alamos National Laboratory; Los Alamos, NM, USA: 2004. Report No.: LA-14167-MS;
    1. IWGFR . Specialists’ Meeting on Predictions and Experience of Core Distortion Behaviour 1–4 October 1984. International Atomic Energy Agency; Wilmslow, UK: 1984.
    1. Nakagawa M. Verification and Validation of Core Mechanical Performance Code ARKAS with IAEA Benchmark Problems, (II) J. Nucl. Sci. Technol. 1993;30:389–412. doi: 10.1080/18811248.1993.9734497. - DOI
    1. Hohne T., Kliem S., Bieder U. IAEA CRP benchmark of ROCOM PTS test case for the use of CFD in reactor design using the CFD-Codes ANSYS CFX and TrioCFD. Nucl. Eng. Des. 2018;333:161–180. doi: 10.1016/j.nucengdes.2018.04.017. - DOI
    1. Schwer L.E. An overview of the PTC 60/V&V 10: Guide for verification and validation in computational solid mechanics. Eng. Comput. 2007;23:245–252. doi: 10.1007/s00366-007-0072-z. - DOI

LinkOut - more resources