

Evaluation of Emergency Response Capacity of Urban Pluvial Flooding Public Service Based on Scenario Simulation
- PMID: 36554422
- PMCID: PMC9779634
- DOI: 10.3390/ijerph192416542
Evaluation of Emergency Response Capacity of Urban Pluvial Flooding Public Service Based on Scenario Simulation
Abstract
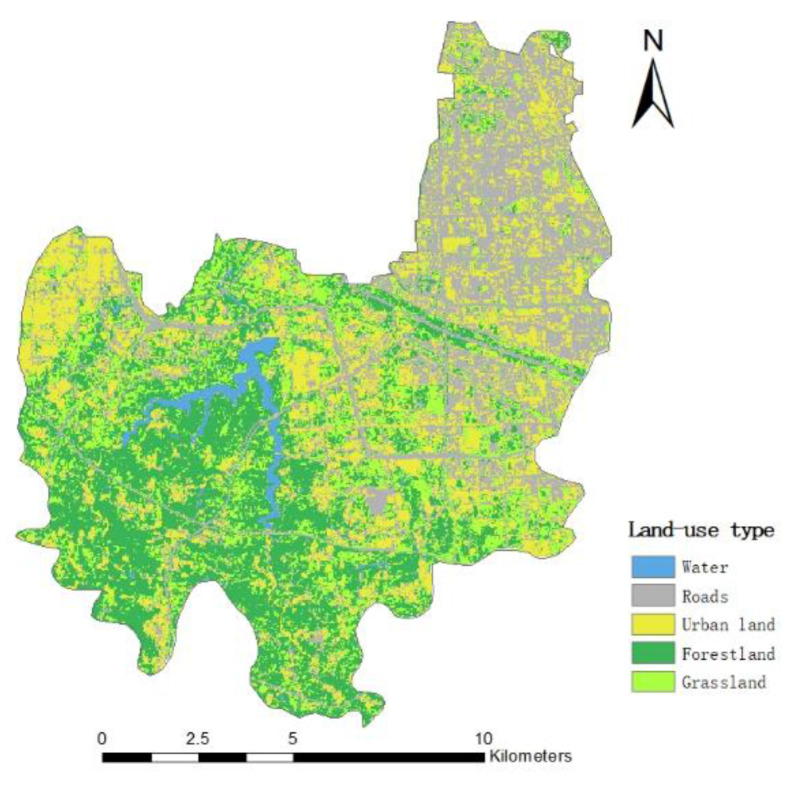
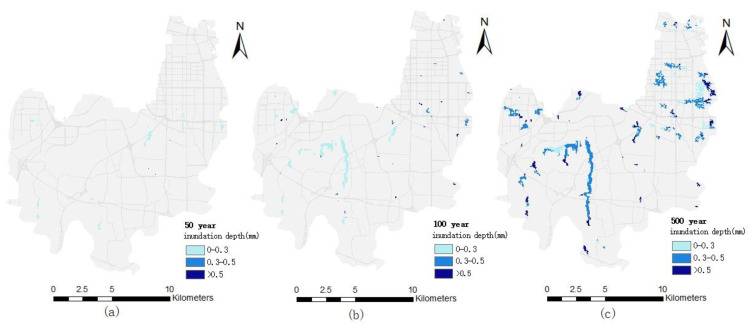
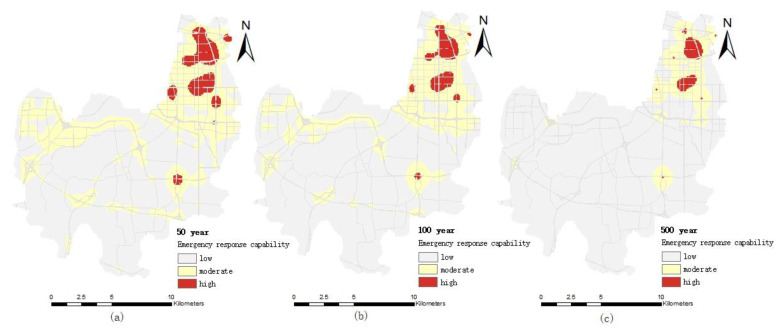
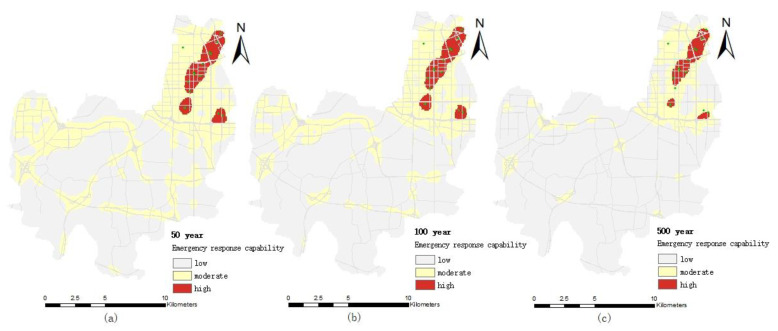
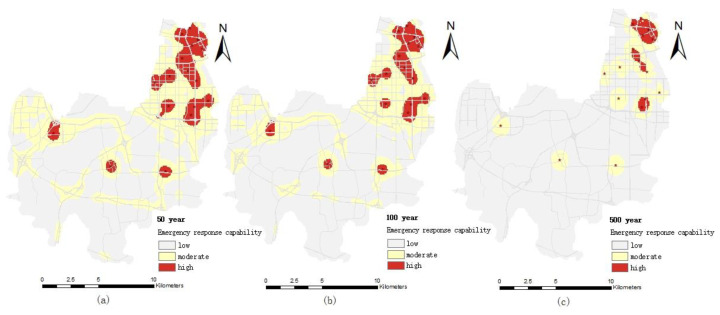
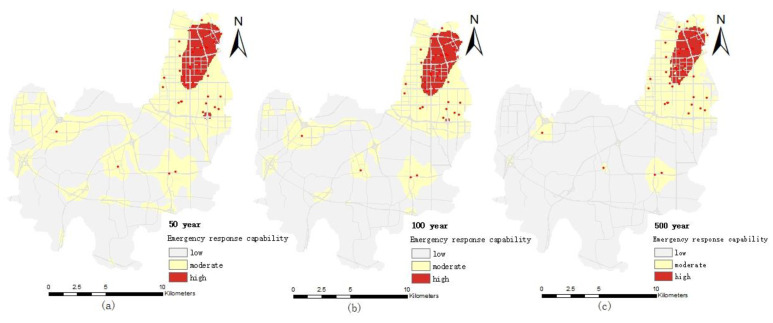
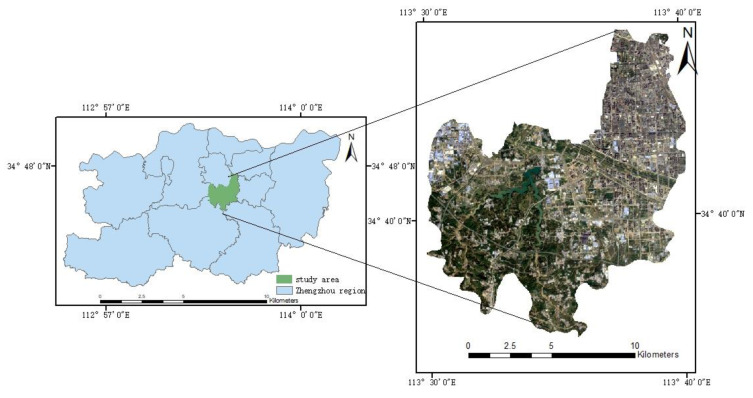
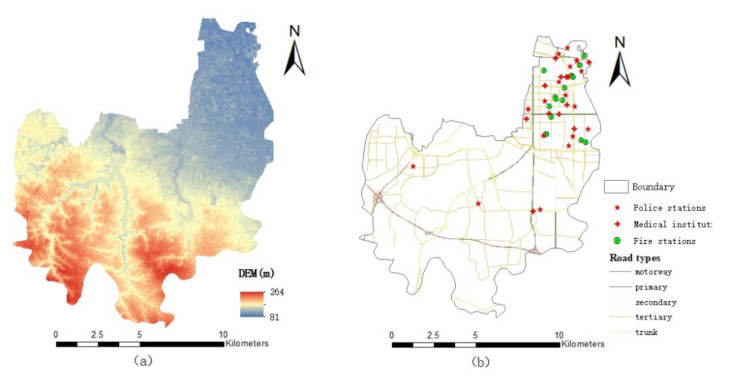
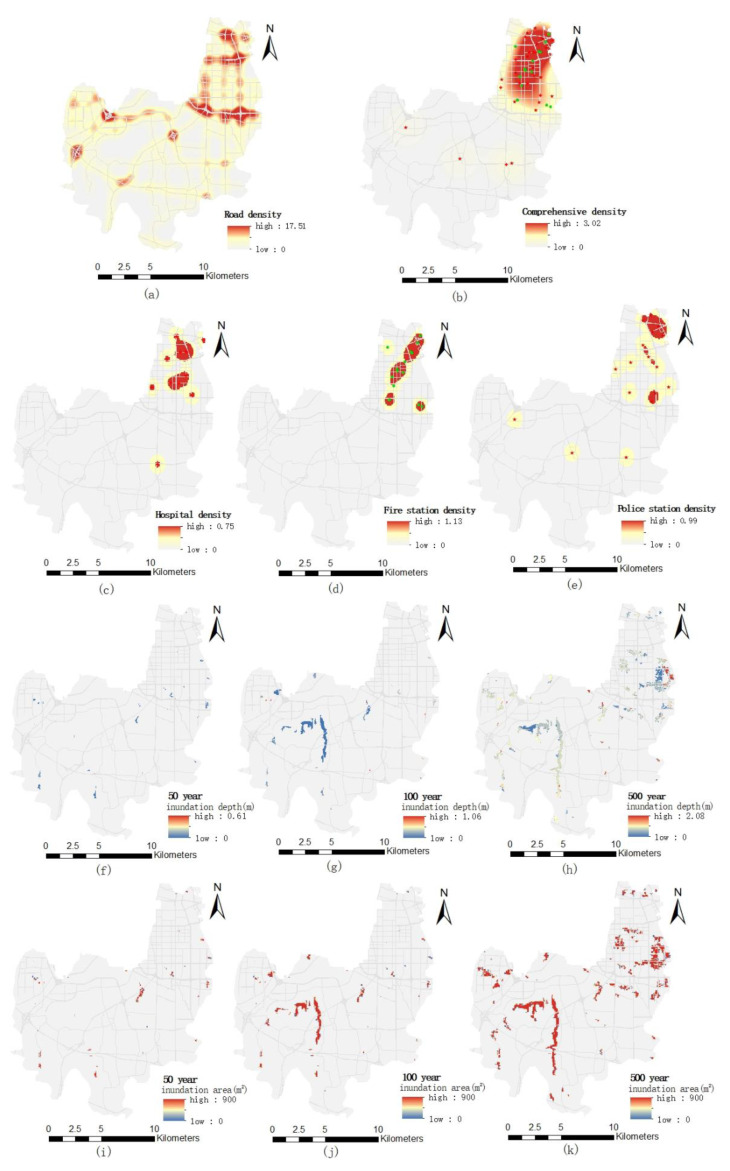
The evaluation of emergency response capability under different pluvial flooding scenarios is an essential approach to improve the emergency response capability of flood disasters. A new evaluation method of emergency response capacity of urban public services is proposed based on urban pluvial flooding scenario simulation. Firstly, inundation area and depth under different pluvial flooding scenarios are simulated based on the SCS-CN model. Following that, space densities of all indicators include inundation area and depth, road network and the emergency public service institutions. Then, the indicator weight is determined by the combined weighting method of entropy weight and coefficient of variation. Finally, the emergency response capacity index (of each pixel) is calculated based on the graph stacking method. Taking Erqi District, Zhengzhou City as an example, the emergency response capacity of public service under different urban flooding scenarios is evaluated. The results show that the spatial distribution difference of public service emergency response capacity in Erqi District, Zhengzhou City is obvious, and with the increase of the precipitation return period, the high value area of public service emergency response capability decreases gradually and the low value area increases gradually. This method takes into account the specific urban flooding scenario and the layout of public service institutions and road networks that have strong practicability. the results of the evaluation can provide a reference for the construction of urban flood emergency response capacity and provide support for emergency decision-making.
Keywords: GIS; accessibility; capacity evaluation; emergency response; scenario simulation; urban pluvial flooding.
Conflict of interest statement
The authors declare no conflict of interest.
Figures
Similar articles
-
Urban flooding resilience evaluation with coupled rainfall and flooding models: a small area in Kunming City, China as an example.Water Sci Technol. 2023 Jun;87(11):2820-2839. doi: 10.2166/wst.2023.149. Water Sci Technol. 2023. PMID: 37318926
-
Exploring the network structure of coupled green-grey infrastructure to enhance urban pluvial flood resilience: A scenario-based approach focusing on 'centralized' and 'decentralized' structures.J Environ Manage. 2024 Nov;370:122344. doi: 10.1016/j.jenvman.2024.122344. Epub 2024 Sep 8. J Environ Manage. 2024. PMID: 39244928
-
Study on the response analysis of LID hydrological process to rainfall pattern based on framework for dynamic simulation of urban floods.J Environ Manage. 2024 Feb;351:119953. doi: 10.1016/j.jenvman.2023.119953. Epub 2024 Jan 5. J Environ Manage. 2024. PMID: 38181681
-
Navigating the definition of urban flooding: A conceptual and systematic review of the literature.Water Sci Technol. 2024 Nov;90(10):2796-2812. doi: 10.2166/wst.2024.351. Epub 2024 Oct 23. Water Sci Technol. 2024. PMID: 39612175
-
Real-Time Early Warning System Design for Pluvial Flash Floods-A Review.Sensors (Basel). 2018 Jul 12;18(7):2255. doi: 10.3390/s18072255. Sensors (Basel). 2018. PMID: 30002358 Free PMC article. Review.
Cited by
-
Comprehensive evaluation of the effectiveness of endemic disease prevention and control in Jiangsu Province, China, 2013-2022.Front Public Health. 2023 Nov 3;11:1271765. doi: 10.3389/fpubh.2023.1271765. eCollection 2023. Front Public Health. 2023. PMID: 38026345 Free PMC article.
References
-
- Yin J., Yu D., Yin Z., Liu M., He Q. Evaluating the impact and risk of pluvial flash flood on intra-urban road network: A case study in the city center of Shanghai, China. J. Hydrol. 2016;537:138–145. doi: 10.1016/j.jhydrol.2016.03.037. - DOI
-
- IPCC . Climate Change 2013: Physical Science Base. Cambridge University Press; Cambridge, UK: 2014.
-
- Zhang Y.L., Chen L. Emergency materials reserve of government for natural disasters. Nat. Hazards. 2015;81:41–54. doi: 10.1007/s11069-015-2065-3. - DOI
-
- Zhong Y. Retraction Note: A flood disaster relief emergency material distribution strategy based on people’s psychological perception. Arab. J. Geosci. 2021;14:2770. doi: 10.1007/s12517-021-09185-7. - DOI
Publication types
MeSH terms
LinkOut - more resources
Full Text Sources
Medical
