

The Nutrition Transition and the Double Burden of Malnutrition in Sub-Saharan African Countries: How Do These Countries Compare with the Recommended LANCET COMMISSION Global Diet?
- PMID: 36554669
- PMCID: PMC9779835
- DOI: 10.3390/ijerph192416791
The Nutrition Transition and the Double Burden of Malnutrition in Sub-Saharan African Countries: How Do These Countries Compare with the Recommended LANCET COMMISSION Global Diet?
Abstract
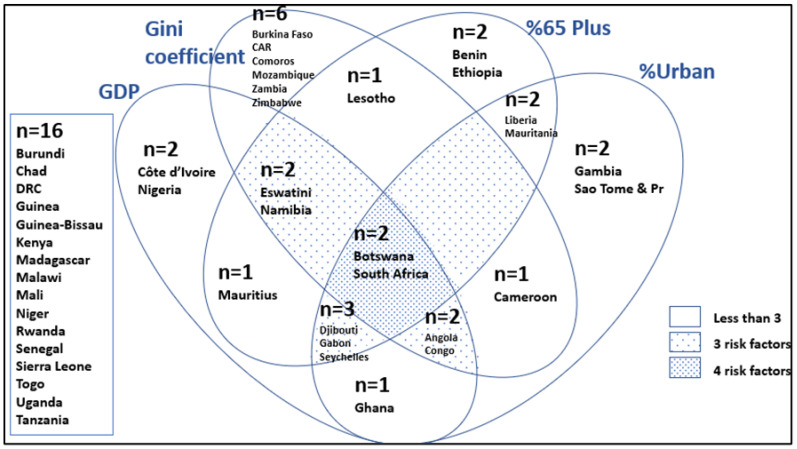
Background: Over the last two decades, many sub-Saharan African (SSA) countries have undergone dietary and nutrition transitions fuelled by rapid urbanisation, economic development, and globalisation. The aim of the current study was to examine outcomes of the nutrition transition and the epidemiologic transition in SSA countries in terms of food intake, health, and socioeconomic and development factors.
Methods: Food balance sheet data-specifically, per capita energy intake per day and per capita gram intake per day-from the CountrySTAT framework of the Food and Agricultural Organization (FAO) were analysed for major food commodities. Additionally, selected health and development indicators supplied by UNICEF, the WHO and the World Bank were analysed.
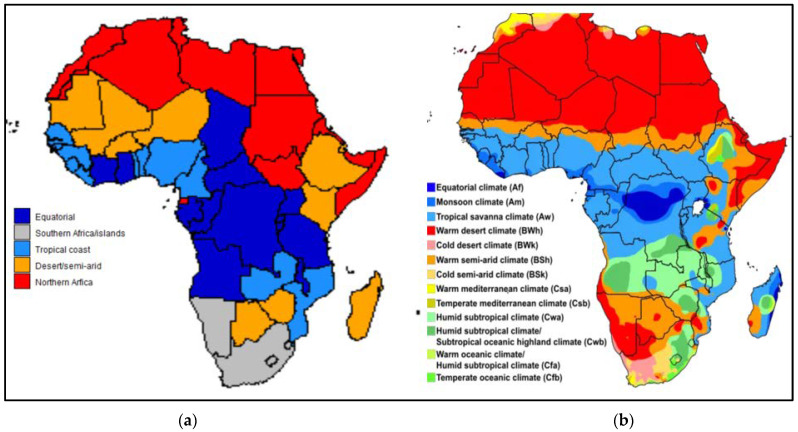
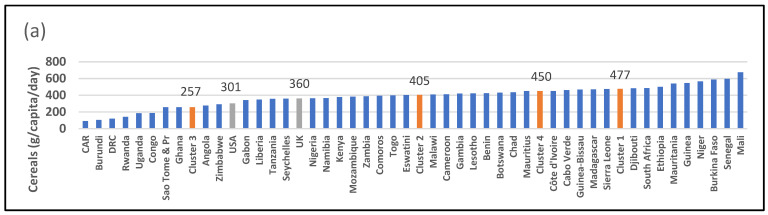
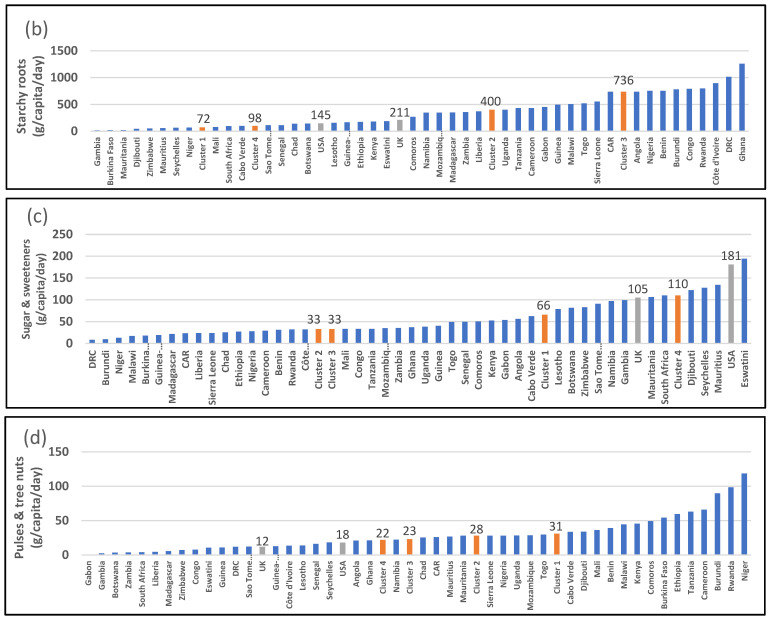
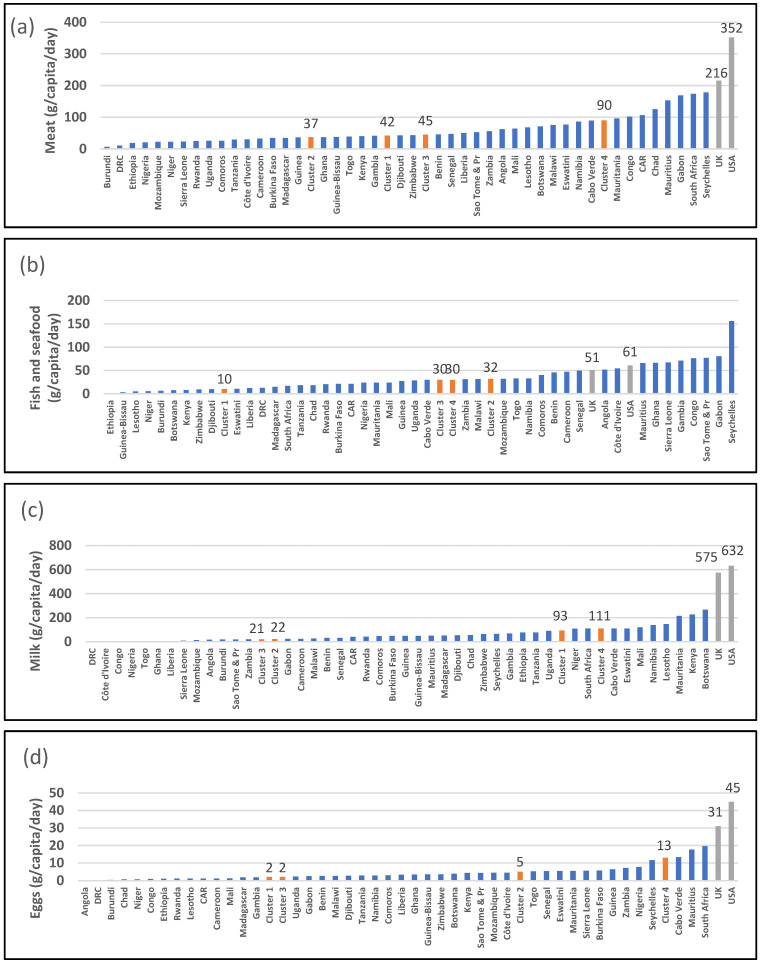
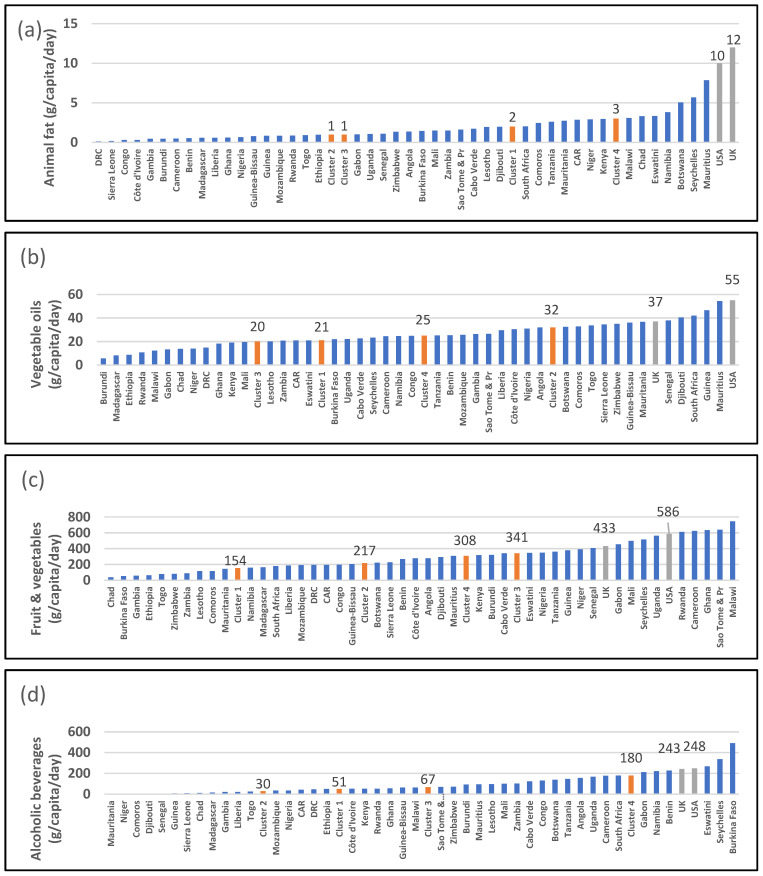
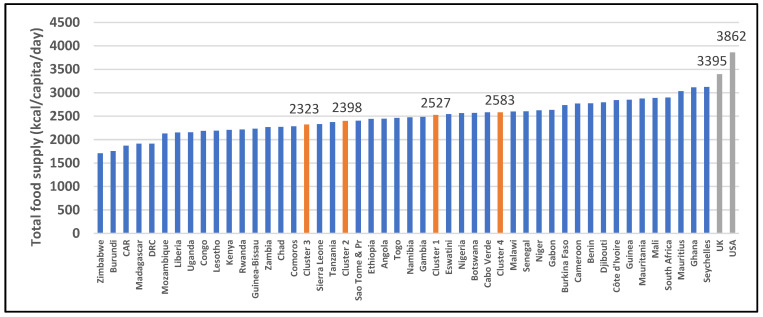
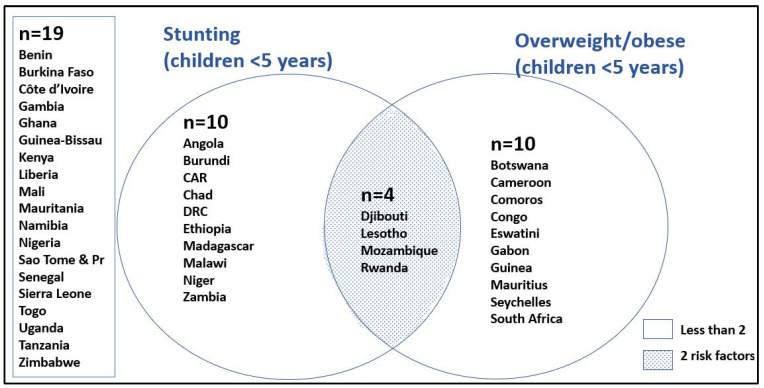
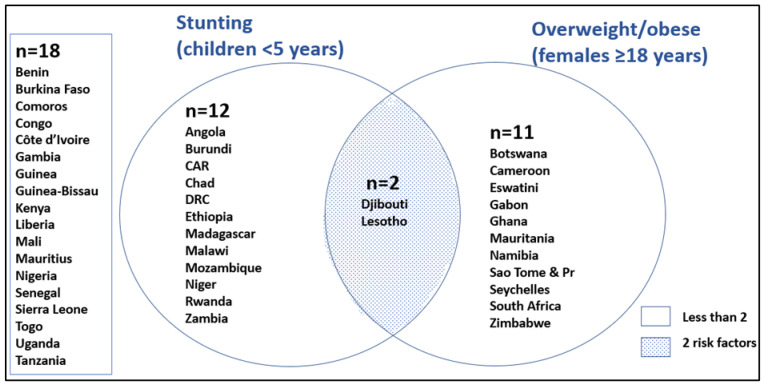
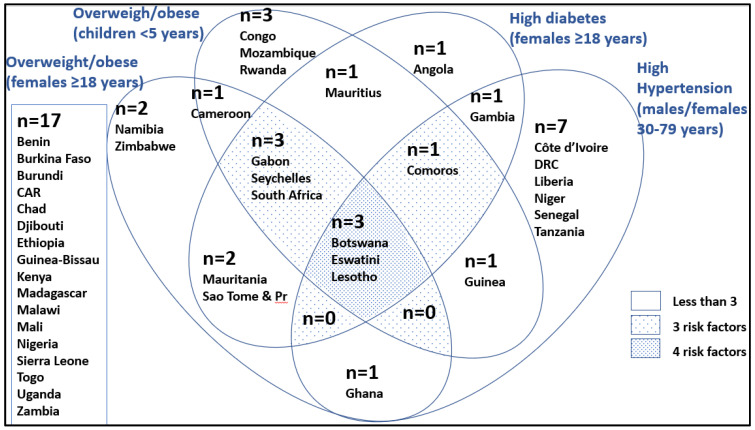
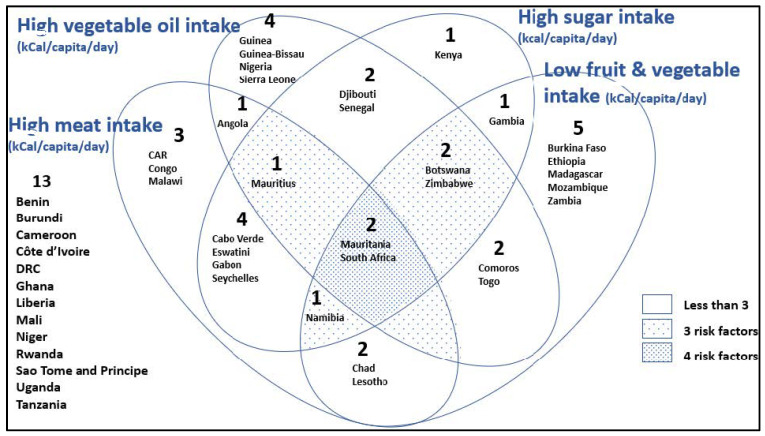
Results: Four dietary patterns emerged. The diet of the southern African/island cluster (South Africa, Mauritius, Eswatini, Namibia, Cabo Verde, and the outlier Seychelles) resembles a Westernised diet, with median values high on sugar/sweeteners, alcohol, meat, animal fats, eggs, and dairy. On the other hand, the diet of countries in the other three clusters appears to be more traditional, with countries in the desert/semi-arid cluster consuming more cereals and pulses/tree nuts, countries in the tropical coastal cluster consuming more fish and vegetable oils, and countries in the equatorial cluster consuming more starchy roots and fruit and vegetables. The resulting median values of health indicators also indicate a higher prevalence of non-communicable diseases in the southern African/island cluster, whereas stunting and anaemia are higher in the other three clusters.
Conclusions: SSA countries are in different stages of the nutrition transition. By superimposing clusters generated using macronutrient intake values on a map of the climatic regions in Africa, one can clearly see the importance of climate on the availability of food and food intake patterns. Climate change presents a great challenge to healthy eating, as the link between climate regions and diets is illustrated.
Keywords: climate change; diet; dietary patterns; double burden; food security; malnutrition; non-communicable diseases; sub-Saharan Africa.
Conflict of interest statement
The authors declare no conflict of interest.
Figures
Similar articles
-
An overview of the nutrition transition in West Africa: implications for non-communicable diseases.Proc Nutr Soc. 2015 Nov;74(4):466-77. doi: 10.1017/S0029665114001669. Epub 2014 Dec 22. Proc Nutr Soc. 2015. PMID: 25529539 Review.
-
Meat, fruit, and vegetable consumption in sub-Saharan Africa: a systematic review and meta-regression analysis.Nutr Rev. 2021 May 12;79(6):651-692. doi: 10.1093/nutrit/nuaa032. Nutr Rev. 2021. PMID: 32556305
-
A SARS-CoV-2 Surveillance System in Sub-Saharan Africa: Modeling Study for Persistence and Transmission to Inform Policy.J Med Internet Res. 2020 Nov 19;22(11):e24248. doi: 10.2196/24248. J Med Internet Res. 2020. PMID: 33211026 Free PMC article.
-
Obesity and the nutrition transition in Sub-Saharan Africa.Ann N Y Acad Sci. 2014 Apr;1311:88-101. doi: 10.1111/nyas.12433. Ann N Y Acad Sci. 2014. PMID: 24725148 Review.
-
Gaps between fruit and vegetable production, demand, and recommended consumption at global and national levels: an integrated modelling study.Lancet Planet Health. 2019 Jul;3(7):e318-e329. doi: 10.1016/S2542-5196(19)30095-6. Lancet Planet Health. 2019. PMID: 31326072 Free PMC article.
Cited by
-
Supporting community health workers in South Africa for context-specific food and nutrition literacy: implementation of a multi-media education-entertainment intervention.BMC Nutr. 2025 Jul 25;11(1):144. doi: 10.1186/s40795-025-01124-z. BMC Nutr. 2025. PMID: 40713911 Free PMC article.
-
Dietary Patterns, Socio-Demographic Predictors Thereof, and Associations of Dietary Patterns with Stunting and Overweight/Obesity in 1-<10-Year-Old Children in Two Economically Active Provinces in South Africa.Nutrients. 2023 Sep 25;15(19):4136. doi: 10.3390/nu15194136. Nutrients. 2023. PMID: 37836420 Free PMC article. Review.
-
The Role of Food Consumption in the Global Syndemic: A Scoping Review and Conceptual Model.Int J Environ Res Public Health. 2025 Jun 5;22(6):897. doi: 10.3390/ijerph22060897. Int J Environ Res Public Health. 2025. PMID: 40566324 Free PMC article.
-
Changes in food quality and habits in urban Ghana: evidence from a mixed-methods study.BMC Public Health. 2025 Jul 26;25(1):2556. doi: 10.1186/s12889-025-23751-8. BMC Public Health. 2025. PMID: 40713523 Free PMC article.
-
The effect of nutrition-specific and nutrition-sensitive interventions on the double burden of malnutrition in low-income and middle-income countries: a systematic review.Lancet Glob Health. 2024 Mar;12(3):e419-e432. doi: 10.1016/S2214-109X(23)00562-4. Epub 2024 Jan 29. Lancet Glob Health. 2024. PMID: 38301666 Free PMC article.
References
-
- Lottering S., Mafongoya P., Lottering R. Drought and its impacts on small-scale farmers in sub-Saharan Africa: A Review. S. Afr. Geogr. J. 2021;103:319–341. doi: 10.1080/03736245.2020.1795914. - DOI
-
- Aucoin C. Less Armed Conflict But More Political Violence in Africa. [(accessed on 24 October 2020)];Inst. Secur. Stud. 2017 Available online: https://issafrica.org/iss-today/less-armed-conflict-but-more-political-v....
-
- Bello-Schünemann J., Cilliers J., Donnenfeld Z., Aucoin C., Porter A. Policy Brief. African Futures: Key Trends to 2035. [(accessed on 24 October 2020)];Inst. Secur. Stud. 2017 Available online: https://www.africaportal.org/publications/african-futures-key-trends-2035/
-
- Laar A.K., Addo P., Aryeetey R., Agyemang C., Zotor F., Asiki G., Rampalli K.K., Amevinya G.S., Tandoh A., Nanema S., et al. Perspective: Food Environment Research Priorities for Africa—Lessons from the Africa Food. Environment Research Network. Adv. Nutr. 2022;13:739–747. doi: 10.1093/advances/nmac019. - DOI - PMC - PubMed
MeSH terms
LinkOut - more resources
Full Text Sources
Medical
Research Materials
