

Ecological Quality Evolution and Its Driving Factors in Yunnan Karst Rocky Desertification Areas
- PMID: 36554785
- PMCID: PMC9779387
- DOI: 10.3390/ijerph192416904
Ecological Quality Evolution and Its Driving Factors in Yunnan Karst Rocky Desertification Areas
Abstract
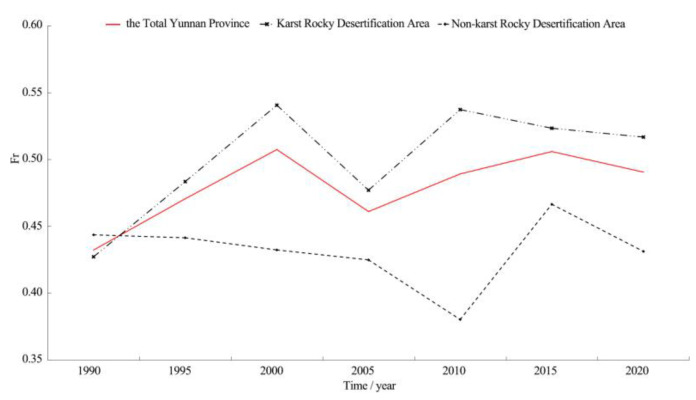
Rocky desertification is a key element affecting regional ecological quality. Rocky desertification in Southwest China directly affects the ecological security of the Yangtze River and Pearl River basins and also restricts regional economic and social development. In order to clarify the evolution laws and key influencing factors of ecological quality in Yunnan karst rocky desertification areas, a quantitative analysis based on the remote sensing-based ecological index (RSEI) model was conducted to explore the overall evolution characteristics and change laws of ecological quality in Yunnan karst rocky desertification areas in the past 30 years. The correlation between RSEI, rock outcrop rate (Fr), and driving factors was determined by redundancy analysis. The results showed the following: (1) RSEI in Yunnan karst rocky desertification areas generally showed a decreasing trend, with a fluctuation in the mid-term, followed by a tendency to recover. It fell into three stages: decline, trough, and recovery, with fitting coefficients of -0.121, -0.057, and 0.157, respectively. In contrast, Fr showed an opposite tendency, illustrating the inverse relationship between RSEI and Fr, and the rate of sequential succession was much faster than that of the reverse succession under human measures of intervention. (2) The mean value of RSEI of Yunnan karst rocky desertification areas was generally lower than that of the total Yunnan Province land areas and Yunnan non-karst rocky desertification areas, but the mean value of Fr was generally more than that of both the above-mentioned areas. In addition, the RSEI and Fr of Yunnan karst rocky desertification areas both showed lower stability values than those of both the above-mentioned areas. This generally suggested a low ecological quality and a high degree of desertification under a low stability in Yunnan karst rocky desertification areas. (3) The correlation of RSEI and Fr with driving factors followed the order of topographic factors, soil factors > water factors > anthropogenic factors. Anthropogenic factors were the driving force changing the state of rocky desertification, geological factors such as topography and soil to a larger extent determined the original macroscopic ecological relationship of rocky desertification, and water factors lay between the above two. The findings of this research will provide theoretical support and a basis for the improvement of ecological quality and comprehensive control of karst rocky desertification in Yunnan Province.
Keywords: Yunnan karst rocky desertification areas; analysis of driving mechanisms; ecological quality evolution; karst rocky desertification.
Conflict of interest statement
The authors declare no conflict of interest.
Figures


Similar articles
-
Simulation of coupled transport of soil moisture and heat in a typical karst rocky desertification area, Yunnan Province, Southwest China.Environ Sci Pollut Res Int. 2021 Jan;28(4):4716-4730. doi: 10.1007/s11356-020-10784-2. Epub 2020 Sep 19. Environ Sci Pollut Res Int. 2021. PMID: 32949362
-
Can agricultural biomass energy provide an alternative energy source for karst rocky desertification areas in Southwestern China? investigating Guizhou Province as example.Environ Sci Pollut Res Int. 2021 Aug;28(32):44315-44331. doi: 10.1007/s11356-021-12537-1. Epub 2021 Apr 13. Environ Sci Pollut Res Int. 2021. PMID: 33847882
-
Land Use Transition and Eco-Environmental Effects in Karst Mountain Area Based on Production-Living-Ecological Space: A Case Study of Longlin Multinational Autonomous County, Southwest China.Int J Environ Res Public Health. 2022 Jun 21;19(13):7587. doi: 10.3390/ijerph19137587. Int J Environ Res Public Health. 2022. PMID: 35805240 Free PMC article.
-
A Review of Ecological Assets and Ecological Products Supply: Implications for the Karst Rocky Desertification Control.Int J Environ Res Public Health. 2022 Aug 17;19(16):10168. doi: 10.3390/ijerph191610168. Int J Environ Res Public Health. 2022. PMID: 36011802 Free PMC article. Review.
-
Research Advancement in Grassland Ecosystem Vulnerability and Ecological Resilience and Its Inspiration for Improving Grassland Ecosystem Services in the Karst Desertification Control.Plants (Basel). 2022 May 11;11(10):1290. doi: 10.3390/plants11101290. Plants (Basel). 2022. PMID: 35631715 Free PMC article. Review.
Cited by
-
Using natural vegetation succession to evaluate how natural restoration proceeds under different climate in Yunnan, Southwest China.PLoS One. 2025 Mar 11;20(3):e0319420. doi: 10.1371/journal.pone.0319420. eCollection 2025. PLoS One. 2025. PMID: 40067844 Free PMC article.
-
Experimental investigation on water retention property of rubble improved by modified hydrophilic polyurethane.Sci Rep. 2025 Feb 14;15(1):5544. doi: 10.1038/s41598-025-89239-y. Sci Rep. 2025. PMID: 39953095 Free PMC article.
-
Distribution characteristics of endophytic bacteria and endophytic nitrogen-fixing bacteria in Vicia faba root nodules in Rocky desertification areas of Southwest China.Sci Rep. 2025 Jul 10;15(1):24887. doi: 10.1038/s41598-025-10194-9. Sci Rep. 2025. PMID: 40640350 Free PMC article.
-
The Response of Rocky Desertification to the Development of Road Networks in Karst Ecologically Fragile Areas.Int J Environ Res Public Health. 2023 Feb 10;20(4):3130. doi: 10.3390/ijerph20043130. Int J Environ Res Public Health. 2023. PMID: 36833826 Free PMC article.
-
Increased vegetation disturbance intensity reduces soil nutrients while enhancing microbial network interactions.Front Microbiol. 2025 Jul 23;16:1634424. doi: 10.3389/fmicb.2025.1634424. eCollection 2025. Front Microbiol. 2025. PMID: 40771697 Free PMC article.
References
-
- Goldscheider N., Chen Z., Auler A.S., Bakalowicz M., Broda S., Drew D., Hartmann J., Jiang G.H., Moosdorf N., Stevanovic Z., et al. Global Distribution of Carbonate Rocks and Karst Water Resources. Hydrogeol. J. 2020;28:1661–1677. doi: 10.1007/s10040-020-02139-5. - DOI
-
- Williams P. World Heritage Caves and Karst. IUCN; Gland, Switzerland: 2008. p. 57.
-
- Ford D., Williams P.D. Karst Hydrogeology and Geomorphology. John Wiley & Sons; Hoboken, NJ, USA: 2007.
-
- Sweeting M.M. Reflections on the Development of Karst Geomorphology in Europe and a Comparison with its Development in China. Z. Geomorph. 1993;37:127–138.
-
- Tong X.W., Brandt M., Yue Y.M., Horion S., Wang K.L., Keersmaecker W.D., Tian F., Schurgers G., Xiao X.M., Luo Y.Q., et al. Increased Vegetation Growth and Carbon Stock in China Karst Via Ecological Engineering. Nat. Sustain. 2018;1:44–50. doi: 10.1038/s41893-017-0004-x. - DOI
Publication types
MeSH terms
Substances
LinkOut - more resources
Full Text Sources
Miscellaneous
