. 2022 Dec 9;23(24):15602.
doi: 10.3390/ijms232415602.

SP600125 Enhances Temperature-Controlled Repeated Thermal Stimulation-Induced Neurite Outgrowth in PC12-P1F1 Cells

Affiliations

SP600125 Enhances Temperature-Controlled Repeated Thermal Stimulation-Induced Neurite Outgrowth in PC12-P1F1 Cells

You-Ran Luo et al. Int J Mol Sci. .

Abstract

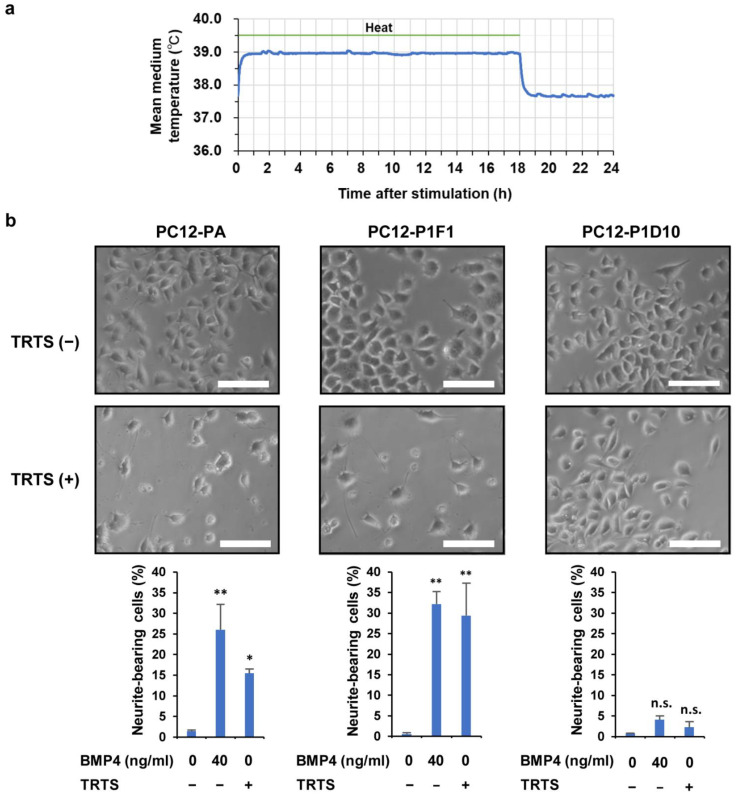
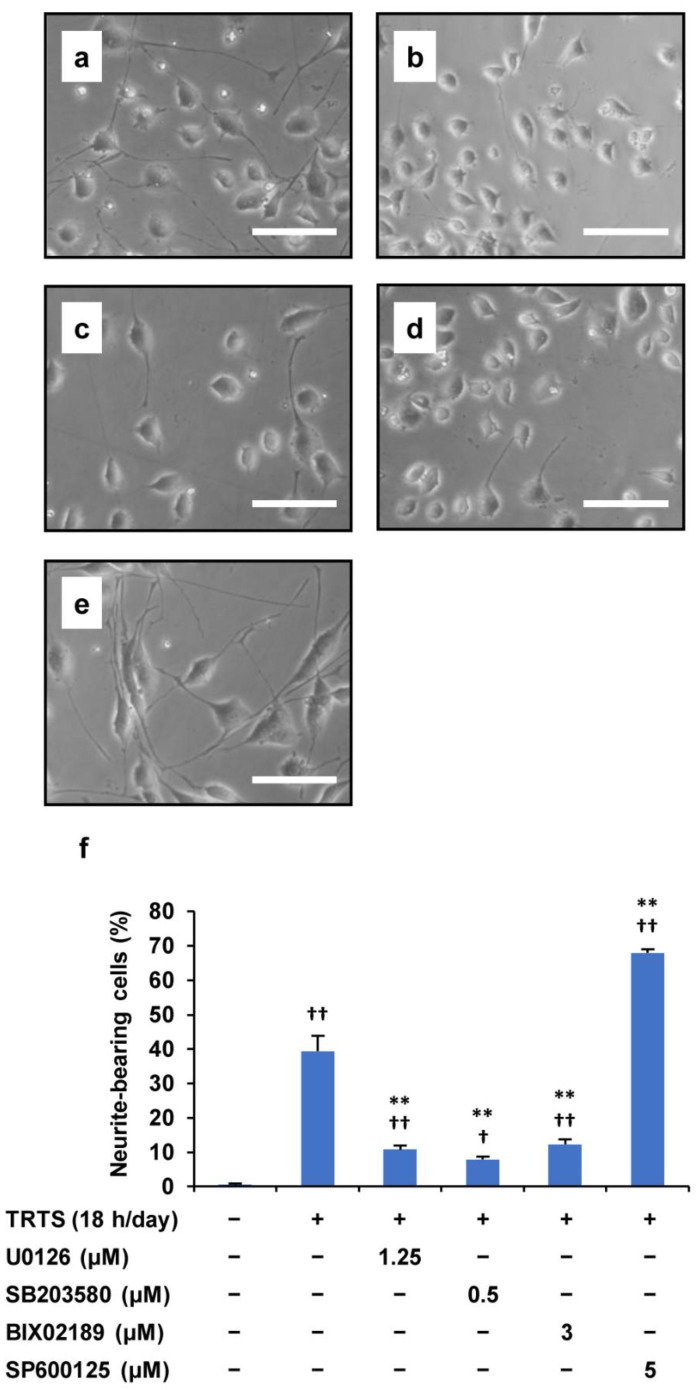
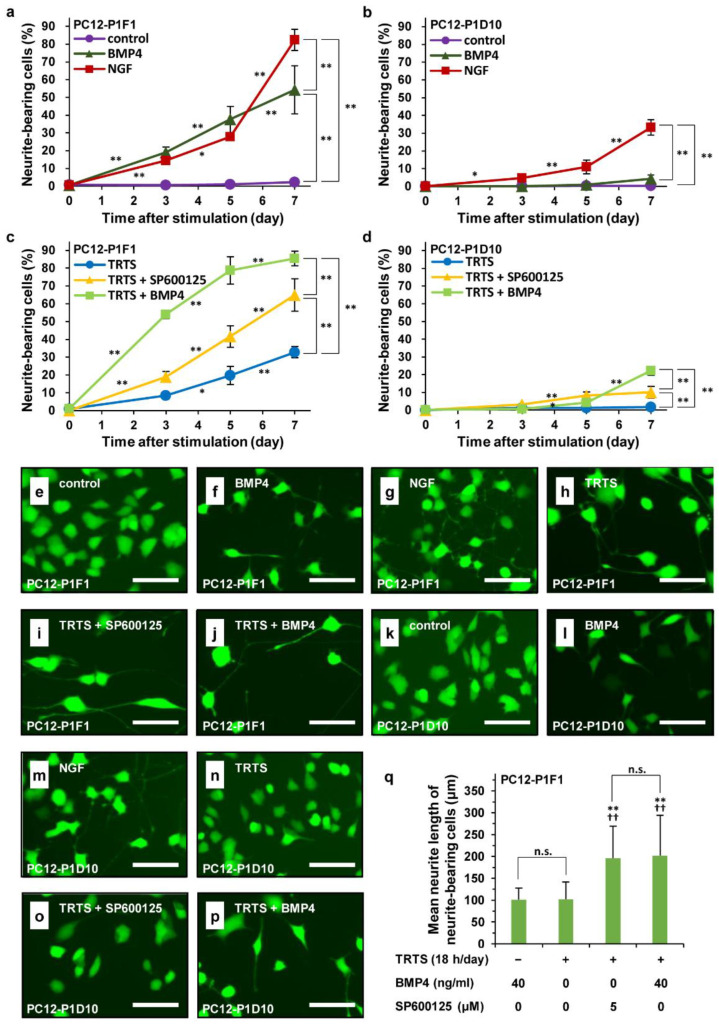
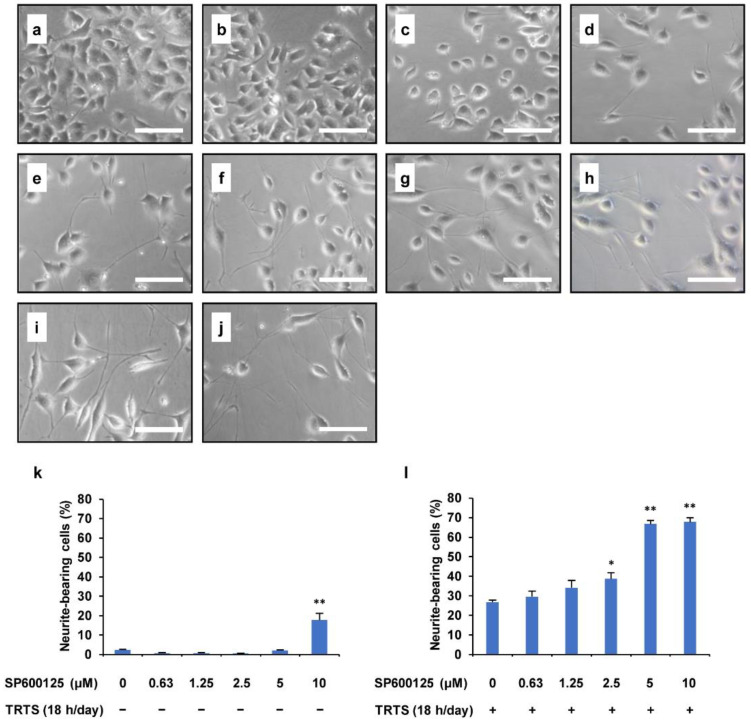
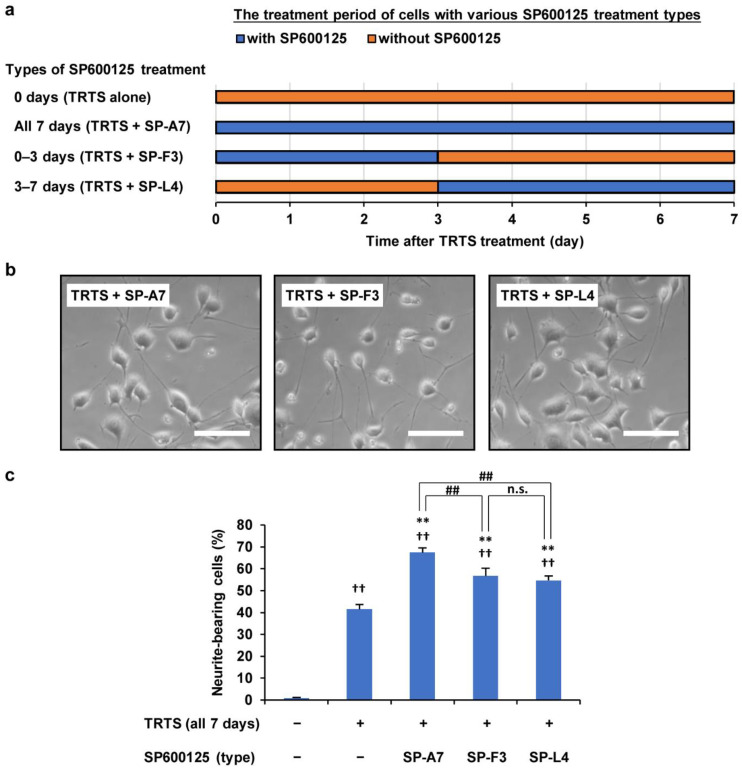
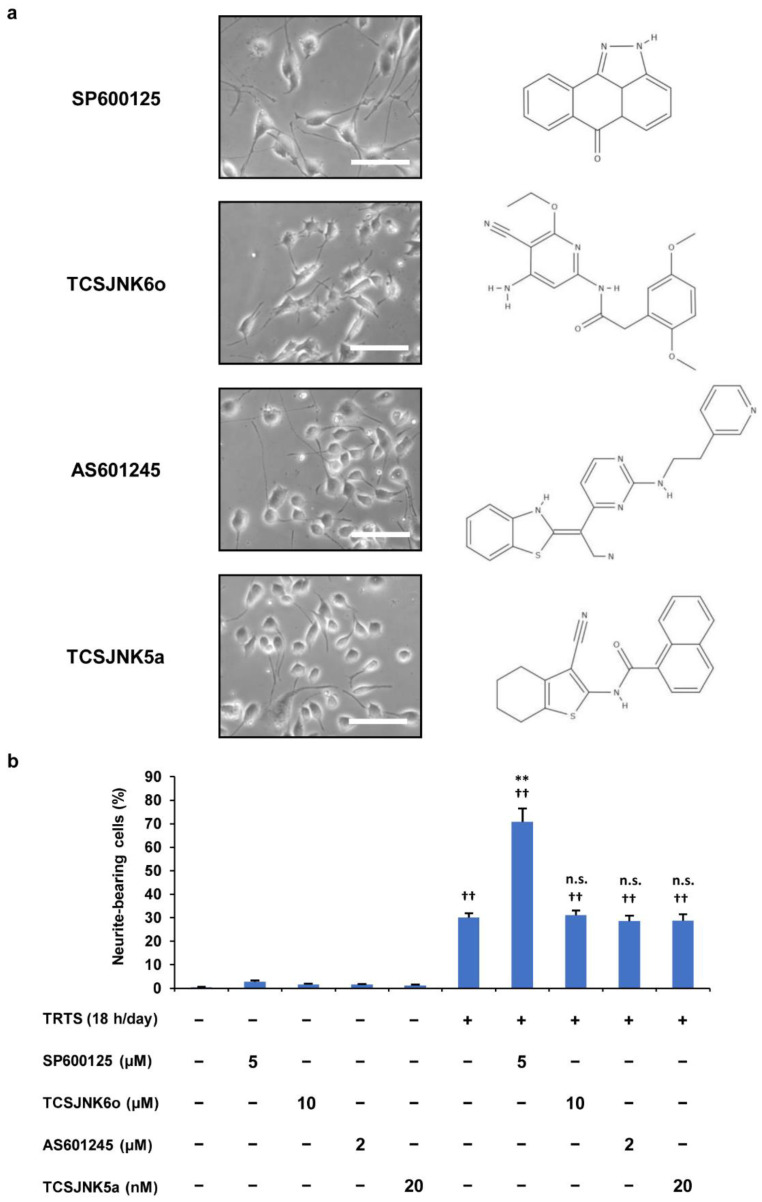
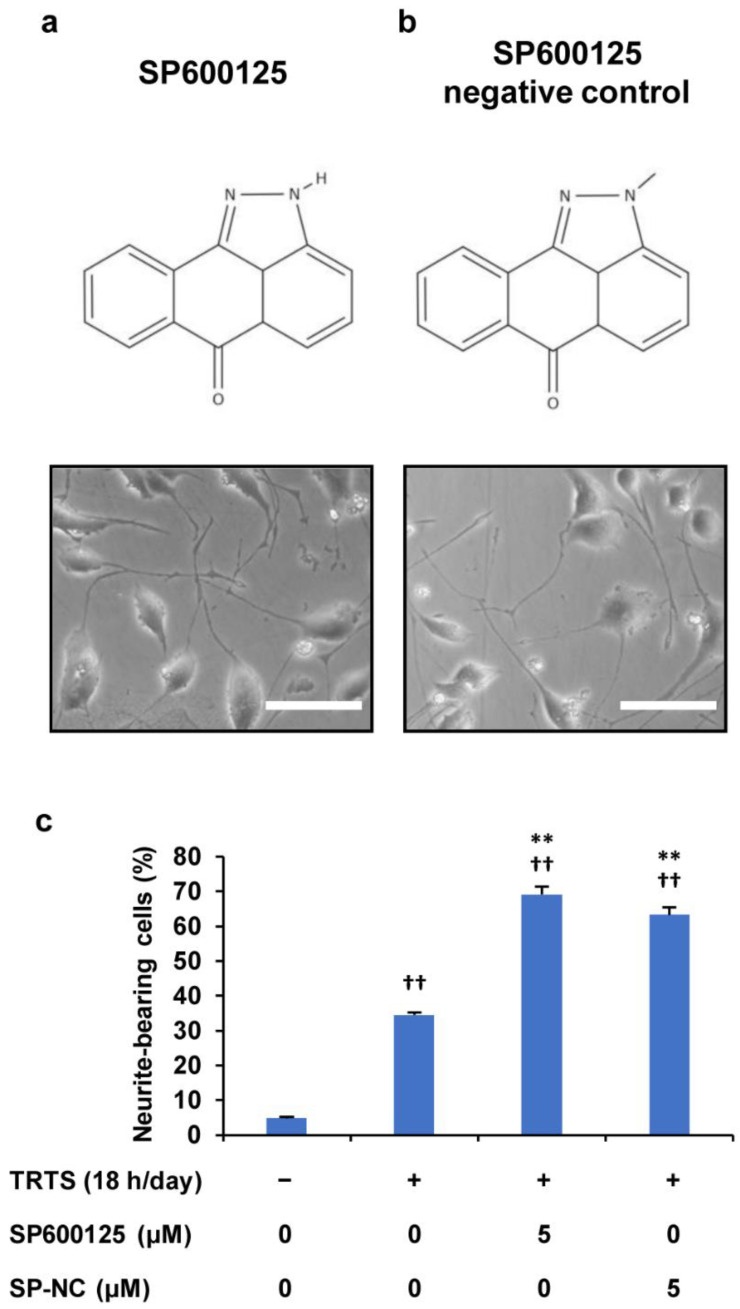
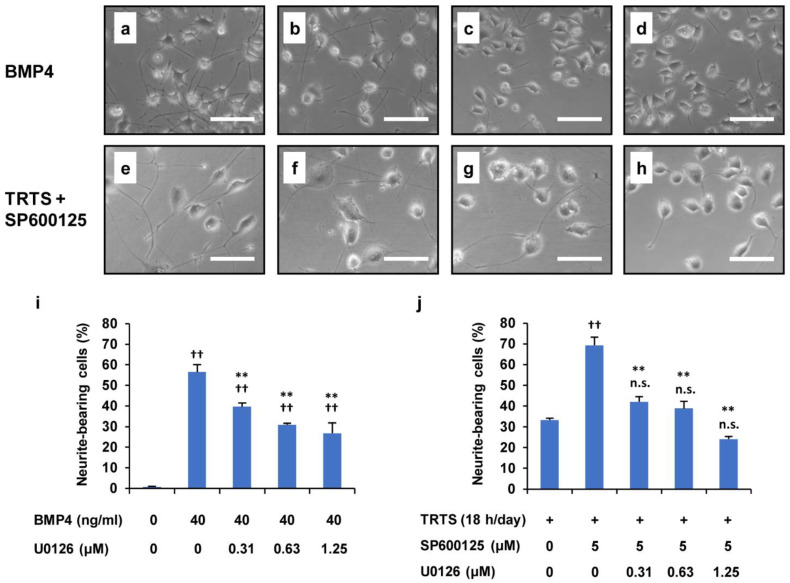
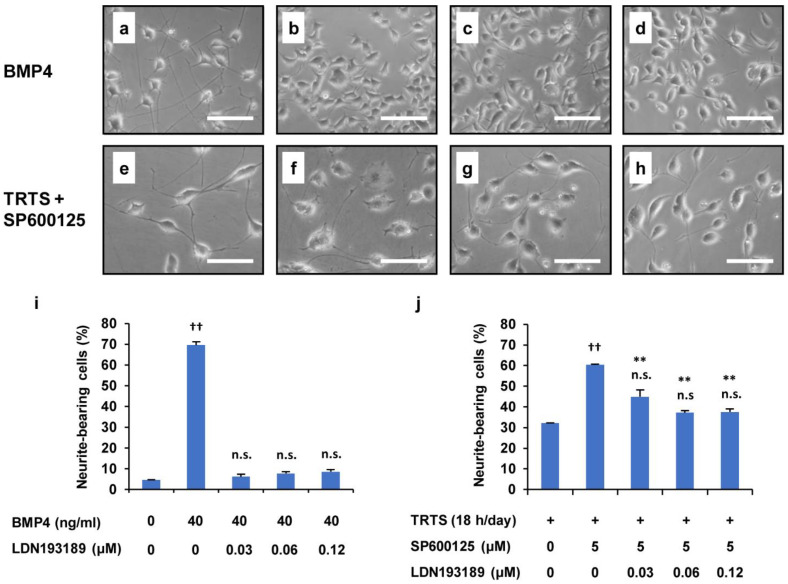
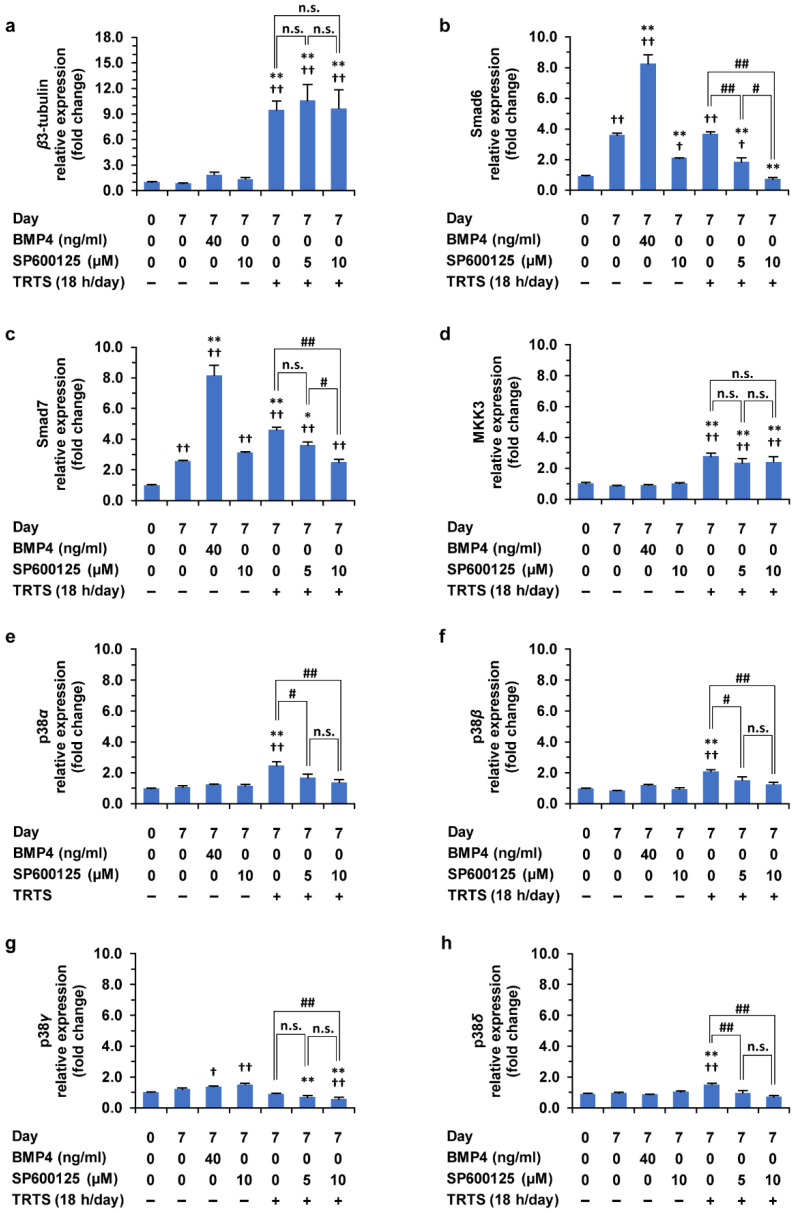
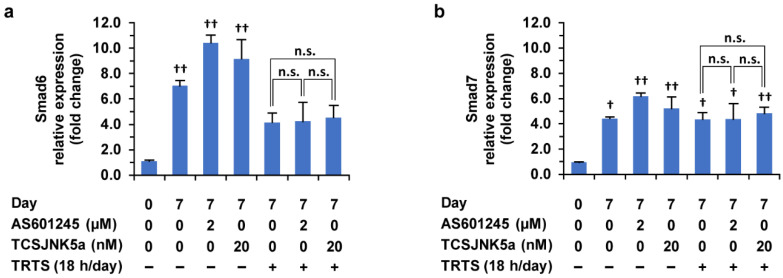
This study evaluated the mechanism of temperature-controlled repeated thermal stimulation (TRTS)-mediated neuronal differentiation. We assessed the effect of SP600125, a c-Jun N-terminal kinase (JNK) inhibitor, on neuronal differentiation of rat PC12-P1F1 cells, which can differentiate into neuron-like cells by exposure to TRTS or neurotrophic factors, including bone morphogenetic protein (BMP) 4. We evaluated neuritogenesis by incubating the cells under conditions of TRTS and/or SP600125. Cotreatment with SP600125 significantly enhanced TRTS-mediated neuritogenesis, whereas that with other selective mitogen-activated protein kinase (MAPK) inhibitors did not-e.g., extracellular signal-regulated kinase (ERK)1/2 inhibitor U0126, and p38 MAPK inhibitor SB203580. We tried to clarify the mechanism of SP600125 action by testing the effect of U0126 and the BMP receptor inhibitor LDN193189 on the SP600125-mediated enhancement of intracellular signaling. SP600125-enhanced TRTS-induced neuritogenesis was significantly inhibited by U0126 or LDN193189. Gene expression analysis revealed that TRTS significantly increased β3-Tubulin, MKK3, and Smad7 gene expressions. Additionally, Smad6 and Smad7 gene expressions were substantially attenuated through SP600125 co-treatment during TRTS. Therefore, SP600125 may partly enhance TRTS-induced neuritogenesis by attenuating the negative feedback loop of BMP signaling. Further investigation of the mechanisms underlying the effect of SP600125 during TRTS-mediated neuritogenesis may contribute to the future development of regenerative neuromedicine.

Keywords: PC12 cells; SP600125; neuritogenesis; temperature-controlled repeated thermal stimulation.


Conflict of interest statement

The authors declare no conflict of interest.

Figures

Figure 1
Figure 1
Comparison of temperature-controlled repeated thermal stimulation (TRTS)-induced neurite-bearing cells (%) among PC12 parental, PC12-P1F1, and PC12-P1D10 cell lines. (a) We evaluated temperature changes in the culture medium during TRTS. Briefly, 24 h before thermal evaluation, a cell-free culture medium was transferred into a 24-well culture plate. Then, temperatures of the culture medium during TRTS (18 h/day) were recorded every 60 s for 24 h. The data represent the average temperature changes of four independent replicates. (b) Cells were exposed to TRTS for 18 h per day for 7 days, and the percentage of neuritogenesis was evaluated. Representative phase-contrast micrographs of cultured cells and the data of neurite-bearing cells on day 7 with or without TRTS of three cell lines: PC12 parental cells (PC12-PA), PC12-P1F1 cells, and PC12-P1D10 cells. Scale bars: 100 μm. The data represent the means ± standard deviation of three replicates. * p < 0.05 vs. control; ** p < 0.01 vs. control; n.s., not significant vs. control.
Figure 2
Figure 2
Effect of MAPK inhibitors on TRTS-induced differentiation in PC12-P1F1 cells. PC12-P1F1 cells were pretreated with MAPK inhibitors before TRTS. (ae) Phase-contrast images of the cells on day 7 after TRTS alone (a) or pretreated with U0126 (b), BIX02189 (c), SB2003580 (d), or SP600125 (e). Scale bars: 100 μm. (f) PC12-P1F1 cells were exposed to TRTS for 18 h per day for 7 days with or without pretreatment with MAPK inhibitors, and a control group was incubated with no inhibitor and no TRTS exposure. The percentage of neurite-bearing cells on day 7 was determined. The data represent the means ± standard deviation of three replicates.  p < 0.05 vs. control; †† p < 0.01 vs. control; ** p < 0.01 vs. TRTS alone.
Figure 3
Figure 3
Time course and live imaging of SP600125-mediated enhancement of TRTS-induced neuritogenesis in PC12-P1F1 cells. PC12-P1F1 or PC12-P1D10 cells were incubated with BMP4 (40 ng/mL) or NGF (50 ng/mL) for 7 days. Furthermore, PC12-P1F1 or PC12-P1D10 cells were also pretreated with SP600125 (5.0 μM) or BMP4 (40 ng/mL) with TRTS 18 h/day for 7 days. PC12-P1F1 (a,c) and PC12-P1D10 cells (b,d) were scored for neurite outgrowth after 0–7 days of incubation with the indicated conditions. (ad) The data represent the means ± standard deviation of four replicates. * p < 0.05; ** p < 0.01. (ej) Representative live images of PC12-P1F1 cells treated without stimuli (a control) (e), BMP4 alone, (f), NGF alone (g), TRTS alone (h), TRTS plus SP600125 (i), and TRTS plus BMP4 (j). (kp) Representative live cell images of PC12-P1D10 cells treated without stimuli (a control) (k), BMP4 alone, (l), NGF alone (m), TRTS alone (n), TRTS plus SP600125 (o), and TRTS plus BMP4 (p). (ep) Scar bars: 100 μm. (q) The averaged neurite length of neurite-bearing PC12-P1F1 cells 7 days after the indicated stimulations. The data represent the means ± standard deviation of ten replicates. †† p < 0.01 vs. BMP alone; ** p < 0.01 vs. TRTS alone; n.s., not significant.
Figure 4
Figure 4
Dose-dependent SP600125-mediated enhancement of TRTS-induced neuritogenesis in PC12-P1F1 cells. PC12-P1F1 cells were pretreated with SP600125 (0–10 μM) with or without TRTS (18 h/day for 7 days). (ad) Representative phase-contrast images of PC12-P1F1 cells treated with the indicated concentrations of SP600125 in the absence of TRTS: 0 μM (a), 2.5 μM (b), 5 μM (c), and 10 μM (d). (ej) Representative phase-contrast images of PC12-P1F1 cells on day 7 incubated with the indicated concentrations of SP600125 in the presence of TRTS: 0 μM (e), 0.625 μM (f), 1.25 μM (g), 2.5 μM (h), 5 μM (i), and 10 μM (j). Scale bars: 100 μm. (k,l) PC12-P1F1 cells were scored for neurite outgrowth after 7 days of incubation. The data represent the means ± standard deviation of three replicates. * p < 0.05 vs. control; ** p < 0.01 vs. control (k), or TRTS alone (l).
Figure 5
Figure 5
Effects of various treatment times with 0.5 μM SP600125 on PC12-P1F1 neuritogenesis while undergoing TRTS exposure. (a) Schematic representation of the treatment times of PC12-P1F1 cells with SP600125 in the presence of TRTS. PC12-P1F1 cells were stimulated with SP600125 under TRTS exposure as follows: all 7 days (TRTS + SP-A7), first 3 days (TRTS + SP-F3), and last 4 days (TRTS + SP-L4). (b) Phase-contrast images of PC12-P1F1 cells on day 7. Scale bars: 100 μm. (c) Percentage of neurite-bearing cells on day 7. Cells that did not undergo TRTS or SP600125 treatment were defined as the negative control group. The data represent the means ± standard deviation of three replicates. ## p < 0.01; n.s., not significant; †† p < 0.01 vs. control; ** p < 0.01 vs. TRTS alone.
Figure 6
Figure 6
Effects of SP600125 and the other JNK inhibitors (TCSJNK6o, AS601245, and TCSJNK5a) on TRTS-mediated neuritogenesis in PC12-P1F1 cells. PC12-P1F1 cells were pretreated with 5.0 μM SP600125, 10 μM TCSJNK6o, 2.0 μM AS601245, or 20 nM TCSJNK5a and then exposed to TRTS for 18 h per day for 7 days. (a) Representative phase-contrast images of PC12-P1F1 cells on day 7 in the presence of TRTS and the chemical structures of the indicated JNK inhibitors. Scale bars: 100 μM. (b) The percentage of neurite-bearing cells on day 7 was counted using microscopy. The data represent the means ± standard deviation of three replicates. †† p < 0.01 vs. control; ** p < 0.01 vs. TRTS alone; n.s., not significant vs. TRTS alone.
Figure 7
Figure 7
Effect of SP600125 negative control (SP-NC) on TRTS-mediated neuritogenesis in PC12-P1F1 cells. PC12-P1F1 cells were pretreated with 0.5 μM SP600125 and SP-NC, respectively, and then exposed to TRTS for 18 h per day for 7 days. (a,b) Chemical structures of SP600125 (a) and SP-NC (b) and representative phase-contrast images on day 7 of TRTS-treated PC12-P1F1 cells in the presence of each compound. Scale bars: 100 μm. (c) Percentage of neurite-bearing cells on day 7. The data represent the means ± standard deviation of three replicates. †† p < 0.01 vs. control; ** p < 0.01 vs. TRTS alone.
Figure 8
Figure 8
Suppression of TRTS plus SP600125-mediated neuritogenesis by U0126 in PC12-P1F1 cells. (ad) PC12-P1F1 cells were treated with 40 ng/mL bone morphogenetic protein 4 (BMP4) as a control for 7 days in the presence or absence of U0126. Representative phase-contrast images of PC12-P1F1 cells on day 7 after treatment with (a) 0 μM, (b) 0.31 μM, (c) 0.63 μM, and (d) 1.25 μM U0126. (eh) PC12-P1F1 cells were exposed to TRTS plus SP600125 for 7 days in the presence or absence of U0126. Representative phase-contrast images of PC12-P1F1 cells on day 7 after treatment with (e) 0 μM, (f) 0.31 μM, (g) 0.63 μM, and (h) 1.25 μM U0126. Scale bars: 100 μm. (i,j) PC12-P1F1 cells were stimulated with 40 ng/mL BMP4 (i) or exposed to TRTS plus SP600125 (j) for 7 days, and the rate of neurite-bearing cells was determined on day 7. The data represent the means ± standard deviation of three replicates. †† p < 0.01 vs. control (i) or TRTS alone (j); ** p < 0.01 vs. BMP4 alone (i) or vs. TRTS plus SP600125 only (j); n.s., not significant vs. TRTS alone (j).
Figure 9
Figure 9
Suppression of TRTS plus SP600125-mediated neuritogenesis by LDN193189 in PC12-P1F1 cells. (ad) PC12-P1F1 cells were treated with 40 ng/mL BMP4 as a control for 7 days in the presence or absence of LDN193189. Representative phase-contrast images of PC12-P1F1 cells on day 7 after treatment with (a) 0 μM, (b) 0.03 μM, (c) 0.06 μM, and (d) 0.12 μM LDN193189. (eh) PC12-P1F1 cells were exposed to TRTS plus SP600125 for 7 days in the presence or absence of LDN193189. Representative phase-contrast images of PC12-P1F1 cells on day 7 after treatment with (e) 0 μM, (f) 0.03 μM, (g) 0.06 μM, and (h) 0.12 μM LDN193189. Scale bars: 100 μm. (i,j) PC12-P1F1 cells were stimulated with 40 ng/mL BMP4 (i) or exposed to TRTS plus SP600125 (j) for 7 days, and the rate of neurite-bearing cells on day 7 was determined. The data represent the means ± standard deviation of three replicates. †† p < 0.01 vs. control (i) or TRTS alone (j); n.s., not significant vs. control (i) or TRTS alone (j); ** p < 0.01 vs. TRTS plus SP600125 only (j).
Figure 10
Figure 10
(ah) Effects of TRTS in the presence or absence of SP600125 on gene expressions in PC12-P1F1 cells. PC12-P1F1 cells were incubated with BMP4 (40 ng/mL) or SP600125 (10.0 μM) for 7 days. In addition, PC12-P1F1 cells were also treated with TRTS for 18 h per day for 7 days in the presence of the indicated SP600125 concentrations. The target mRNA expression was normalized to that of the internal control β-actin. β3-tubulin was used as a neuronal differentiation marker of the cells. For each indicated gene, results are presented as fold changes relative to day 0 of the control: β3-tubulin (a), Smad6 (b), Smad7 (c), MKK3 (d), p38α (e), p38β (f), p38γ (g), p38δ (h). The data represent the means ± standard deviation of three replicates. # p < 0.05; ## p < 0.01;  p < 0.05 vs. day 0 control; †† p < 0.01 vs. day 0 control; * p < 0.05 vs. day 7 control; ** p < 0.01 vs. day 7 control; n.s., not significant.
Figure 11
Figure 11
Effects of TRTS in the presence or absence of AS601245/TCSJNK5a on gene expressions in PC12-P1F1 cells. (a,b) PC12-P1F1 cells were incubated with AS601245 (2.0 μM) or TCSJNK5a (20.0 nM) for 7 days. In addition, PC12-P1F1 cells were also treated with TRTS for 18 h per day for 7 days in the presence of AS601245 (2.0 μM) or TCSJNK5a (20.0 nM). The target mRNA expression was normalized to that of the internal control β-actin. For each indicated gene, results are presented as fold changes relative to day 0 control: Smad6 (a), Smad7 (b). The data represent the means ± standard deviation of three replicates.  p < 0.05 vs. day 0 control; †† p < 0.01 vs. day 0 control; n.s., not significant.

References

    1. Teng K.K., Georgieff I.S., Nunez J., Shelanski M.L., Greene L.A. Characterization of a PC12 cell sub-clone (PC12-C41) with enhanced neurite outgrowth with capacity: Implications for a modulatory role of high molecular weight tau in neuritogenesis. J. Cell Sci. 1993;106:611–626. doi: 10.1242/jcs.106.2.611. - DOI - PubMed
    1. Gokoffski K.K., Peng M., Alas B., Lam P. Neuro-protection and neuro-regeneration of the optic nerve: Recent advances and future directions. Curr. Opin. Neurol. 2020;33:93–105. doi: 10.1097/WCO.0000000000000777. - DOI - PMC - PubMed
    1. Higgins S., Lee J.S., Ha L., Lim J.Y. Inducing neurite outgrowth by mechanical cell stretch. Biores. Open Access. 2013;2:212–216. doi: 10.1089/biores.2013.0008. - DOI - PMC - PubMed
    1. Kudo T., Kanetaka H., Mochizuki K., Tominami K. Induction of neurite outgrowth in PC12 cells treated with temperature-controlled repeated thermal stimulation. PLoS ONE. 2015;10:e0124024. doi: 10.1371/journal.pone.0124024. - DOI - PMC - PubMed
    1. Wiatrak B., Kubis-Kubiak A., Piwowar A., Barg E. PC12 cell line: Cell types, coating of culture vessels, differentiation and other culture conditions. Cells. 2020;9:958. doi: 10.3390/cells9040958. - DOI - PMC - PubMed