. 2022 Dec 11;23(24):15702.
doi: 10.3390/ijms232415702.

Fluid Shear Stress Regulates Osteogenic Differentiation via AnnexinA6-Mediated Autophagy in MC3T3-E1 Cells

Affiliations

Fluid Shear Stress Regulates Osteogenic Differentiation via AnnexinA6-Mediated Autophagy in MC3T3-E1 Cells

Tong Pei et al. Int J Mol Sci. .

Abstract

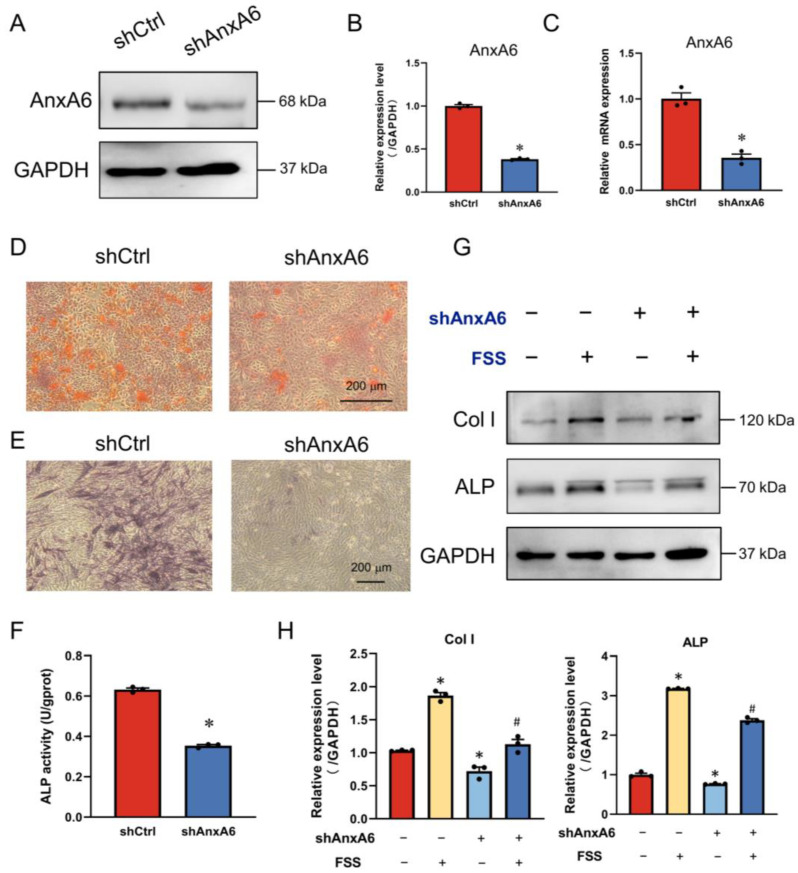
Fluid shear stress (FSS) facilitates bone remodeling by regulating osteogenic differentiation, and extracellular matrix maturation and mineralization. However, the underlying molecular mechanisms of how mechanical stimuli from FSS are converted into osteogenesis remain largely unexplored. Here, we exposed MC3T3-E1 cells to FSS with different intensities (1 h FSS with 0, 5, 10, and 20 dyn/cm2 intensities) and treatment durations (10 dyn/cm2 FSS with 0, 0.5, 1, 2 and 4 h treatment). The results demonstrate that the 1 h of 10 dyn/cm2 FSS treatment greatly upregulated the expression of osteogenic markers (Runx2, ALP, Col I), accompanied by AnxA6 activation. The genetic ablation of AnxA6 suppressed the autophagic process, demonstrating lowered autophagy markers (Beclin1, ATG5, ATG7, LC3) and decreased autophagosome formation, and strongly reduced osteogenic differentiation induced by FSS. Furthermore, the addition of autophagic activator rapamycin to AnxA6 knockdown cells stimulated autophagy process, and coincided with more expressions of osteogenic proteins ALP and Col I under both static and FSS conditions. In conclusion, the findings in this study reveal a hitherto unidentified relationship between FSS-induced osteogenic differentiation and autophagy, and point to AnxA6 as a key mediator of autophagy in response to FSS, which may provide a new target for the treatment of osteoporosis and other diseases.

Keywords: annexinA6; autophagy; fluid shear stress; mineralization; osteogenic differentiation.


Conflict of interest statement

The authors declare no conflict of interest.

Figures

Figure 1
Figure 1
FSS induces osteoblast differentiation. (A,B) Western blot analysis and quantification of osteogenic protein expression in MC3T3-E1 cells when exposed to 0 (static control), 5, 10, pr 20 dyn/cm2 FSS for 1 h. GAPDH served as an internal control (n = 3). (C,D) Western blot analysis and quantification of osteogenic protein expression in MC3T3-E1 cells when exposed to 10 dyn/cm2 FSS for 0 (static control), 0.5, 1, 2, or 4 h. GAPDH served as an internal control (n = 3). (E) ALP staining after 5 additional days of osteogenic induction when exposed to 10 dyn/cm2 FSS for 1 h. (F) Statistical bar graph showing the percentage of ALP-positive cells in (E) (n = 3). (G) Quantification of ALP activity in MC3T3-E1 cells with or without 1 h of 10 dyn/cm2 FSS stimulation (n = 3). All data are presented as mean ± SEM. * p < 0.05 versus static control group.
Figure 2
Figure 2
FSS promotes the expression and translocation of AnxA6 in MC3T3-E1 cells. (A,B) Western blot analysis and quantification of AnxA6 expression in MC3T3-E1 cells when exposed to 0 (static control), 5, 10, or 20 dyn/cm2 FSS for 1 h. GAPDH served as an internal control (n = 3). (C,D) Western blot analysis and quantification of AnxA6 expression in MC3T3-E1 cells when exposed to 10 dyn/cm2 FSS for 0 (static control), 0.5, 1, 2, or 4 h. GAPDH served as an internal control (n = 3). (E) Representative immunofluorescence images showing the expression and distribution of AnxA6 (labelled by red fluorescence, indicated by yellow arrows) inside the cell and F-actin organization (labelled by green fluorescence) when exposed to 10 dyn/cm2 FSS for 1 h. Nuclei were stained with DAPI (blue), scale bar = 50 μm. All data are presented as mean ± SEM. * p < 0.05 versus static control group.
Figure 3
Figure 3
AnxA6 is involved in FSS-induced osteogenic differentiation. (A,B) Western blot analysis and quantification of AnxA6 expression in MC3T3-E1 cells transfected with negative shRNA (shCtrl) or AnxA6 shRNA (shAnxA6). GAPDH served as an internal control (n = 3). (C) The gene expression of AnxA6 was detected with qRT-PCR and quantified with GAPDH normalization (n = 3). (D) Representative images show alizarin red staining after 14 days of osteogenic induction. Calcified nodules were shown as red staining. (E) Representative images of ALP staining after 5 days of osteogenic induction. ALP-positive cells shown as blue staining. (F) Quantification of ALP activity in shCtrl and shAnxA6 MC3T3-E1 cells with 1 h of 10 dyn/cm2 FSS loading (n = 3). (G,H) Western blot analysis and quantification of osteogenic protein expression in shCtrl and shAnxA6 MC3T3-E1 cells with or without 1 h of 10 dyn/cm2 FSS loading (n = 3). GAPDH served as an internal control (n = 3). All data are presented as mean ± SEM. * p < 0.05 versus static shCtrl group; # p < 0.05 versus FSS group.
Figure 4
Figure 4
FSS induces the occurrence of autophagy in MC3T3-E1 cells. (A,B) Western blot analysis and quantification of autophagic protein expression in MC3T3-E1 cells when exposed to 0 (static control), 5, 10, or 20 dyn/cm2 FSS for 1 h. GAPDH served as an internal control (n = 3). (C,D) Western blot analysis and quantification of autophagic proteins expression in MC3T3-E1 cells when exposed to 10 dyn/cm2 FSS for 0 (static control), 0.5, 1, 2, or 4 h. GAPDH served as an internal control (n = 3). All data are presented as mean ± SEM. * p < 0.05 versus static control group.
Figure 5
Figure 5
Knockdown of AnxA6 impairs FSS-induced autophagy. (A,B) Western blot analysis and quantification of autophagic protein expression in shCtrl and shAnxA6 MC3T3-E1 cells with or without 1 h of 10 dyn/cm2 FSS loading (n = 3). GAPDH served as an internal control (n = 3). (C) Typical TEM images of autophagosomes in shCtrl and shAnxA6 MC3T3-E1 cells with or without 1 h of 10 dyn/cm2 FSS loading. Autophagosomes are indicated by yellow arrows in the zoomed images. (D) Confocal images showing the distribution of LC3B during the process of autophagy in shCtrl and shAnxA6 MC3T3-E1 cells transfected with AdPlus-mCherry-GFP-LC3B adenovirus with or without 1 h of 10 dyn/cm2 FSS loading. Yellow mCherry-GFP-LC3B spots indicated by yellow arrows represent the overlap of mCherry- and GFP-LC3B showing the formation of autophagosomes. All data are presented as mean ± SEM. * p < 0.05 versus static shCtrl group; # p < 0.05 versus FSS group.
Figure 6
Figure 6
FSS promotes osteogenic differentiation by activating AnxA6-mediated autophagy. (A) Representative images showing the ALP staining of MC3T3-E1 cells after culturing in osteogenic medium (OM) with or without chloroquine (CQ, 10 μM) and rapamycin (RAPA, 100 nM) for 7 days. ALP-positive cells are shown as blue staining. (B) Representative images of the alizarin red S staining of MC3T3-E1 cells after culturing in an osteogenic medium with or without chloroquine (CQ, 10 μM) and rapamycin (RAPA, 100 nM) for 14 days. Calcified nodules shown as red staining. (C,D) Western blot analysis and quantification of autophagic and osteogenic protein expression in MC3T3-E1 cells after culturing in OM with or without chloroquine (CQ, 10 μM) and rapamycin (RAPA, 100 nM) for 7 days. (E,F) Western blot analysis and quantification of autophagic and osteogenic protein expression in shCtrl and shAnxA6 MC3T3-E1 cells with or without the pretreatment of RAPA (200 nM) under static or 1 h of 10dyn/cm2 FSS loading. * p < 0.05.
Figure 6
Figure 6
FSS promotes osteogenic differentiation by activating AnxA6-mediated autophagy. (A) Representative images showing the ALP staining of MC3T3-E1 cells after culturing in osteogenic medium (OM) with or without chloroquine (CQ, 10 μM) and rapamycin (RAPA, 100 nM) for 7 days. ALP-positive cells are shown as blue staining. (B) Representative images of the alizarin red S staining of MC3T3-E1 cells after culturing in an osteogenic medium with or without chloroquine (CQ, 10 μM) and rapamycin (RAPA, 100 nM) for 14 days. Calcified nodules shown as red staining. (C,D) Western blot analysis and quantification of autophagic and osteogenic protein expression in MC3T3-E1 cells after culturing in OM with or without chloroquine (CQ, 10 μM) and rapamycin (RAPA, 100 nM) for 7 days. (E,F) Western blot analysis and quantification of autophagic and osteogenic protein expression in shCtrl and shAnxA6 MC3T3-E1 cells with or without the pretreatment of RAPA (200 nM) under static or 1 h of 10dyn/cm2 FSS loading. * p < 0.05.
Figure 7
Figure 7
FSS promotes osteoblast differentiation via AnnexinA6-mediated autophagy. Pre-osteoblast MC3T3-E1 cells are sensitive to external mechanical stimulation. Once FSS is exerted on MC3T3-E1 cells, AnxA6 can respond to FSS directly or synergistically with other mechanosensors, accompanied by its translocation from the cytoplasm to the cytomembrane. Subsequently, the elevated expressions of AnxA6 affect the downstream autophagic flux, and further regulate osteogenic differentiation.

Similar articles

Cited by

References

    1. Wang L., You X., Zhang L., Zhang C., Zou W. Mechanical regulation of bone remodeling. Bone Res. 2022;10:16. doi: 10.1038/s41413-022-00190-4. - DOI - PMC - PubMed
    1. Papachroni K.K., Karatzas D.N., Papavassiliou K.A., Basdra E.K., Papavassiliou A.G. Mechanotransduction in osteoblast regulation and bone disease. Trends Mol. Med. 2009;15:208–216. doi: 10.1016/j.molmed.2009.03.001. - DOI - PubMed
    1. Morgan E.F., Unnikrisnan G.U., Hussein A.I. Bone Mechanical Properties in Healthy and Diseased States. Annu. Rev. Biomed. Eng. 2018;20:119–143. doi: 10.1146/annurev-bioeng-062117-121139. - DOI - PMC - PubMed
    1. Sun W., Chi S., Li Y., Ling S., Tan Y., Xu Y., Jiang F., Li J., Liu C., Zhong G., et al. The mechanosensitive Piezo1 channel is required for bone formation. eLife. 2019;8:e47454. doi: 10.7554/eLife.47454. - DOI - PMC - PubMed
    1. Sikavitsas V.I., Temenoff J.S., Mikos A.G. Biomaterials and bone mechanotransduction. Biomaterials. 2001;22:2581–2593. doi: 10.1016/S0142-9612(01)00002-3. - DOI - PubMed

Substances

LinkOut - more resources