Detection and Characterization of Nodularin by Using Label-Free Surface-Enhanced Spectroscopic Techniques
- PMID: 36555384
- PMCID: PMC9779585
- DOI: 10.3390/ijms232415741
Detection and Characterization of Nodularin by Using Label-Free Surface-Enhanced Spectroscopic Techniques
Abstract
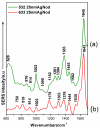
Nodularin (NOD) is a potent toxin produced by Nodularia spumigena cyanobacteria. Usually, NOD co-exists with other microcystins in environmental waters, a class of cyanotoxins secreted by certain cyanobacteria species, which makes identification difficult in the case of mixed toxins. Herein we report a complete theoretical DFT-vibrational Raman characterization of NOD along with the experimental drop-coating deposition Raman (DCDR) technique. In addition, we used the vibrational characterization to probe SERS analysis of NOD using colloidal silver nanoparticles (AgNPs), commercial nanopatterned substrates with periodic inverted pyramids (KlariteTM substrate), hydrophobic Tienta® SpecTrimTM slides, and in-house fabricated periodic nanotrenches by nanoimprint lithography (NIL). The 532 nm excitation source provided more well-defined bands even at LOD levels, as well as the best performance in terms of SERS intensity. This was reflected by the results obtained with the KlariteTM substrate and the silver-based colloidal system, which were the most promising detection approaches, providing the lowest limits of detection. A detection limit of 8.4 × 10⁻⁸ M was achieved for NOD in solution by using AgNPs. Theoretical computation of the complex vibrational modes of NOD was used for the first time to unambiguously assign all the specific vibrational Raman bands.
Keywords: Raman; SERS; cyanotoxin; microcystins; nodularin.
Conflict of interest statement
The authors declare no conflict of interest.
Figures


Similar articles
-
3D silver metallized nanotrenches fabricated by nanoimprint lithography as flexible SERS detection platform.Spectrochim Acta A Mol Biomol Spectrosc. 2022 Aug 5;276:121232. doi: 10.1016/j.saa.2022.121232. Epub 2022 Apr 8. Spectrochim Acta A Mol Biomol Spectrosc. 2022. PMID: 35429861
-
SERS of cylindrospermopsin cyanotoxin: Prospects for quantitative analysis in solution and in fish tissue.Spectrochim Acta A Mol Biomol Spectrosc. 2023 Feb 5;286:121984. doi: 10.1016/j.saa.2022.121984. Epub 2022 Oct 19. Spectrochim Acta A Mol Biomol Spectrosc. 2023. PMID: 36323082
-
Sedimentation of Nodularia spumigena and distribution of nodularin in the food web during transport of a cyanobacterial bloom from the Baltic Sea to the Kattegat.Harmful Algae. 2019 Jun;86:74-83. doi: 10.1016/j.hal.2019.05.005. Epub 2019 May 30. Harmful Algae. 2019. PMID: 31358279
-
Drop coating deposition Raman (DCDR) for microcystin-LR identification and quantitation.Environ Sci Technol. 2011 Jul 1;45(13):5644-51. doi: 10.1021/es200255y. Epub 2011 Jun 1. Environ Sci Technol. 2011. PMID: 21630655
-
Surface-enhanced Raman scattering: realization of localized surface plasmon resonance using unique substrates and methods.Anal Bioanal Chem. 2009 Aug;394(7):1747-60. doi: 10.1007/s00216-009-2762-4. Epub 2009 Apr 22. Anal Bioanal Chem. 2009. PMID: 19384546 Review.
Cited by
-
Solvent-driven biotoxin into nano-units as a versatile and sensitive SERS strategy.RSC Adv. 2023 Feb 3;13(7):4584-4589. doi: 10.1039/d2ra07216e. eCollection 2023 Jan 31. RSC Adv. 2023. PMID: 36760288 Free PMC article.
-
Unraveling surface-enhanced Raman spectroscopy results through chemometrics and machine learning: principles, progress, and trends.Anal Bioanal Chem. 2023 Jul;415(18):3945-3966. doi: 10.1007/s00216-023-04620-y. Epub 2023 Mar 3. Anal Bioanal Chem. 2023. PMID: 36864313 Free PMC article. Review.
-
Antibiotic SERS spectral analysis based on data augmentation and attention mechanism strategy.Anal Sci. 2025 Mar;41(3):251-261. doi: 10.1007/s44211-024-00695-4. Epub 2024 Dec 11. Anal Sci. 2025. PMID: 39661318
References
-
- Zahra Z., Choo D., Lee H., Parveen A. Cyanobacteria: Review of Current Potentials and Applications. Environments. 2020;7:13. doi: 10.3390/environments7020013. - DOI
MeSH terms
Substances
Grants and funding
- PN-III-P1-PD-2019-0562; PN-III-P1-1.1-TE-2021-0753/Unitatea Executiva Pentru Finantarea Invatamantului Superior a Cercetarii Dezvoltarii si Inovarii
- PN 19 35 02 01/Ministry of research, innovation and digitization
- PN-III-P1-1.2 Institutional Performance - Funding Projects for Excellence in RDI, Contract No. 37PFE/2022/Ministry of research, innovation and digitization
LinkOut - more resources
Full Text Sources
Miscellaneous

