. 2022 Dec 13;23(24):15794.
doi: 10.3390/ijms232415794.

Apoptosis Evaluation in Circulating CD34+-Enriched Hematopoietic Stem and Progenitor Cells in Patients with Abnormally Increased Production of Endogenous Glucocorticoids in Course of Cushing's Syndrome

Affiliations

Apoptosis Evaluation in Circulating CD34+-Enriched Hematopoietic Stem and Progenitor Cells in Patients with Abnormally Increased Production of Endogenous Glucocorticoids in Course of Cushing's Syndrome

Miłosz P Kawa et al. Int J Mol Sci. .

Abstract

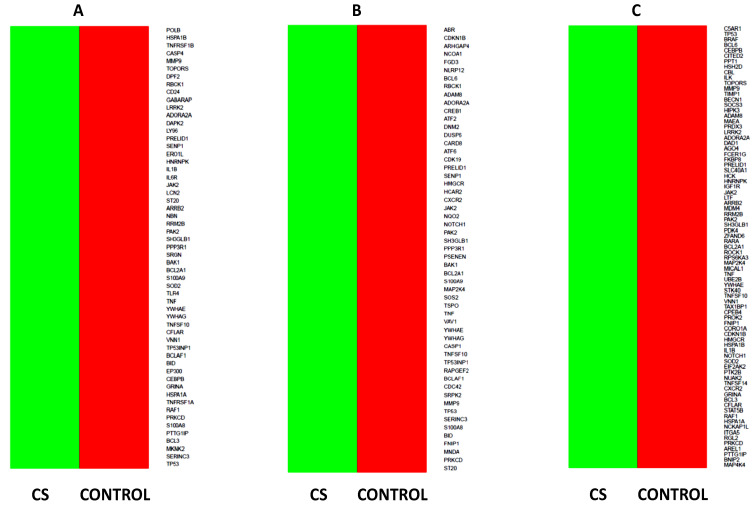
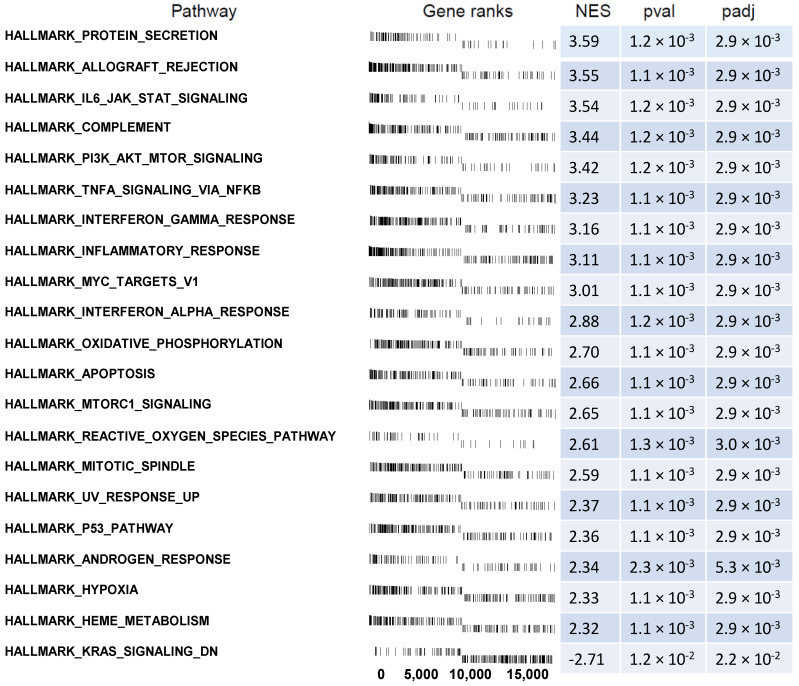
Abnormalities in hematological parameters of peripheral blood have been noted in patients with endogenous Cushing's Syndrome (CS) in the corticotropin (ACTH)-dependent and ACTH-independent forms. Nevertheless, the exact mechanism of glucocorticoids (GCs) action on human hematopoiesis is still not entirely clear. The aim of the study was to determine whether endogenous excessive production of GCs could affect apoptosis of CD34+ cells enriched in hematopoietic stem and progenitor cells (HSPCs) collected from the peripheral blood of newly diagnosed CS patients. Flow cytometry, Annexin-V enzyme-linked immunosorbent assay, TUNEL assay, real-time quantitative PCR, and microarray RNA/miRNA techniques were used to characterize CS patients' HSPCs. We found that the glucocorticoid receptor (GR) protein expression levels in CS were higher than in healthy controls. A complex analysis of apoptotic status of CS patients' HSPC cells showed that GCs significantly augmented apoptosis in peripheral blood-derived CD34+ cells and results obtained using different methods to detect early and late apoptosis in analyzed cell population were consistent. CS was also associated with significant upregulation in several members of the BCL-2 superfamily and other genes associated with apoptosis control. Furthermore, global gene expression analysis revealed significantly higher expression of genes associated with programmed cell death control in HSPCs from CS patients. These findings suggest that human endogenous GCs have a direct pro-apoptotic activity in hematopoietic CD34+ cells derived from CS subjects before treatment.

Keywords: BCL-2; Cushing’s Syndrome; RNA; apoptosis; glucocorticoids; hematopoietic stem and progenitor cells; microRNA; microarrays.


Conflict of interest statement

The authors declare no conflict of interest. The funders had no role in the design of the study; in the collection, analyses, or interpretation of data; in the writing of the manuscript; or in the decision to publish the results.

Figures

Figure 1
Figure 1
GRα expression in CD34+ cells from PB of patients with CS. ** p < 0.01 vs. control group.
Figure 2
Figure 2
Detection of early and late phase of apoptosis in CD34+ cells from CS patients. The percentage of CD34+ cells in the early (a) and late (b) phase of apoptosis was evaluated in control subjects and CS patients separated due to the cause of the endogenous glucocorticoid overproduction (AID-CS vs. AD-CS). The results are expressed as the mean value ± S.D. * p < 0.05; ** p < 0.01 vs. control subjects.
Figure 3
Figure 3
The expression profile of selected apoptosis-related molecules BAX (a), BCL-2 (b), and BCL-xL (c) in CD34+ cells from CS patients. The expression of selected apoptosis-related gene transcripts s was evaluated in CD34+ cells of controls and CS patients separated due to the cause of the endogenous glucocorticoid overproduction (AID-CS vs. AD-CS). The results are expressed as the mean value ± S.D. * p < 0.05; ** p < 0.01 vs. control subjects.
Figure 4
Figure 4
The scatter plot of global gene expression in CD34+ hematopoietic progenitor cells from CS patients when compared to the controls. Red points correspond to downregulated genes (at least two-fold change, p < 0.05), green points show upregulated genes (at least two-fold change, p < 0.05). The graph also contains names of the genes with the highest change in expression. The graph also contains names of the miRNA with the largest change in expression. On the horizontal axis (x-axis) are plotted data from the CS patient group in this study. On the vertical axis (y-axis) are plotted data from the healthy subject group, which serves as the control group in this study.
Figure 5
Figure 5
The bubble plot with changed biological processes related to apoptosis, assigned according to Gene Ontology (GO) classifications, in CD34+ hematopoietic progenitor cells from CS patients when compared to their healthy controls. Genes assigned to individual processes fulfilling the criteria of adjusted p < 0.05, method = Benjamini, and minimum number of genes per group = 100, are presented. Each bubble size reflects the number of differentially expressed genes represented in the corresponding annotation. The green color represents GO terms where genes are upregulated, while red corresponds to GO terms of downregulated genes. The transparency of the bubbles displays p-value (increased transparency is closer to the limit of p = 0.05).
Figure 6
Figure 6
Heatmaps show the dysregulated processes related to apoptosis (Apoptotic signaling pathway (A), Positive regulation of apoptotic process (B), Negative regulation of apoptotic process (C), Apoptotic mitochondrial changes (D), and Intrinsic apoptotic signaling pathway (E)) and their associated genes in CD34+ hematopoietic progenitor cells from CS patients compared to their healthy controls. Differentially expressed genes are marked by color (upregulated—green, downregulated—red). Colored boxes correspond to genes over the cut-off criteria (|fold| < 1.5, p > 0.05).
Figure 6
Figure 6
Heatmaps show the dysregulated processes related to apoptosis (Apoptotic signaling pathway (A), Positive regulation of apoptotic process (B), Negative regulation of apoptotic process (C), Apoptotic mitochondrial changes (D), and Intrinsic apoptotic signaling pathway (E)) and their associated genes in CD34+ hematopoietic progenitor cells from CS patients compared to their healthy controls. Differentially expressed genes are marked by color (upregulated—green, downregulated—red). Colored boxes correspond to genes over the cut-off criteria (|fold| < 1.5, p > 0.05).
Figure 7
Figure 7
Gene set enrichment analysis in CD34+ hematopoietic progenitor cells from CS patients using hallmark gene sets. A list of significantly enriched gene sets with appropriate gene ranks, normalized enrichment score (NES), p values (pval), and p values after FDR correction (padj) is displayed.
Figure 8
Figure 8
Gene set enrichment analysis in CD34+ hematopoietic progenitor cells from CS patients using KEGG gene sets. A list of significantly enriched gene sets with appropriate gene ranks, normalized enrichment score (NES), p values (pval), and p values after FDR correction (padj) is displayed.
Figure 9
Figure 9
Bioinformatics analysis of three enriched gene ontology (GO) groups related to biological processes regulating apoptosis in CD34+ hematopoietic progenitor cells from CS patients and controls. The processes disturbed in CD34+ hematopoietic progenitor cells from CS patients are selected and presented in the table on the right side of the pie chart. Each dot represents a single gene, which is upregulated due to GC activity in cells. Positive values of Z-score mapped on a red color scale are presented inside the graph.
Figure 10
Figure 10
The relationship between particular genes belonging to analyzed GO terms (Apoptotic mitochondrial changes, Positive regulation of apoptotic process, Negative regulation of apoptotic process) is mapped in a circos plot. All of the genes in CD34+ hematopoietic progenitor cells from CS patients were upregulated compared to controls. LogFC values and gene symbols are shown on the left side of the graph. The level of expression for each gene is marked using a red color (fold change one to three). Ribbons connecting areas of the circus plots also indicate shared genes between GO terms.
Figure 10
Figure 10
The relationship between particular genes belonging to analyzed GO terms (Apoptotic mitochondrial changes, Positive regulation of apoptotic process, Negative regulation of apoptotic process) is mapped in a circos plot. All of the genes in CD34+ hematopoietic progenitor cells from CS patients were upregulated compared to controls. LogFC values and gene symbols are shown on the left side of the graph. The level of expression for each gene is marked using a red color (fold change one to three). Ribbons connecting areas of the circus plots also indicate shared genes between GO terms.
Figure 11
Figure 11
The scatter plot of global miRNA expression in CD34+ hematopoietic progenitor cells from CS patients when compared to their controls. Red points correspond to downregulated genes (at least two-fold change, p < 0.05), green points indicate upregulated genes (at least two-fold change, p < 0.05). The graph also contains names of the miRNA with the largest change in expression. On the horizontal axis (x-axis) are plotted data from the CS patient group in this study. On the vertical axis (y-axis) are plotted data from the healthy subject group, which serves as the control group in this study.
Figure 12
Figure 12
This diagram shows significantly downregulated miRNAs (at least two-fold) in CD34+ hematopoietic stem and progenitor cells from CS patients. Target genes are assigned to each miRNA with a marked change in expression (at least two-fold) (green indicates upregulation; red indicates downregulation).

Similar articles

References

    1. Masri-Iraqi H., Robenshtok E., Tzvetov G., Manistersky Y., Shimon I. Elevated white blood cell counts in Cushing’s disease: Association with hypercortisolism. Pituitary. 2014;17:436–440. doi: 10.1007/s11102-013-0522-0. - DOI - PubMed
    1. Nakagawa M., Terashima T., D’yachkova Y., Bondy G., Hogg J., van Eeden S. Glucocorticoid-induced granulocytosis: Contribution of marrow release and demargination of intravascular granulocytes. Circulation. 1998;98:2307–2313. doi: 10.1161/01.CIR.98.21.2307. - DOI - PubMed
    1. Liles W., Dale D., Klebanoff S. Glucocorticoids inhibit apoptosis of human neutrophils. Blood. 1995;86:3181–3188. doi: 10.1182/blood.V86.8.3181.3181. - DOI - PubMed
    1. Zen M., Canova M., Campana C., Bettio S., Nalotto L., Rampudda M., Ramonda R., Iaccarino L., Doria A. The kaleidoscope of glucorticoid effects on immune system. Autoimmun. Rev. 2011;10:305–310. doi: 10.1016/j.autrev.2010.11.009. - DOI - PubMed
    1. Pitzalis C., Pipitone N., Bajocchi G., Hall M., Goulding N., Lee A., Kingsley G., Lanchbury J., Panayi G. Corticosteroids inhibit lymphocyte binding to endothelium and intercellular adhesion: An additional mechanism for their anti-inflammatory and immunosuppressive effect. J. Immunol. 1997;158:5007–5016. - PubMed

MeSH terms