. 2022 Dec 13;23(24):15802.
doi: 10.3390/ijms232415802.

The Educational Program of Macrophages toward a Hyperprogressive Disease-Related Phenotype Is Orchestrated by Tumor-Derived Extracellular Vesicles

Affiliations

The Educational Program of Macrophages toward a Hyperprogressive Disease-Related Phenotype Is Orchestrated by Tumor-Derived Extracellular Vesicles

Serena Indino et al. Int J Mol Sci. .

Abstract

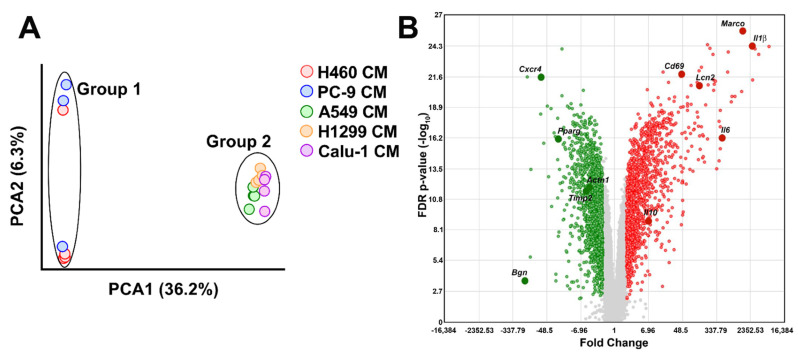
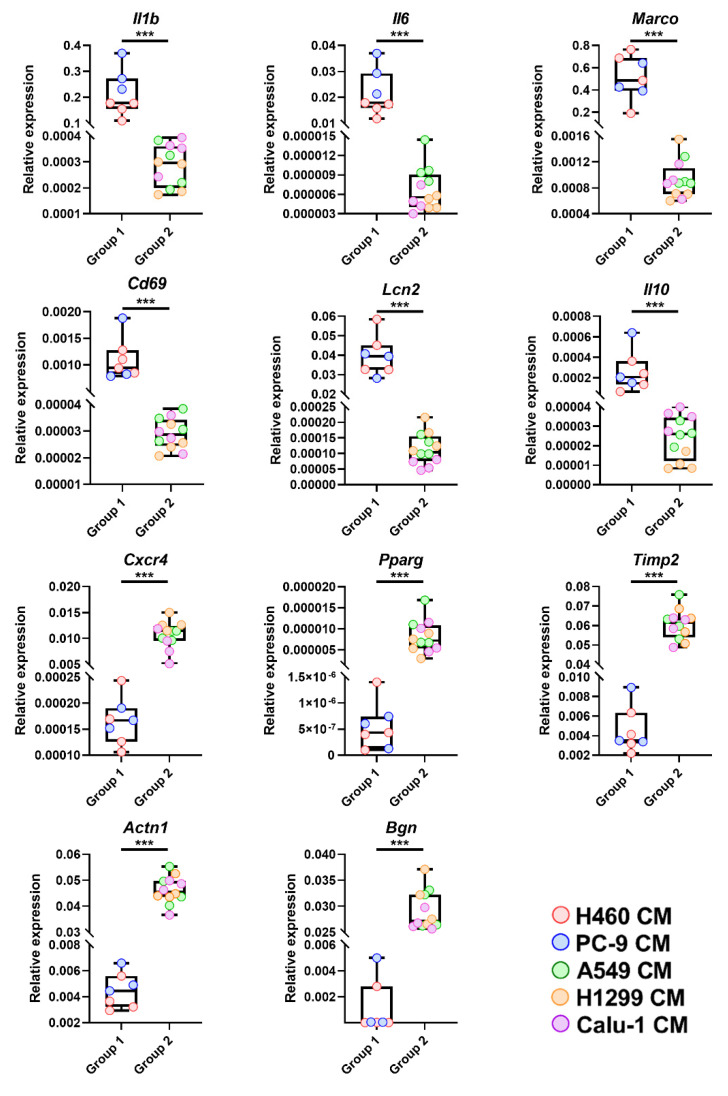
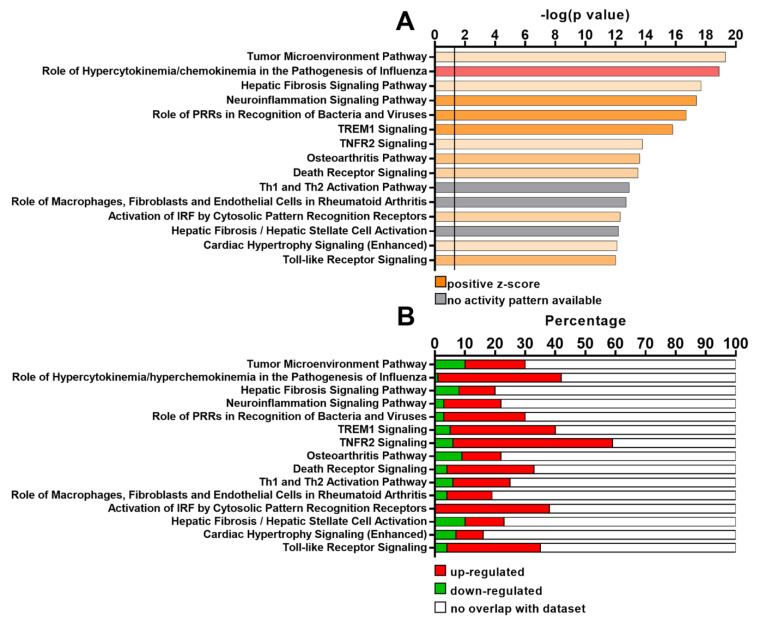
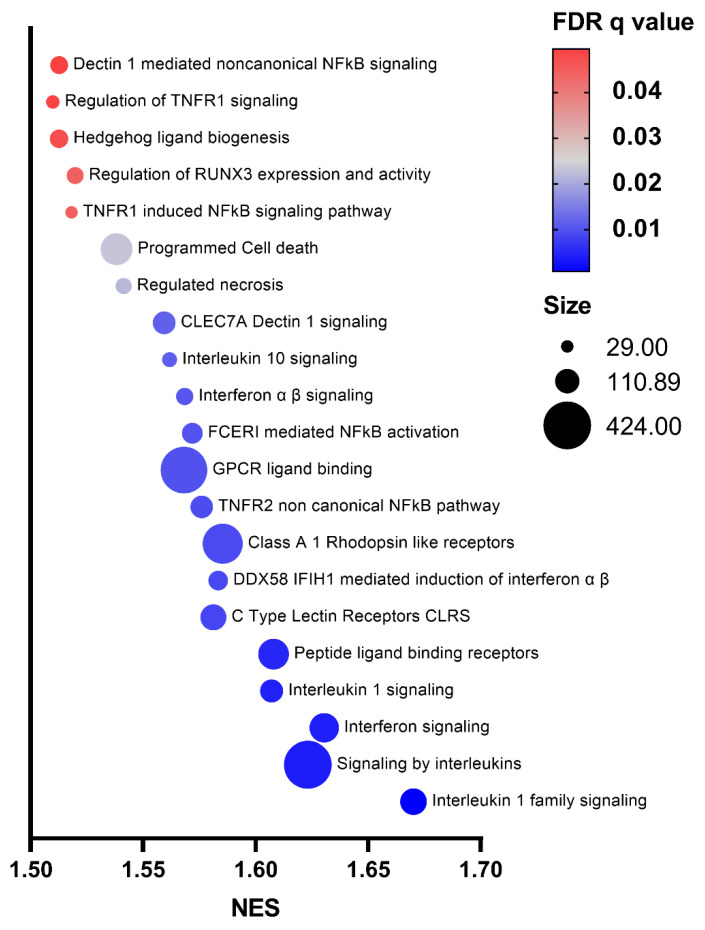
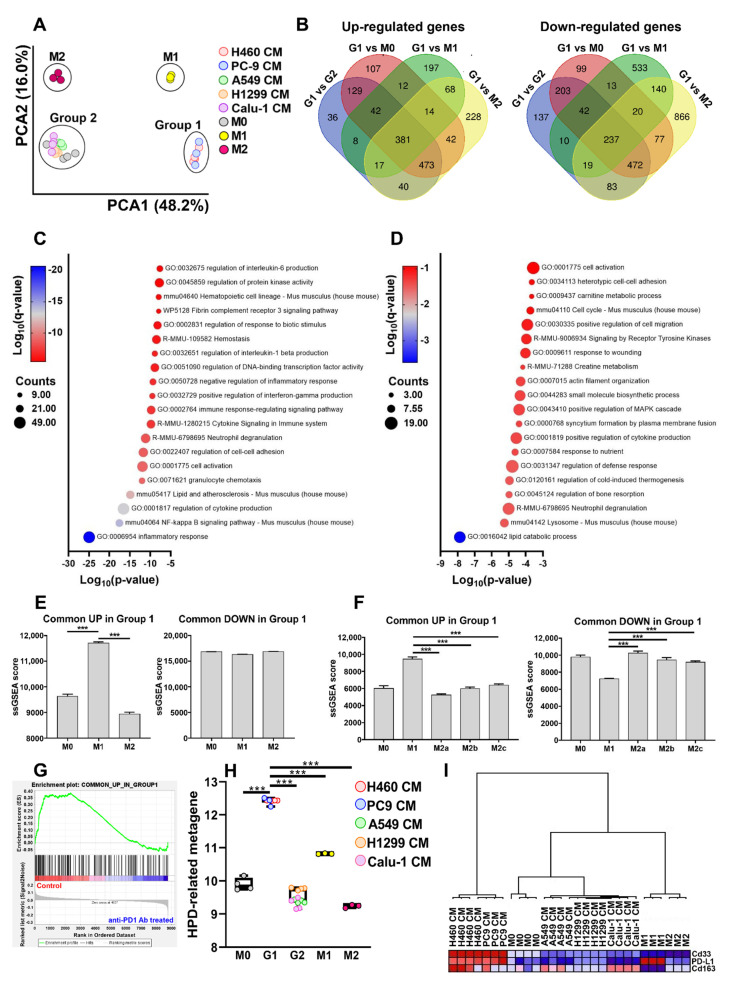
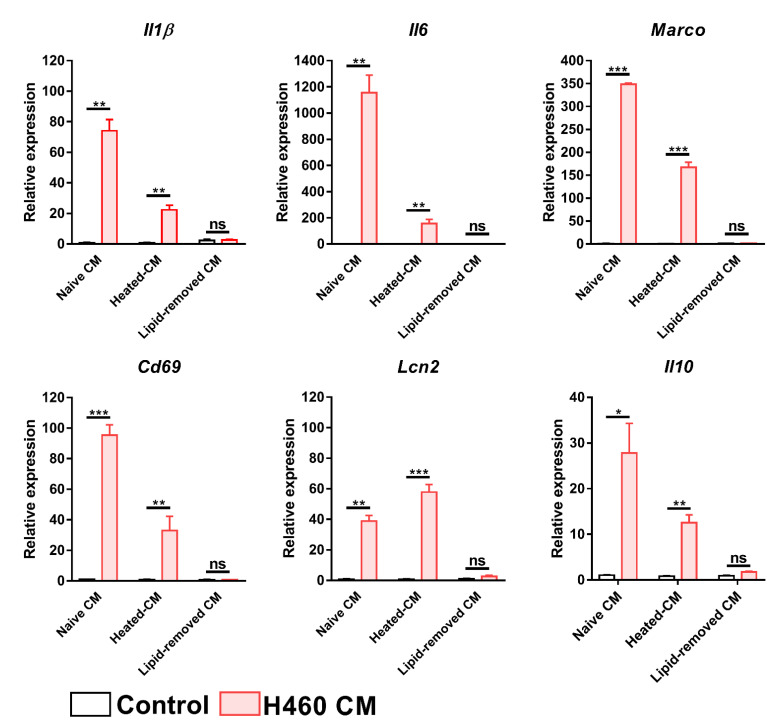
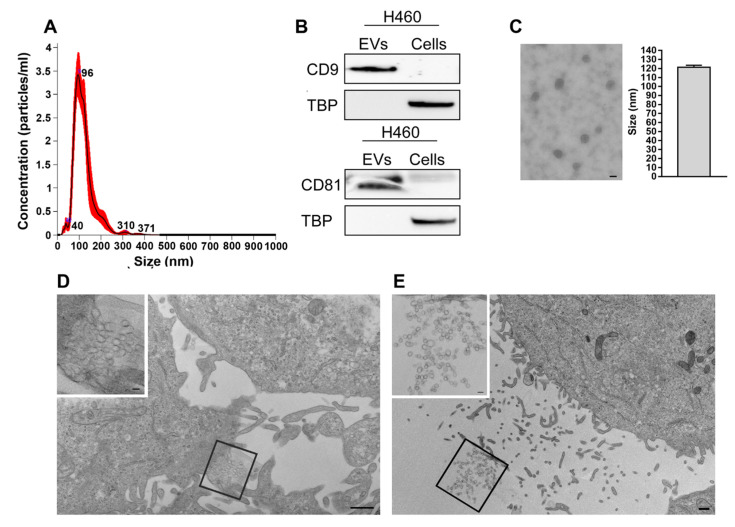
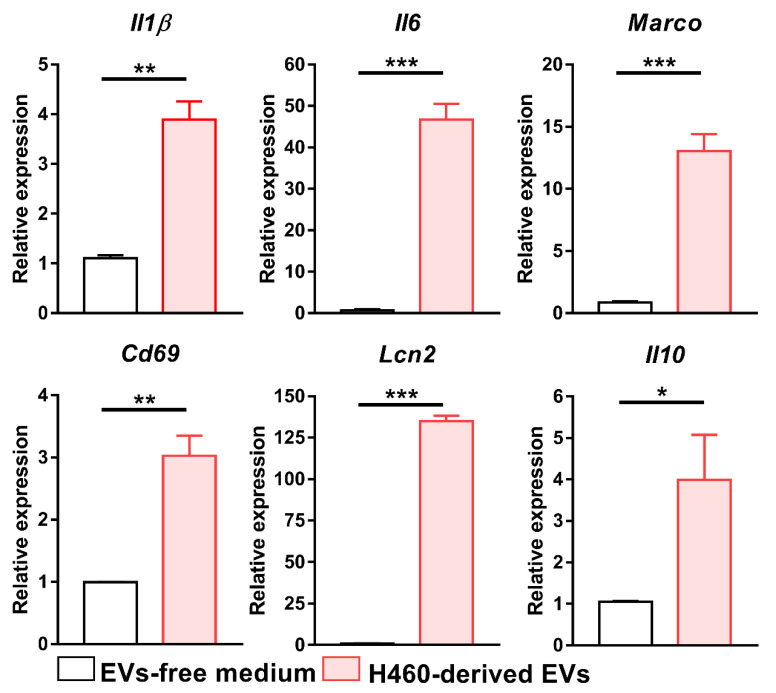
Hyperprogressive disease (HPD), an aggressive acceleration of tumor growth, was observed in a group of cancer patients treated with anti-PD1/PDL1 antibodies. The presence of a peculiar macrophage subset in the tumor microenvironment is reported to be a sort of "immunological prerequisite" for HPD development. These macrophages possess a unique phenotype that it is not clear how they acquire. We hypothesized that certain malignant cells may promote the induction of an "HPD-related" phenotype in macrophages. Bone-marrow-derived macrophages were exposed to the conditioned medium of five non-small cell lung cancer cell lines. Macrophage phenotype was analyzed by microarray gene expression profile and real-time PCR. We found that human NSCLC cell lines, reported as undergoing HPD-like tumor growth in immunodeficient mice, polarized macrophages towards a peculiar pro-inflammatory phenotype sharing both M1 and M2 features. Lipid-based factors contained in cancer cell-conditioned medium induced the over-expression of several pro-inflammatory cytokines and the activation of innate immune receptor signaling pathways. We also determined that tumor-derived Extracellular Vesicles represent the main components involved in the observed macrophage re-education program. The present study might represent the starting point for the future development of diagnostic tools to identify potential hyperprogressors.

Keywords: anti-PD1 antibody; extracellular vesicles; hyperprogressive disease; immune checkpoint inhibitors; macrophages.


Conflict of interest statement

The authors declare no conflict of interest.

Figures

Figure 1
Figure 1
Impact of NSCLC cell line CMs on BMDMs gene expression profile. (A) Global representation of normalized gene expression profile data of BMDMs exposed to the different CMs by PCA. Experimental groups segregated into two clusters defined as Group 1 (H460- and PC9-CMs stimulated macrophages) and Group 2 (A549-, H1299- and Calu-1-CMs stimulated macrophages). Each dot represents a sample. (B) Volcano plot of transcripts with FDR < 0.01 and −2 ≤ FC ≥ 2 resulted from the comparison between Group 1 and Group 2 BMDM gene profile data. In total, 1420 and 1626 transcripts are up- (red dots) and down-regulated (green dots), respectively. Plot shows the Fold Change on the X-axis versus FDR p-value (on a log10 scale) on the Y-axis. NSCLC: Non-small cell lung cancer; BMDMs: bone marrow-derived macrophages; PCA: principal component analysis.
Figure 2
Figure 2
Validation of gene expression profile data by real-time PCR. mRNA level of Il1β, Il6, Marco, Cd69, Lcn2, Il10, Cxcr4, Pparg, Timp2, Actin1 and Bgn, selected from the first quartile of the most up- (Il1β, Il6, Marco, Cd69, Lcn2, Il10) or down- (Cxcr4, Pparg, Timp2, Actin1, Bgn) regulated genes between Group 1 and Group 2 BMDMs (FDR < 0.01), was analyzed by real-time PCR. Results are presented as 2−ΔCt. *** p < 0.001 by two-tailed unpaired Student’s t-test or the Mann–Whitney U test for nonparametric distribution of data.
Figure 3
Figure 3
Functional analysis of BMDMs exposed to NSCLC cell line CMs by IPA. (A) Top 15 differentially regulated canonical pathways between Group 1 and Group 2 BMDMs resulted from IPA “Core Analysis” performed on annotated transcripts with FDR < 0.01 and −2 ≤ FC ≥ 2. The identified pathways are represented on the y-axis. On the x-axis, -log(p-value) as determined by Fisher’s exact test, is shown. The black straight line indicates the minimum significance level. (B) Stacked bar chart showing the percentage of up-regulated (red), down-regulated (green) and not overlapping (white) genes retrieved from our microarray analysis in each canonical pathway.
Figure 4
Figure 4
List of pathways emerged from GSEA analysis of Group 1 and Group 2 BMDMs. Bubble plot of the top 21 significant Reactome pathways (FDR q-value < 0.05) enriched in Group 1 macrophages as determined by GSEA analysis. The X-axis represents the normalized enrichment score (NES) and Y-axis indicates enriched pathway terms. Bubble area is proportional to the size of the gene set. Bubble color indicates the FDR q-value.
Figure 5
Figure 5
Analysis of NSCLC cell-mediated polarization skewing of BMDMs by bioinformatic analysis. (A) Global representation of normalized gene expression profile data of M0 (unstimulated), M1 (LPS + IFN-γ), M2 (IL-4) and NSCLC cell CM-stimulated macrophages by PCA. Each dot represents a sample. (B) Venn diagram showing the overlap between up- or down-modulated DEGs (FDR < 0.01 and −2 ≤ FC ≥ 2) emerged by comparing Group 1 to M0, M1, M2 and Group 2 macrophages. G1: Group 1 macrophages; G2: Group 2 macrophages. (C) Bubble plot of the top 20 clusters with their representative enriched terms (one per cluster) emerged by Metascape analysis of the “Common UP in Group 1” gene list. The X-axis represents the p-value in log base 10 and Y-axis indicates enriched pathway terms. Bubble size is proportional to the count that is the number of genes in the user-provided lists with membership in the given ontology term. Bubble color represents Log10(q-value) which is the multi-test adjusted p-value in log base 10. (D) Bubble plot of the top 20 clusters with their representative enriched terms (one per cluster) emerged by Metascape analysis of the “Common DOWN in Group 1” gene list. The X-axis represents the p-value in log base 10 and Y-axis indicates enriched pathway terms. Bubble size is proportional to the count that is the number of genes in the user-provided lists with membership in the given ontology term. Bubble color represents Log10(q-value) which is the multi-test adjusted p-value in log base 10. (E) ssGSEA enrichment scores of “Common UP in Group 1” and “Common DOWN in Group 1” gene sets in M0 (unstimulated), M1 (LPS + IFN-γ) and M2 (IL-4) macrophages. (F) ssGSEA enrichment scores of “Common UP in Group 1” and “Common DOWN in Group 1” gene sets in different macrophage subtypes. Gene expression data were retrieved from GSE32690. (G) GSEA enrichment plot of “Common UP in Group 1” gene set applied to gene expression profile data of H460 xenografts treated with saline (Control) or with anti-PD1 antibody (anti-PD1 treated). (H) Expression of “HPD-related metagene” in Group 1, Group 2, M0, M1 and M2 polarized BMDMs. G1: Group 1 macrophages; G2: Group 2 macrophages. (I) Hierarchical clustering based on the expression level of Cd33, PD-L1 and Cd163 genes retrieved from normalized gene expression profile data of Group 1, Group 2, M0, M1 and M2 polarized BMDMs. Data are presented as the mean ± SEM. *** p < 0.001 by One-way ANOVA followed by Tukey’s multiple comparison test.
Figure 6
Figure 6
Effect of protein and lipid removal from H460 CM on BMDMs. mRNA level of Il1β, Il6, Marco, Cd69, Lcn2 and Il10 genes, as determined by Real-Time PCR, after BMDMs exposure to H460 heated-CMs or lipid removed-CMs. Data were normalized to the housekeeping gene expression level (β2m) and analyzed by the comparative 2−ΔΔCt method. Data are presented as the mean ± SEM. * p < 0.05, ** p < 0.01, *** p < 0.001 by unpaired t-test; ns: not significant.
Figure 7
Figure 7
Characterization of EVs isolated from H460 cell line. (A) Size distribution of H460-derived EVs determined by NTA (NanoSight NS300 instrument-Malvern Panalytical). (B) Immunoblotting of the exosome-enriched proteins CD9 and CD81. H460 cellular lysates were used as a control for western blot analysis. TBP: TATA-binding protein, nuclear marker. (C) Representative electron microscopy image of EVs isolated from the conditioned media of H460 cells. EVs show the typical cup-shaped or round morphology of exosomes, as well as a compatible average diameter (≈120 nm). Scale bar = 100 nm. (D) Representative TEM image showing a new cluster of EVs enclosed by a membrane expelled by an H460 cell. Scale bar = 500 nm. In the upper left an enlargement of the boxed area. Scale bar = 100 nm. (E) Representative TEM image exhibiting scattered EVs in the extracellular milieu between H460 cells. Scale bar = 500 nm. In the upper left a greater enlargement of the outlined area. Scale bar = 100 nm.
Figure 8
Figure 8
Effect of H460 EVs on BMDMs. mRNA level of Il1β, Il6, Marco, Cd69, Lcn2 and Il10 genes, as determined by Real-Time PCR after BMDM exposure to H460-derived EVs, isolated by ultracentrifugation. Data were normalized to the housekeeping gene expression level (β2m) and analyzed by the comparative 2−ΔΔCt method. Data are presented as the mean ± SEM. * p < 0.05, ** p < 0.01, *** p < 0.001 by unpaired t-test.

Similar articles

Cited by

  • Impact of in vitro SARS-CoV-2 infection on breast cancer cells.
    Sommariva M, Dolci M, Triulzi T, Ambrogi F, Dugo M, De Cecco L, Le Noci V, Bernardo G, Anselmi M, Montanari E, Pupa SM, Signorini L, Gagliano N, Sfondrini L, Delbue S, Tagliabue E. Sommariva M, et al. Sci Rep. 2024 Jun 7;14(1):13134. doi: 10.1038/s41598-024-63804-3. Sci Rep. 2024. PMID: 38849411 Free PMC article.

References

    1. Champiat S., Dercle L., Ammari S., Massard C., Hollebecque A., Postel-Vinay S., Chaput N., Eggermont A., Marabelle A., Soria J.-C., et al. Hyperprogressive Disease Is a New Pattern of Progression in Cancer Patients Treated by Anti-PD-1/PD-L1. Clin. Cancer Res. 2017;23:1920–1928. doi: 10.1158/1078-0432.CCR-16-1741. - DOI - PubMed
    1. Camelliti S., Le Noci V., Bianchi F., Moscheni C., Arnaboldi F., Gagliano N., Balsari A., Garassino M.C., Tagliabue E., Sfondrini L., et al. Mechanisms of hyperprogressive disease after immune checkpoint inhibitor therapy: What we (don’t) know. J. Exp. Clin. Cancer Res. 2020;39:236. doi: 10.1186/s13046-020-01721-9. - DOI - PMC - PubMed
    1. Lo Russo G., Moro M., Sommariva M., Cancila V., Boeri M., Centonze G., Ferro S., Ganzinelli M., Gasparini P., Huber V., et al. Antibody-Fc/FcR Interaction on Macrophages as a Mechanism for Hyperprogressive Disease in Non-small Cell Lung Cancer Subsequent to PD-1/PD-L1 Blockade. Clin. Cancer Res. 2019;25:989–999. doi: 10.1158/1078-0432.CCR-18-1390. - DOI - PubMed
    1. Zhou J., Tang Z., Gao S., Li C., Feng Y., Zhou X. Tumor-Associated Macrophages: Recent Insights and Therapies. Front. Oncol. 2020;10:188. doi: 10.3389/fonc.2020.00188. - DOI - PMC - PubMed
    1. Wang H., Yung M.M.H., Ngan H.Y.S., Chan K.K.L., Chan D.W. The Impact of the Tumor Microenvironment on Macrophage Polarization in Cancer Metastatic Progression. Int. J. Mol. Sci. 2021;22:6560. doi: 10.3390/ijms22126560. - DOI - PMC - PubMed

Substances