

Differential Effects of Somatostatin, Octreotide, and Lanreotide on Neuroendocrine Differentiation and Proliferation in Established and Primary NET Cell Lines: Possible Crosstalk with TGF-β Signaling
- PMID: 36555512
- PMCID: PMC9781720
- DOI: 10.3390/ijms232415868
Differential Effects of Somatostatin, Octreotide, and Lanreotide on Neuroendocrine Differentiation and Proliferation in Established and Primary NET Cell Lines: Possible Crosstalk with TGF-β Signaling
Abstract
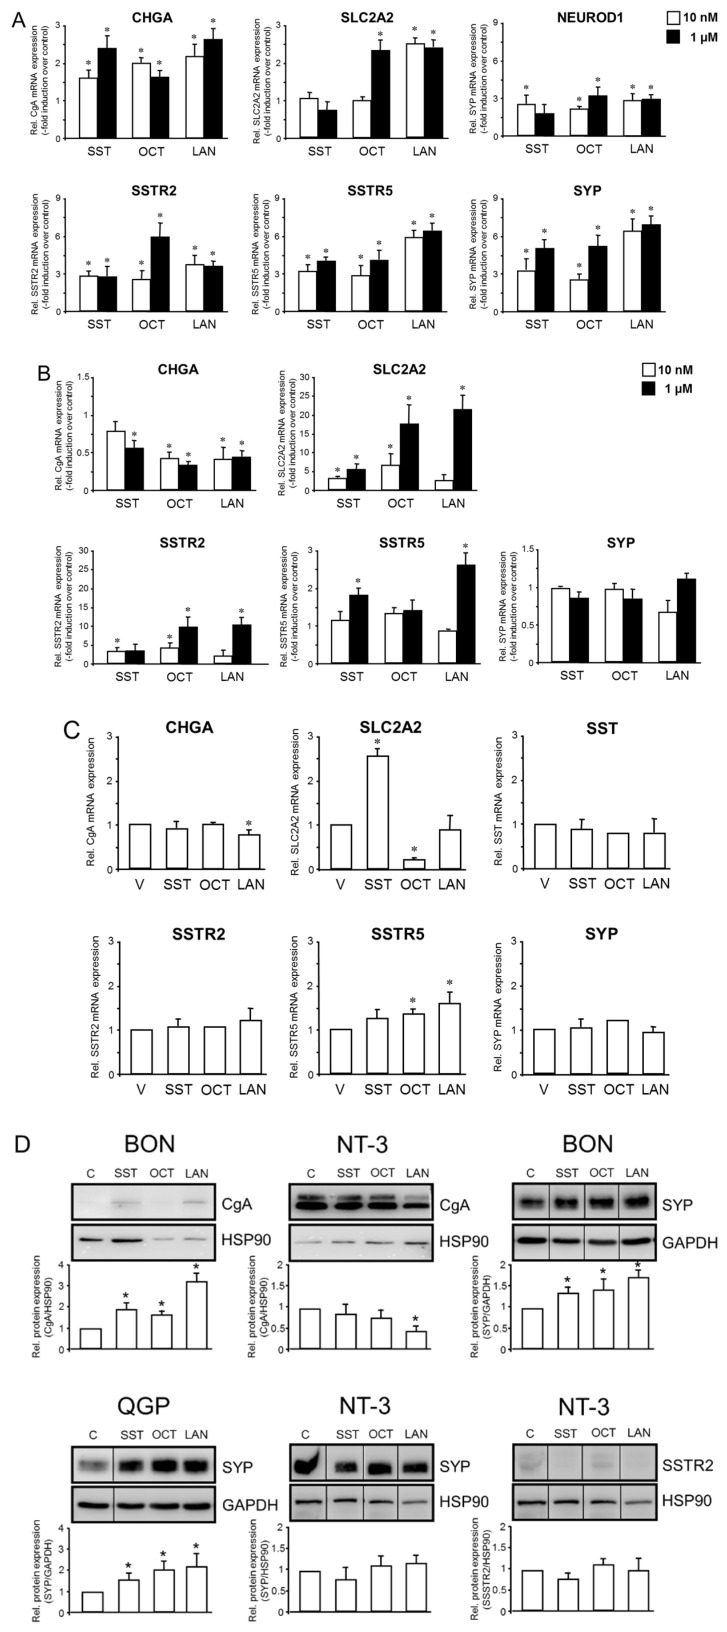
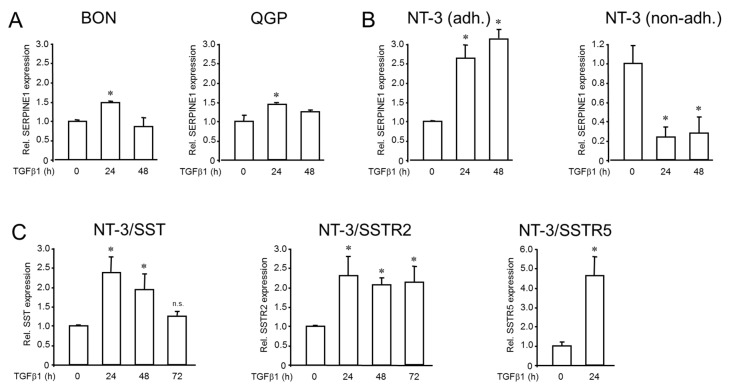
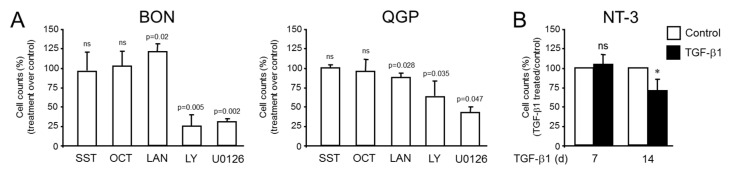
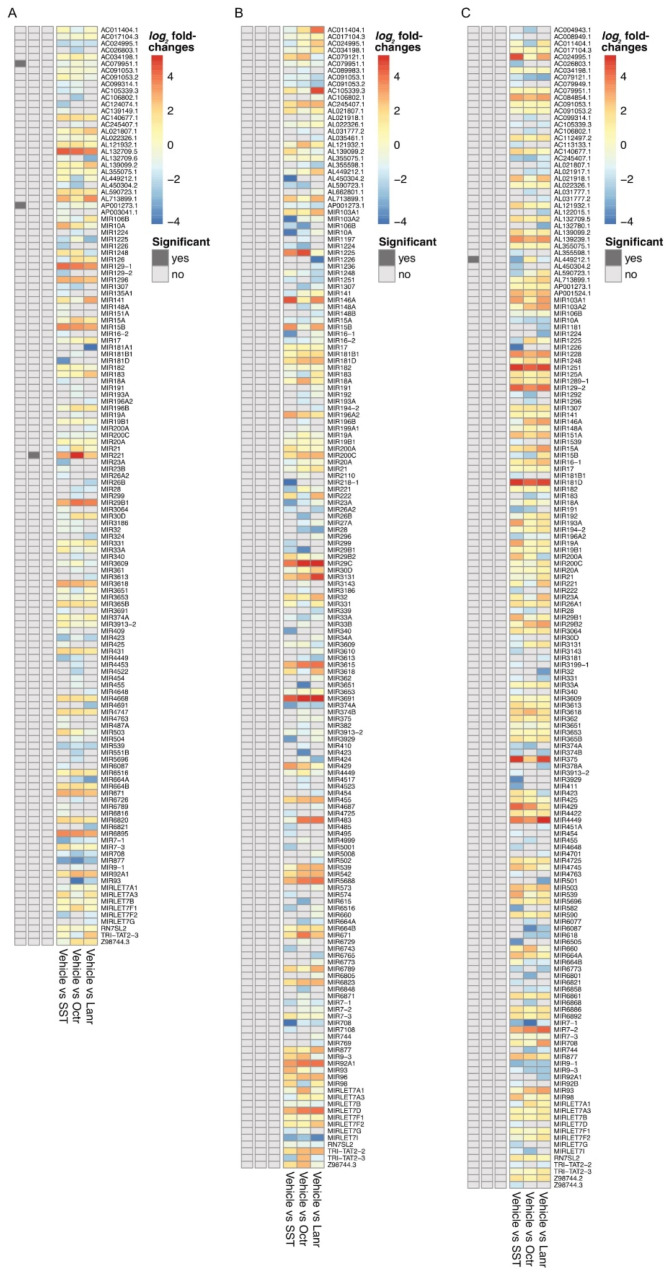
GEP-NETs are heterogeneous tumors originating from the pancreas (panNET) or the intestinal tract. Only a few patients with NETs are amenable to curative tumor resection, and for most patients, only palliative treatments to successfully control the disease or manage symptoms remain, such as with synthetic somatostatin (SST) analogs (SSAs), such as octreotide (OCT) or lanreotide (LAN). However, even cells expressing low levels of SST receptors (SSTRs) may exhibit significant responses to OCT, which suggests the possibility that SSAs signal through alternative mechanisms, e.g., transforming growth factor (TGF)-β. This signaling mode has been demonstrated in the established panNET line BON but not yet in other permanent (i.e., QGP) or primary (i.e., NT-3) panNET-derived cells. Here, we performed qPCR, immunoblot analyses, and cell counting assays to assess the effects of SST, OCT, LAN, and TGF-β1 on neuroendocrine marker expression and cell proliferation in NT-3, QGP, and BON cells. SST and SSAs were found to regulate a set of neuroendocrine genes in all three cell lines, with the effects of SST, mainly LAN, often differing from those of OCT. However, unlike NT-3 cells, BON cells failed to respond to OCT with growth arrest but paradoxically exhibited a growth-stimulatory effect after treatment with LAN. As previously shown for BON, NT-3 cells responded to TGF-β1 treatment with induction of expression of SST and SSTR2/5. Of note, the ability of NT-3 cells to respond to TGF-β1 with upregulation of the established TGF-β target gene SERPINE1 depended on cellular adherence to a collagen-coated matrix. Moreover, when applied to NT-3 cells for an extended period, i.e., 14 days, TGF-β1 induced growth suppression as shown earlier for BON cells. Finally, next-generation sequencing-based identification of microRNAs (miRNAs) in BON and NT-3 revealed that SST and OCT impact positively or negatively on the regulation of specific miRNAs. Our results suggest that primary panNET cells, such as NT-3, respond similarly as BON cells to SST, SSA, and TGF-β treatment and thus provide circumstantial evidence that crosstalk of SST and TGF-β signaling is not confined to BON cells but is a general feature of panNETs.
Keywords: BON-1 (BON); NT-3; QGP-1 (QGP); gastroenteropancreatic neuroendocrine tumor (GEP-NET); lanreotide (LAN); microRNA (miRNA); octreotide (OCT); somatostatin (SST); somatostatin analogues (SSAs).
Conflict of interest statement
The authors declare no conflict of interest.
Figures
Similar articles
-
Crosstalk of TGF-β and somatostatin signaling in adenocarcinoma and neuroendocrine tumors of the pancreas: a brief review.Front Endocrinol (Lausanne). 2025 Mar 11;16:1511348. doi: 10.3389/fendo.2025.1511348. eCollection 2025. Front Endocrinol (Lausanne). 2025. PMID: 40134804 Free PMC article. Review.
-
The effect of transforming growth factor beta on human neuroendocrine tumor BON cell proliferation and differentiation is mediated through somatostatin signaling.Mol Cancer Res. 2008 Jun;6(6):1029-42. doi: 10.1158/1541-7786.MCR-07-2073. Mol Cancer Res. 2008. PMID: 18567806
-
Effects of Somatostatin Analogs and Dopamine Agonists on Insulin-Like Growth Factor 2-Induced Insulin Receptor Isoform A Activation by Gastroenteropancreatic Neuroendocrine Tumor Cells.Neuroendocrinology. 2016;103(6):815-25. doi: 10.1159/000444280. Epub 2016 Feb 2. Neuroendocrinology. 2016. PMID: 26836610
-
A Comprehensive Molecular Characterization of the Pancreatic Neuroendocrine Tumor Cell Lines BON-1 and QGP-1.Cancers (Basel). 2020 Mar 14;12(3):691. doi: 10.3390/cancers12030691. Cancers (Basel). 2020. PMID: 32183367 Free PMC article.
-
Long-acting somatostatin analogs and well differentiated neuroendocrine tumors: a 20-year-old story.J Endocrinol Invest. 2024 Jan;47(1):35-46. doi: 10.1007/s40618-023-02170-9. Epub 2023 Aug 15. J Endocrinol Invest. 2024. PMID: 37581846 Free PMC article. Review.
Cited by
-
Characterization of Epithelial-Mesenchymal and Neuroendocrine Differentiation States in Pancreatic and Small Cell Ovarian Tumor Cells and Their Modulation by TGF-β1 and BMP-7.Cells. 2024 Dec 5;13(23):2010. doi: 10.3390/cells13232010. Cells. 2024. PMID: 39682758 Free PMC article.
-
Assessing the diagnostic, prognostic, and therapeutic potential of the somatostatin/cortistatin system in glioblastoma.Cell Mol Life Sci. 2025 Apr 23;82(1):173. doi: 10.1007/s00018-025-05687-9. Cell Mol Life Sci. 2025. PMID: 40268793 Free PMC article.
-
Crosstalk of TGF-β and somatostatin signaling in adenocarcinoma and neuroendocrine tumors of the pancreas: a brief review.Front Endocrinol (Lausanne). 2025 Mar 11;16:1511348. doi: 10.3389/fendo.2025.1511348. eCollection 2025. Front Endocrinol (Lausanne). 2025. PMID: 40134804 Free PMC article. Review.
-
Oncogenic pathway signatures predict the risk of progression and recurrence in well-differentiated pancreatic neuroendocrine tumors.J Surg Oncol. 2024 Oct;130(5):1070-1077. doi: 10.1002/jso.27830. Epub 2024 Aug 19. J Surg Oncol. 2024. PMID: 39155697 Free PMC article.
-
"Cold" Somatostatin Analogs in Neuroendocrine Neoplasms: Decoding Mechanisms, Overcoming Resistance, and Shaping the Future of Therapy.Cells. 2025 Feb 9;14(4):245. doi: 10.3390/cells14040245. Cells. 2025. PMID: 39996718 Free PMC article. Review.
References
-
- Herrera-Martínez A.D., Gahete M.D., Pedraza-Arevalo S., Sánchez-Sánchez R., Ortega-Salas R., Serrano-Blanch R., Luque R.M., Gálvez-Moreno M.A., Castaño J.P. Clinical and functional implication of the components of somatostatin system in gastroenteropancreatic neuroendocrine tumors. Endocrine. 2018;59:426–437. doi: 10.1007/s12020-017-1482-3. - DOI - PubMed
-
- Evers B.M., Townsend C.M., Jr., Upp J.R., Allen E., Hurlbut S.C., Kim S.W., Rajaraman S., Singh P., Reubi J.C., Thompson J.C. Establishment and characterization of a human carcinoid in nude mice and effect of various agents on tumor growth. Gastroenterology. 1991;101:303–311. doi: 10.1016/0016-5085(91)90004-5. - DOI - PubMed
MeSH terms
Substances
Grants and funding
LinkOut - more resources
Full Text Sources
Medical
Research Materials
Miscellaneous
