Effects of Light Intensity on Physiological Characteristics and Expression of Genes in Coumarin Biosynthetic Pathway of Angelica dahurica
- PMID: 36555551
- PMCID: PMC9781474
- DOI: 10.3390/ijms232415912
Effects of Light Intensity on Physiological Characteristics and Expression of Genes in Coumarin Biosynthetic Pathway of Angelica dahurica
Abstract
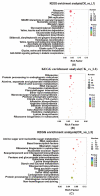
Plants are affected by changes in light and adaptation mechanisms can affect secondary metabolite synthesis. In this study, the physiological response and regulation of the coumarin biosynthetic pathway of Angelica dahurica to different light intensities (natural light (CK), shade rate 50% (L1), shade rate 70% (L2), and shade rate 90% (L3)) were examined. The chlorophyll content, level of the enzymes of the antioxidant system, extent of lipid peroxidation, and concentrations of the osmoregulatory solute levels were determined in potted plants. Root transcriptome under different light intensities was sequenced using high-throughput technology, and differentially expressed genes (DEGs) related to coumarin biosynthesis were analyzed by quantitative real-time PCR (qRT-PCR). With increasing shade, Chl a, Chl b, Chl a + b, and Chl a/b content increased, while the Chl a/b ratio decreased. The antioxidant enzyme system activity and extent of membrane lipid peroxidation increased. The soluble protein (SP) and proline (Pro) content decreased with the reduction in the light intensity, and soluble sugar (SS) content was found to be highest at 50% shade. The RNA-seq analysis showed that 9388 genes were differentially expressed in the L3 group (7561 were upregulated and 1827 were downregulated). In both the L1 and L2 groups, DEGs were significantly enriched in "Ribosome biosynthesis"; meanwhile, in the L3 group, the DEGs were significantly enriched in "Amino and ribonucleotide sugar metabolism" in KEGG metabolic pathway analysis. Additionally, 4CL (TRINITY_DN40230_c0_g2) and COMT (TRINITY_DN21272_c0_g1) of the phenylpropanoid metabolic pathway were significantly downregulated in the L3 group. In conclusion, A. dahurica grew best under 50% shade and the secondary-metabolite coumarin biosynthetic pathway was inhibited by 90% shade, affecting the yield and quality of medicinal compounds.
Keywords: Angelica dahurica; coumarin biosynthesis; gene expression; light intensity; physiological characteristics.
Conflict of interest statement
The authors declare no conflict of interest.
Figures


Similar articles
-
De novo transcriptome assembly of Angelica dahurica and characterization of coumarin biosynthesis pathway genes.Gene. 2021 Jul 30;791:145713. doi: 10.1016/j.gene.2021.145713. Epub 2021 May 9. Gene. 2021. PMID: 33979682
-
Transcriptome analysis provides insights into coumarin biosynthesis in the medicinal plant Angelica dahurica cv. Yubaizhi.Gene. 2023 Dec 20;888:147757. doi: 10.1016/j.gene.2023.147757. Epub 2023 Sep 3. Gene. 2023. PMID: 37661027
-
AdNAC20 Regulates Lignin and Coumarin Biosynthesis in the Roots of Angelica dahurica var. Formosana.Int J Mol Sci. 2024 Jul 22;25(14):7998. doi: 10.3390/ijms25147998. Int J Mol Sci. 2024. PMID: 39063240 Free PMC article.
-
The Angelica dahurica: A Review of Traditional Uses, Phytochemistry and Pharmacology.Front Pharmacol. 2022 Jul 1;13:896637. doi: 10.3389/fphar.2022.896637. eCollection 2022. Front Pharmacol. 2022. PMID: 35847034 Free PMC article. Review.
-
Pharmacological and biochemical actions of simple coumarins: natural products with therapeutic potential.Gen Pharmacol. 1996 Jun;27(4):713-22. doi: 10.1016/0306-3623(95)02112-4. Gen Pharmacol. 1996. PMID: 8853310 Review.
Cited by
-
Potential regulatory genes of light induced anthocyanin accumulation in sweet cherry identified by combining transcriptome and metabolome analysis.Front Plant Sci. 2023 Aug 16;14:1238624. doi: 10.3389/fpls.2023.1238624. eCollection 2023. Front Plant Sci. 2023. PMID: 37662172 Free PMC article.
-
Carex parva and Carex scabrirostris adopt diverse response strategies to adapt to low-light conditions.Front Plant Sci. 2024 Oct 14;15:1432539. doi: 10.3389/fpls.2024.1432539. eCollection 2024. Front Plant Sci. 2024. PMID: 39469055 Free PMC article.
-
The biosynthetic pathway of coumarin and its genetic regulation in response to biotic and abiotic stresses.Front Plant Sci. 2025 Jun 19;16:1599591. doi: 10.3389/fpls.2025.1599591. eCollection 2025. Front Plant Sci. 2025. PMID: 40612619 Free PMC article. Review.
-
Effect of IAA on coumarins synthesis in Angelica dahurica under soil compactness stress.Sci Rep. 2025 Feb 20;15(1):6148. doi: 10.1038/s41598-025-90647-3. Sci Rep. 2025. PMID: 39979439 Free PMC article.
-
Transcriptome and metabolome analysis reveals mechanism of light intensity modulating iridoid biosynthesis in Gentiana macrophylla Pall.BMC Plant Biol. 2024 Jun 11;24(1):526. doi: 10.1186/s12870-024-05217-y. BMC Plant Biol. 2024. PMID: 38858643 Free PMC article.
References
-
- Pawłowska B., Żupnik M., Szewczyk-Taranek B., Cioć M. Impact of LED light sources on morphogenesis and levels of photosynthetic pigments in Gerbera jamesonii grown in vitro. Hortic. Environ. Biotechnol. 2018;59:115–123. doi: 10.1007/s13580-018-0012-4. - DOI
-
- Gabr A.M.M., Ebrahim H.S., El-Ashry A.A.E.-L., El-Bahr M.K. Importance of Artificial Environment Conditions on Plant Biotechnology, Plant Growth, and Secondary Metabolites. IGI Global; Chocolate avenue Hershey PA, USA: 2021. pp. 292–319.
-
- Shin K.S., Murthy H.N., Heo J.W., Hahn E.J., Paek K.Y. The effect of light quality on the growth and development of in vitro cultured Doritaenopsis plants. Acta Physiol. Plant. 2008;30:339–343. doi: 10.1007/s11738-007-0128-0. - DOI
MeSH terms
Substances
Grants and funding
LinkOut - more resources
Full Text Sources
Research Materials
Miscellaneous

