. 2022 Dec 15;23(24):15954.
doi: 10.3390/ijms232415954.

Red-Emitting Latex Nanoparticles by Stepwise Entrapment of β-Diketonate Europium Complexes

Affiliations

Red-Emitting Latex Nanoparticles by Stepwise Entrapment of β-Diketonate Europium Complexes

Hwan-Woo Park et al. Int J Mol Sci. .

Abstract

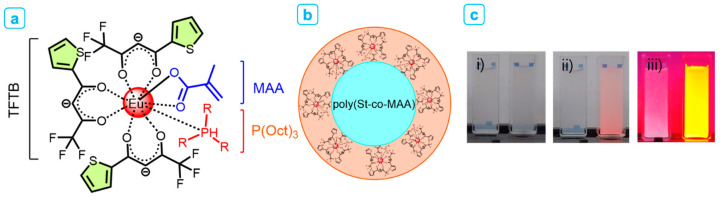
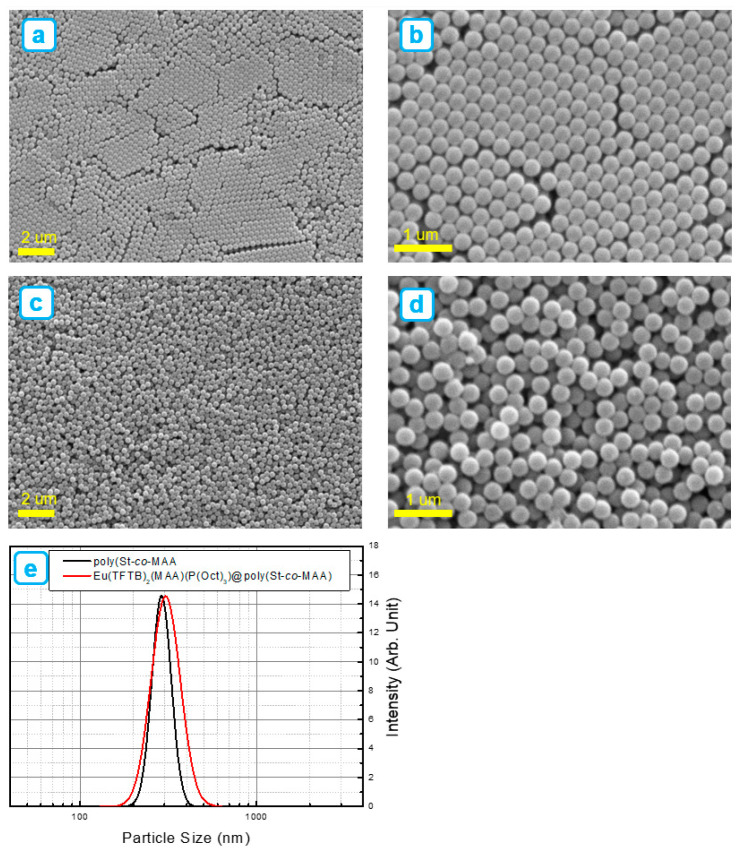
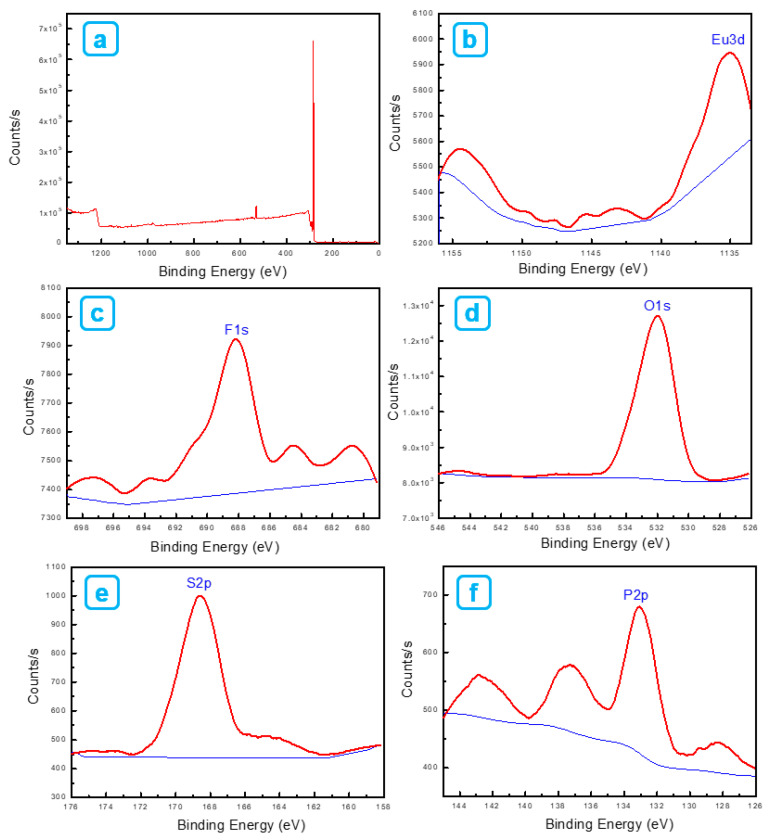
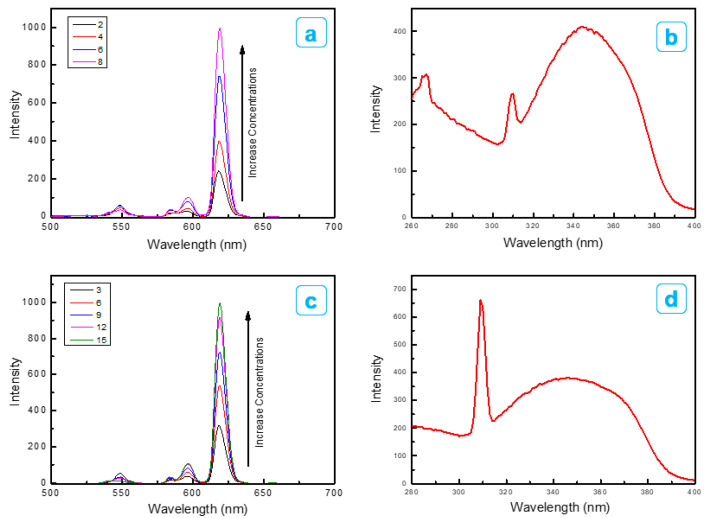
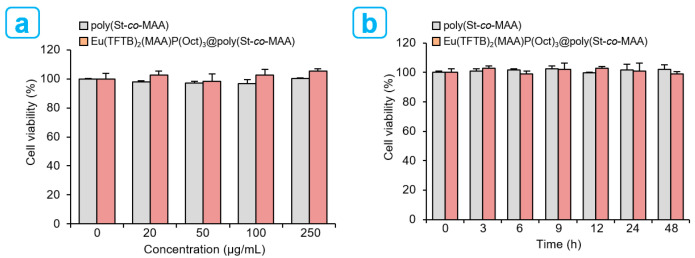
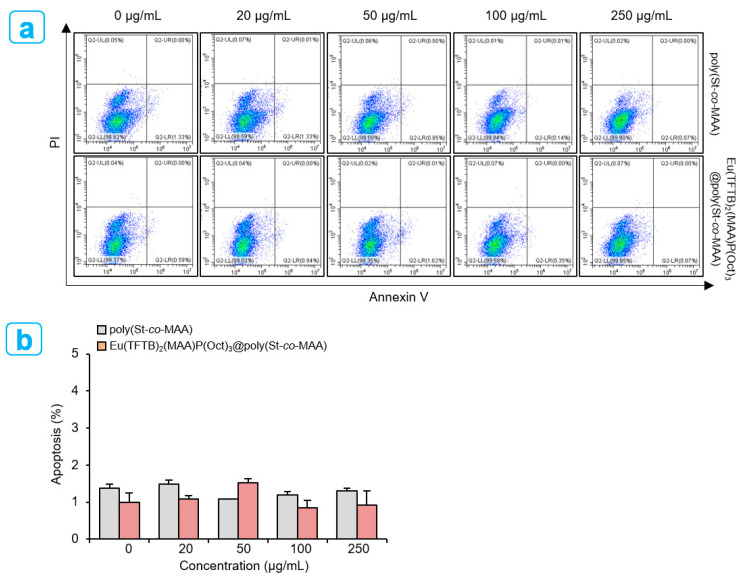
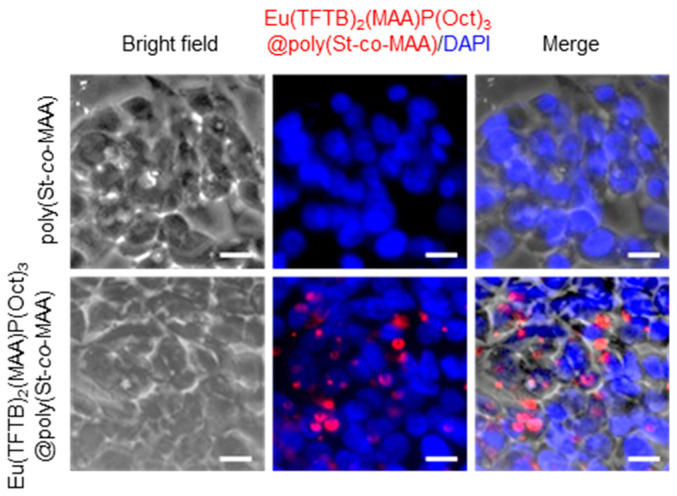
The core-shell structure of poly(St-co-MAA) nanoparticles containing β-diketonate Eu3+ complexes were synthesized by a step-wise process. The β-diketonate Eu3+ complexes of Eu (TFTB)2(MAA)P(Oct)3 [europium (III); 4,4,4-Trifluoro-1-(2-thienyl)-1,3-butanedione = TFTB; trioctylphosphine = (P(Oct)3); methacrylic acid = MAA] were incorporated to poly(St-co-MAA). The poly(St-co-MAA) has highly monodispersed with a size of 300 nm, and surface charges of the poly(St-co-MAA) are near to neutral. The narrow particle size distribution was due to the constant ionic strength of the polymerization medium. The activated carboxylic acid of poly(St-co-MAA) further chelated with europium complex and polymerize between acrylic groups of poly(St-co-MAA) and Eu(TFTB)2(MAA)P(Oct)3. The Em spectra of europium complexes consist of multiple bands of Em at 585, 597, 612 and 650 nm, which are assigned to 5D07FJ (J = 0-3) transitions of Eu3+, respectively. The maximum Em peak is at 621 nm, which indicates a strong red Em characteristic associated with the electric dipole 5D07F2 transition of Eu3+ complexes. The cell-specific fluorescence of Eu(TFTB)2(MAA)P(Oct)3@poly(St-co-MAA) indicated endocytosis of Eu(TFTB)2(MAA)P(Oct)3@poly(St-co-MAA). There are fewer early apoptotic, late apoptotic and necrotic cells in each sample compared with live cells, regardless of the culture period. Eu(TFTB)2(MAA)P(Oct)3@poly(St-co-MAA) synthesized in this work can be excited in the full UV range with a maximum Em at 619 nm. Moreover, these particles can substitute red luminescent organic dyes for intracellular trafficking and cellular imaging agents.

Keywords: LFIA; europium complex; photoluminescence; polystyrene; β-diketone.


Conflict of interest statement

The authors declare no conflict of interest.

Figures

Figure 1
Figure 1
Schematic representation of (a) chemical structure of β-diketonate Eu3+ complexes of Eu(TFTB)2(MAA)P(Oct)3 and (b) core–shell structure of Eu(TFTB)2(MAA)P(Oct)3@poly(St-co-MAA). (c) photograph images of poly(St-co-MAA) (left) and Eu(TFTB)2(MAA)P(Oct)3@poly(St-co-MAA) (right) dispersed in water were taken under (i) daylight, (ii) day and UV light (λex at 365 nm) and (iii) UV light.
Figure 2
Figure 2
SEM images of synthesized: (a,b) polystyrene (poly(St-co-MAA) nanoparticles, (c,d) after modifying poly(St-co-MAA) nanoparticles with β-diketonate Eu3+ complexes of Eu(TFTB)2(MAA)P(Oct)3 resulting in Eu(TFTB)2(MAA)P(Oct)3@poly(St-co-MAA). (e) Particle size distributions of poly(St-co-MAA) and Eu(TFTB)2(MAA)P(Oct)3@poly(St-co-MAA) nanoparticles.
Figure 3
Figure 3
Thermal degradation profile and DSC curve of poly(St-co-MAA) and Eu(TFTB)2(MAA)P(Oct)3@poly(St-co-MAA) particles.
Figure 4
Figure 4
FTIR transmittance spectra of poly(St-co-MAA), Eu(TFTB)2(MAA)P(Oct)3 and Eu(TFTB)2(MAA)P(Oct)3@poly(St-co-MAA).
Figure 5
Figure 5
(a) X-ray photoelectron spectroscopy survey spectra of Eu(TFTB)2(MAA)P(Oct)3@poly(St-co-MAA). (b) Eu3d core-level spectrum, (c) F1s core-level spectrum, (d) O1s core-level spectrum, (e) S2p core-level spectrum and (f) P2p core-level spectrum of Eu(TFTB)2(MAA)P(Oct)3@poly(St-co-MAA).
Figure 6
Figure 6
(a) Emission spectrum (λex at 350 nm) and (b) excitation spectrum (λem at 621 nm) Eu(TFTB)2(MAA)P(Oct)3 dispersed in water and (c) Emission spectra (λex at 342 nm) and (d) excitation spectrum (λem at 621 nm) at 298 K for 5D07Dj transition depending on different concentration of Eu(TFTB)2(MAA)P(Oct)3@poly(St-co-MAA) dispersed in water.
Figure 7
Figure 7
Luminescence decay curves for Eu(TFTB)2(MAA)(P(Oct)3) (red) and Eu(TFTB)2(MAA)(P(Oct)3)@poly(St-co-MAA) (blue) dispersed in water (λem = 615 nm, λex = 375 nm). Plotted with (a) time (ns) versus intensity, (b) time (ns) versus natural logarithm (I/I0) and (c) time (ns) versus logarithmic intensity.
Figure 8
Figure 8
Cell viability of HepG2 cells treated with poly(St-co-MAA) and Eu(TFTB)2(MAA)P(Oct)3@poly(St-co-MAA) by WST-8 assay. (a) Concentration-dependent cell viability of HepG2 cells treated with control and 20, 50, 100 and 250 μg/mL of poly(St-co-MAA) and Eu(TFTB)2(MAA)P(Oct)3@poly(St-co-MAA) dispersed in PBS for 24 h. (b) Time-dependent cell viability of HepG2 cells treated with 100 µg/mL of poly(St-co-MAA) and Eu(TFTB)2(MAA)P(Oct)3@poly(St-co-MAA) for different incubation times of 0, 3, 6, 9, 12, 24 and 48 h.
Figure 9
Figure 9
(a) Concentration-dependent cell viability of HepG2 cells treated with 20, 50, 100 and 250 µg/mL of poly(St-co-MAA) and Eu(TFTB)2(MAA)P(Oct)3@poly(St-co-MAA) nanoparticles for 24 h. The cells were stained with Annexin V-FITC and quantified for apoptosis by flow cytometer. Top right quadrant, dead cells in late stage of apoptosis; bottom right quadrant, cells undergoing apoptosis; bottom left quadrant, viable cells. (b) The rate of apoptosis depends on the concentration of poly(St-co-MAA) and Eu(TFTB)2(MAA)P(Oct)3@poly(St-co-MAA) nanoparticles. Data are shown as means ± SEM. Results are representative of at least three independent experiments.
Figure 10
Figure 10
Fluorescence images of intracellular uptake and trafficking of poly(St-co-MAA) and Eu(TFTB)2(MAA)P(Oct)3@poly(St-co-MAA) in HepG2 cells. Nuclei were stained with DAPI (blue). Scale bar, 20 µm.

Similar articles

Cited by

References

    1. Soh J.H., Chan H.-M., Ying J.Y. Strategies for developing sensitive and specific nanoparticle-based lateral flow assays as point-of-care diagnostic device. Nano Today. 2020;30:100831. doi: 10.1016/j.nantod.2019.100831. - DOI
    1. Khlebtsov B.N., Tumskiy R.S., Burov A.M., Pylaev T.E., Khlebtsov N.G. Quantifying the Numbers of Gold Nanoparticles in the Test Zone of Lateral Flow Immunoassay Strips. ACS Appl. Nano Mater. 2019;2:5020–5028. doi: 10.1021/acsanm.9b00956. - DOI
    1. Qiu W., Baryeh K., Takalkar S., Chen W., Liu G. Carbon nanotube-based lateral flow immunoassay for ultrasensitive detection of proteins: Application to the determination of IgG. Microchim. Acta. 2019;186:436. doi: 10.1007/s00604-019-3508-4. - DOI - PubMed
    1. Azuma T., Hui Y.Y., Chen O.Y., Wang Y.-L., Chang H.-C. Thermometric lateral flow immunoassay with colored latex beads as reporters for COVID-19 testing. Sci. Rep. 2022;12:3905. doi: 10.1038/s41598-022-07963-1. - DOI - PMC - PubMed
    1. Goryacheva O.A., Guhrenz C., Schneider K., Beloglazova N.V., Goryacheva I.Y., De Saeger S., Gaponik N. Silanized Luminescent Quantum Dots for the Simultaneous Multicolor Lateral Flow Immunoassay of Two Mycotoxins. ACS Appl. Mater. Interfaces. 2020;12:24575–24584. doi: 10.1021/acsami.0c05099. - DOI - PubMed

LinkOut - more resources