. 2022 Dec 15;23(24):15955.
doi: 10.3390/ijms232415955.

A Pan-Cancer Landscape of ABCG2 across Human Cancers: Friend or Foe?

Affiliations

A Pan-Cancer Landscape of ABCG2 across Human Cancers: Friend or Foe?

Chen Lyu et al. Int J Mol Sci. .

Abstract

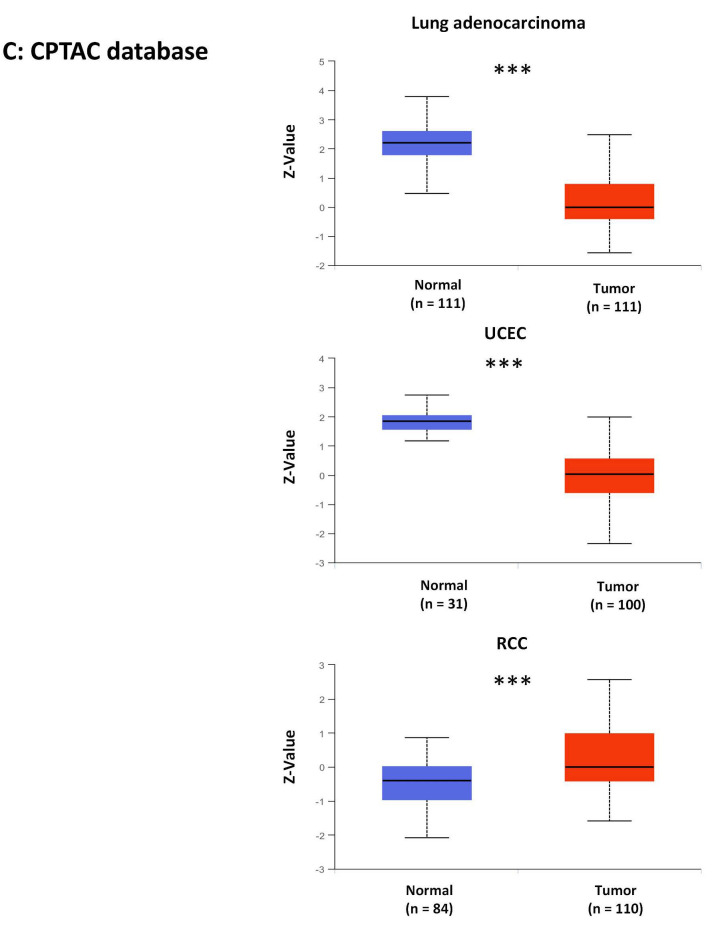
Emerging evidence from research or clinical studies reported that ABCG2 (ATP-binding cassette sub-family G member 2) interrelates with multidrug resistance (MDR) development in cancers. However, no comprehensive pan-cancer analysis is available at present. Therefore, we explore multiple databases, such as TCGA to investigate the potential therapeutic roles of ABCG2 across 33 different tumors. ABCG2 is expressed on a lower level in most cancers and shows a protective effect. For example, a lower expression level of ABCG2 was detrimental to the survival of adrenocortical carcinoma (TCGA-ACC), glioblastoma multiforme (GBM), and kidney renal clear cell carcinoma (KIRC) patients. Distinct associations exist between ABCG2 expression and stemness scores, microenvironmental scores, microsatellite instability (MSI), and tumor mutational burden (TMB) of tumor patients. We observed a significant positive correlation between the ABCG2 mutation site and prognosis in uterine corpus endometrial carcinoma (UCEC) patients. Moreover, transmembrane transporter activity and hormone biosynthetic-associated functions were found to be involved in the functionality of ABCG2 and its related genes. The cDNAs of cancer cell lines were collected to detect exon mutation sequences and to analyze ABCG2 mRNA expression. The mRNA expression level of ABCG2 showed a significant difference among spheres and drug-resistant cancer cell lines compared with their corresponding adherent cancer cell lines in six types of cancer. This pan-cancer study provides, for the first time, a comprehensive understanding of the multifunctionality of ABCG2 and unveils further details of the potential therapeutic role of ABCG2 in pan-cancer.

Keywords: ABCG2; cancer stem cell; genetic alteration; pan-cancer; prognosis.


Conflict of interest statement

The authors declare that the research was conducted in the absence of any commercial or financial relationships that could be construed as potential conflict of interest.

Figures

Figure 1
Figure 1
The ABCG2 expression data were obtained from various databases: (A) Data collected from TCGA database and analyzed by the TIMER2.0 database. Samples with gray backgrounds represent both tumor (red) and normal tissue (blue) samples and one metastasis (purple), which can be compared statistically. Samples with white backgrounds represent only tumor samples, which cannot be compared statistically because other types of tissue samples were not available (* p < 0.05; ** p < 0.01; *** p < 0.001). (B) We used normal tissue data from the Genotype-Tissue Expression (GTEx) database as controls for comparisons with the corresponding data from The Cancer Genome Atlas (TCGA) project. The results are presented as a box plot (* p < 0.05). Tumor samples in red and normal samples in black. (C) Expression levels of ABCG2 protein were also compared between tumor tissue (red) and normal tissue (blue) in LUAD (lung adenocarcinoma), UCEC (uterine corpus endometrial carcinoma), and RCC (clear cell renal cell carcinoma (RCC)) based on the CPTAC dataset (*** p < 0.001).
Figure 1
Figure 1
The ABCG2 expression data were obtained from various databases: (A) Data collected from TCGA database and analyzed by the TIMER2.0 database. Samples with gray backgrounds represent both tumor (red) and normal tissue (blue) samples and one metastasis (purple), which can be compared statistically. Samples with white backgrounds represent only tumor samples, which cannot be compared statistically because other types of tissue samples were not available (* p < 0.05; ** p < 0.01; *** p < 0.001). (B) We used normal tissue data from the Genotype-Tissue Expression (GTEx) database as controls for comparisons with the corresponding data from The Cancer Genome Atlas (TCGA) project. The results are presented as a box plot (* p < 0.05). Tumor samples in red and normal samples in black. (C) Expression levels of ABCG2 protein were also compared between tumor tissue (red) and normal tissue (blue) in LUAD (lung adenocarcinoma), UCEC (uterine corpus endometrial carcinoma), and RCC (clear cell renal cell carcinoma (RCC)) based on the CPTAC dataset (*** p < 0.001).
Figure 2
Figure 2
ABCG2 protein expression was shown in immunohistological sections of breast (T: HPA054719 antibody; N: HPA054719 antibody), lung (T: HPA054719 antibody; N: HPA054719 antibody), testis (T: HPA054719 antibody; N: HPA054719 antibody), and prostate (T: HPA054719 antibody; N: HPA054719 antibody), obtained from the Human Protein Atlas database.
Figure 3
Figure 3
Correlation between ABCG2 gene expression, overall survival, and disease-free survival for different cancer types: (A,B) The pan-cancer survival maps with significant results are given. For the Kaplan–Meier survival analysis, patients were grouped into high and low ABCG2 expression scores determined by the comparison with the median by log-rank test.
Figure 3
Figure 3
Correlation between ABCG2 gene expression, overall survival, and disease-free survival for different cancer types: (A,B) The pan-cancer survival maps with significant results are given. For the Kaplan–Meier survival analysis, patients were grouped into high and low ABCG2 expression scores determined by the comparison with the median by log-rank test.
Figure 4
Figure 4
Correlation between ABCG2 gene expression and the pathological stages of different cancer types. The pathological stages (stages I to IV) with significant results are shown.
Figure 5
Figure 5
Correlation between ABCG2 gene expression and the clinicopathological characteristics of different cancer types: (A) age (≤65 and >65) and (B) gender (female and male) with significant results are shown.
Figure 6
Figure 6
Correlation between ABCG2 gene expression, stemness scores, and microenvironmental scores based on the TCGA database: (A) Correlation of ABCG2 expression with the RNA and DNA stemness scores; (B) the ESTIMATE score map was analyzed and the StromalScore and the ImmuneScore for COAD, KIRC, LUSC, and UCEC with p < 0.001 are shown * p < 0.05, ** p < 0.01, *** p < 0.001. Blue box (downregulation), red box (upregulation).
Figure 7
Figure 7
Mutation features of ABCG2 in different tumors: (A,B) The mutation features of ABCG2 for the TCGA tumors were analyzed using the cBioPortal tool. The alterated mutation sites, the mutation site with the highest frequency (K653E/Y654Ifs*21/K653Nfs*11) (four cases for UCEC and one case for COAD), and the 3D structure of ABCG2 are displayed. (C) The radar charts illustrated the association between TMB or MSI and ABCG2 gene expression in different cancers. The red and blue curve represent the correlation coefficient, and the blue and green value represent the range. * p < 0.05, ** p < 0.01, *** p < 0.001.
Figure 8
Figure 8
The potential correlation between the mutation site and the survival patterns. The potential correlation between this mutation site and progression-free survival (PFS) (n = 528), overall survival (OS) (n = 1602), disease-specific survival (DSS) (n = 526), and disease-free survival (DFS) (n = 1346) of UCEC is shown.
Figure 9
Figure 9
Network of ABCG2-related genes and gene enrichment analysis: (A) Co-expression analysis between 47 immune-related genes and ABCG2 gene in the different pan-cancer cohorts of the TCGA database. Upper left corner represents the p-value, and the lower right corner represents the correlation coefficient (* p < 0.05; ** p < 0.01; *** p < 0.001). (B) The heatmap shows the expression correlation between ABCG2 and the top 20 ABCG2-related genes analyzed by the TIMER2 approach.
Figure 10
Figure 10
ABCG2-related genes enrichment analysis: (A) Protein–protein interaction (PPI) network for the top 20 ABCG2-related proteins based on the GeneMANIA online tool. Different colors of the network edges indicate the bioinformatic methods applied: physical interaction, co-expression, predicted, colocalization, pathway, genetic interaction, and shared protein domains. (B) ABCG2 gene and its top 20 related genes were associated to some biological process pathways in GO analysis using Cytoscape. Functionally correlated groups partially overlap and are arbitrarily colored. The node size represents the pathway enrichment significance.
Figure 11
Figure 11
GSEA analysis in six types of cancers. GO functional annotation of the ABCG2 gene in different cancers were displayed. Differently colored curves indicate that the ABCG2 gene regulates different functions or pathways in different cancers. Peaks of curves upward indicate positive regulation and peaks of curves downward represents negative regulation.
Figure 12
Figure 12
The detection of ABCG2 gene in cancer cells, cancer stem cells, and corresponding drug resistant cells: (A) Workflow of cell line preparation and exon sequencing of the ABCG2 gene; (B) RT-qPCR analysis representing relative mRNA expression levels of ABCG2 in various cancer cell lines and their corresponding sphere and drug-resistant cell lines. * p < 0.05, ** p < 0.01, *** p < 0.001, **** p < 0.0001.
Figure 12
Figure 12
The detection of ABCG2 gene in cancer cells, cancer stem cells, and corresponding drug resistant cells: (A) Workflow of cell line preparation and exon sequencing of the ABCG2 gene; (B) RT-qPCR analysis representing relative mRNA expression levels of ABCG2 in various cancer cell lines and their corresponding sphere and drug-resistant cell lines. * p < 0.05, ** p < 0.01, *** p < 0.001, **** p < 0.0001.

Similar articles

Cited by

References

    1. Fetsch P.A., Abati A., Litman T., Morisaki K., Honjo Y., Mittal K., Bates S.E. Localization of the ABCG2 mitoxantrone resistance-associated protein in normal tissues. Cancer Lett. 2006;235:84–92. doi: 10.1016/j.canlet.2005.04.024. - DOI - PubMed
    1. Noguchi K., Katayama K., Sugimoto Y. Human ABC transporter ABCG2/BCRP expression in chemoresistance: Basic and clinical perspectives for molecular cancer therapeutics. Pharm. Pers. Med. 2014;7:53. doi: 10.2147/PGPM.S38295. - DOI - PMC - PubMed
    1. de Gooijer M.C., de Vries N.A., Buckle T., Buil L.C., Beijnen J.H., Boogerd W., van Tellingen O.J.N. Improved brain penetration and antitumor efficacy of temozolomide by inhibition of ABCB1 and ABCG2. Neoplasia. 2018;20:710–720. doi: 10.1016/j.neo.2018.05.001. - DOI - PMC - PubMed
    1. Fletcher J.I., Williams R.T., Henderson M.J., Norris M.D., Haber M. ABC transporters as mediators of drug resistance and contributors to cancer cell biology. Drug Resist. Updates. 2016;26:1–9. doi: 10.1016/j.drup.2016.03.001. - DOI - PubMed
    1. Polgar O., Robey R.W., Bates S.E. ABCG2: Structure, function and role in drug response. Expert Opin. Drug Metab. Toxicol. 2008;4:1–15. doi: 10.1517/17425255.4.1.1. - DOI - PubMed

MeSH terms

Substances