. 2022 Dec 15;23(24):15995.
doi: 10.3390/ijms232415995.

High-Resolution Small RNAs Landscape Provides Insights into Alkane Adaptation in the Marine Alkane-Degrader Alcanivorax dieselolei B-5

Affiliations

High-Resolution Small RNAs Landscape Provides Insights into Alkane Adaptation in the Marine Alkane-Degrader Alcanivorax dieselolei B-5

Guangshan Wei et al. Int J Mol Sci. .

Abstract

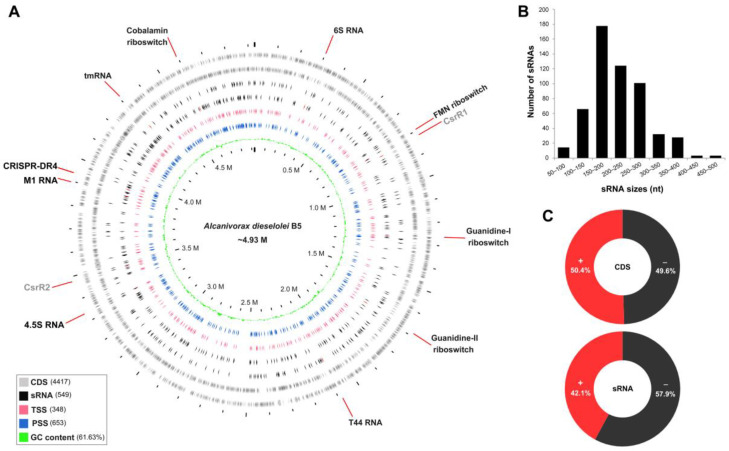
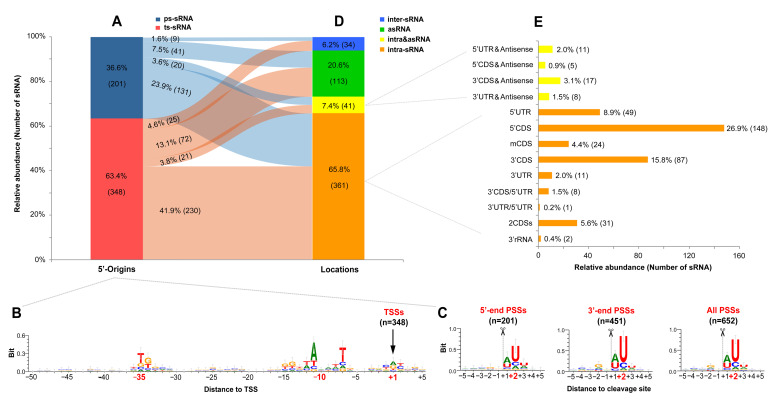
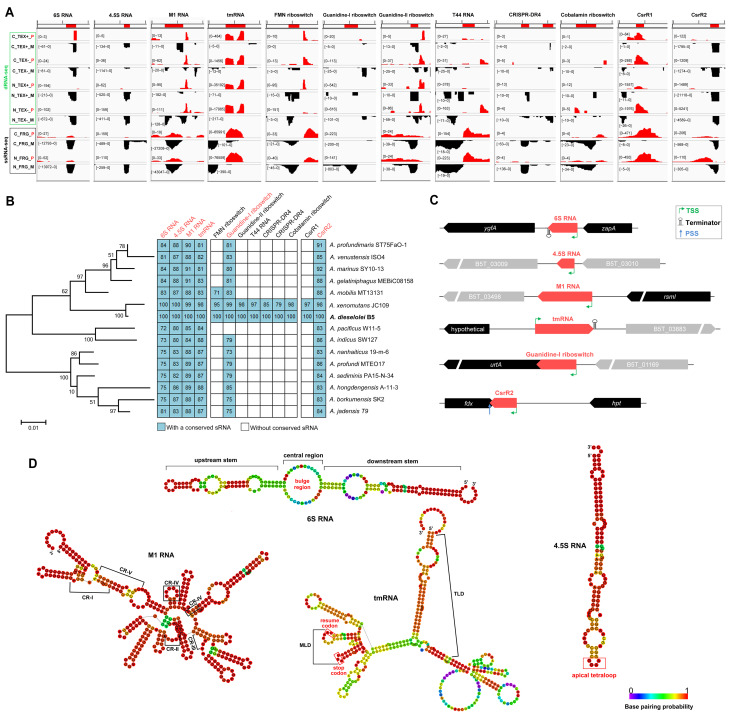
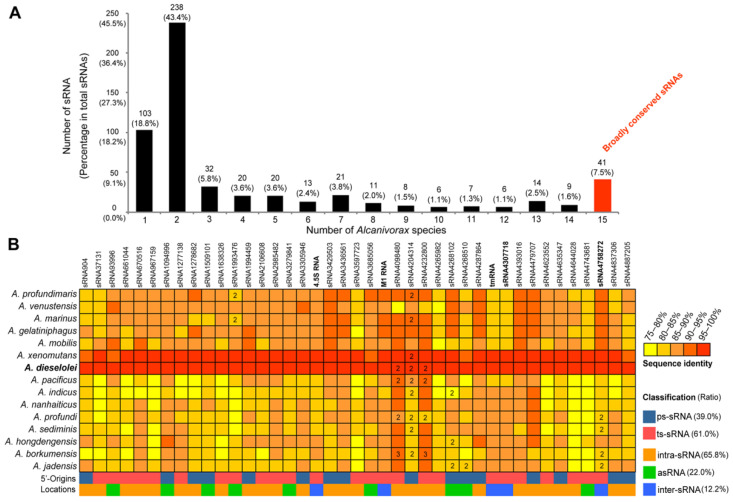
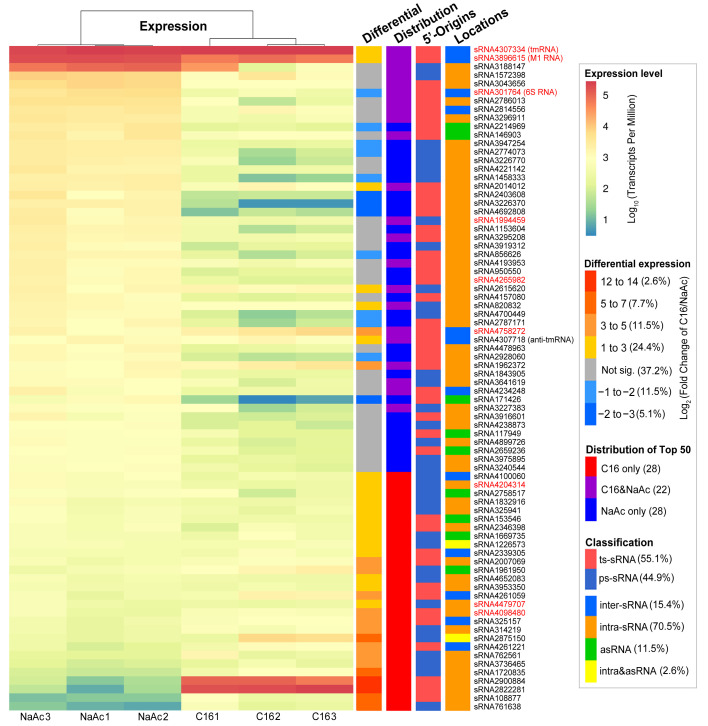
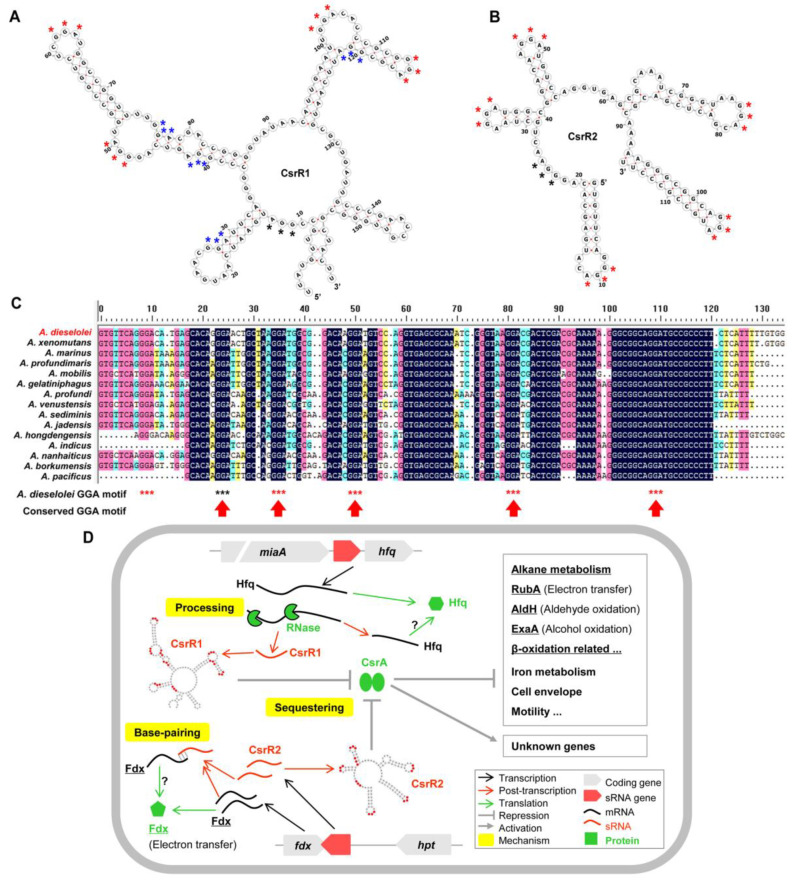
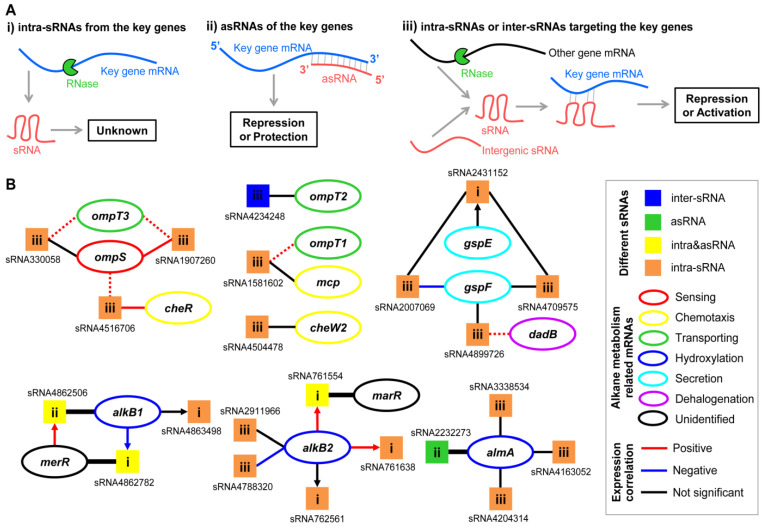
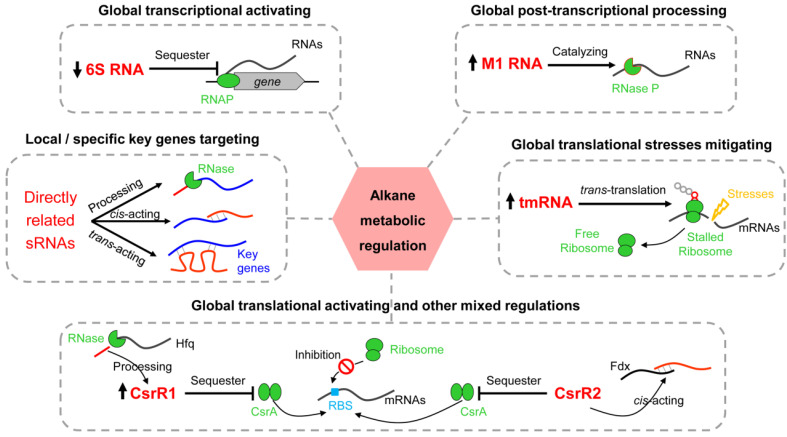
Alkanes are widespread in the ocean, and Alcanivorax is one of the most ubiquitous alkane-degrading bacteria in the marine ecosystem. Small RNAs (sRNAs) are usually at the heart of regulatory pathways, but sRNA-mediated alkane metabolic adaptability still remains largely unknown due to the difficulties of identification. Here, differential RNA sequencing (dRNA-seq) modified with a size selection (~50-nt to 500-nt) strategy was used to generate high-resolution sRNAs profiling in the model species Alcanivorax dieselolei B-5 under alkane (n-hexadecane) and non-alkane (acetate) conditions. As a result, we identified 549 sRNA candidates at single-nucleotide resolution of 5'-ends, 63.4% of which are with transcription start sites (TSSs), and 36.6% of which are with processing sites (PSSs) at the 5'-ends. These sRNAs originate from almost any location in the genome, regardless of intragenic (65.8%), antisense (20.6%) and intergenic (6.2%) regions, and RNase E may function in the maturation of sRNAs. Most sRNAs locally distribute across the 15 reference genomes of Alcanivorax, and only 7.5% of sRNAs are broadly conserved in this genus. Expression responses to the alkane of several core conserved sRNAs, including 6S RNA, M1 RNA and tmRNA, indicate that they may participate in alkane metabolisms and result in more actively global transcription, RNA processing and stresses mitigation. Two novel CsrA-related sRNAs are identified, which may be involved in the translational activation of alkane metabolism-related genes by sequestering the global repressor CsrA. The relationships of sRNAs with the characterized genes of alkane sensing (ompS), chemotaxis (mcp, cheR, cheW2), transporting (ompT1, ompT2, ompT3) and hydroxylation (alkB1, alkB2, almA) were created based on the genome-wide predicted sRNA-mRNA interactions. Overall, the sRNA landscape lays the ground for uncovering cryptic regulations in critical marine bacterium, among which both the core and species-specific sRNAs are implicated in the alkane adaptive metabolisms.

Keywords: Alcanivorax; PSS; TSS; alkane; dRNA-seq; metabolic regulation; sRNA.


Conflict of interest statement

The authors declare no conflict of interest.

Figures

Figure 1
Figure 1
Genome-wide sRNAs landscape of A. dieselolei B-5. (A) Diagram shows the distributions of sRNAs, TSSs and PSSs across the B-5 whole genome. From outside to inside, the rings represent the distributions of CDSs, sRNAs, TSSs, PSSs and the GC content, respectively, and the values in brackets show corresponding numbers or percentages in the genome. The orientations of each ring are clockwise for the plus (+) strand and counterclockwise for the minus (−) strand. The relatively conserved sRNAs are red marked on the corresponding rings, and their annotated names are displayed on the outermost edges of the plot; black fonts for Rfam families and grey for identified CsrA-related sRNAs. Circos plot was created by using Proksee (https://proksee.ca/, accessed on 23 March 2022). (B) The size distribution of sRNAs. (C) Comparison of the distributing proportions of CDSs and sRNAs in two strands (+/−) of the genome.
Figure 2
Figure 2
Origin and location patterns of sRNAs. (A) Distribution of sRNAs classified by the origins of 5′-ends. (B,C) show the sequence logos of neighboring regions of TSSs and PSSs, respectively. The “−” and “+” before the numbers represent the upstream and downstream positions, respectively, and the featured positions are shown with bold and red fonts. (D,E) show the distributions of sRNAs classified by their locations relative to the genomic annotations. The percentage represents the ratio of one type of sRNA in the total, and the following number in the bracket shows the corresponding amount. The relationships between (A) and (D) are connected by a Sankey diagram created by using the SankeyMATIC (https://sankeymatic.com/build/, accessed on 28 February 2022).
Figure 3
Figure 3
Sequence and structure features of sRNAs with different classifications. (A) Boxplot shows the length distributions of different types of sRNAs. The grey stripes in the background shows the overall length distributions. (B) GC contents and (C) NMFEs of classified sRNAs, CDSs, rRNAs and tRNAs.
Figure 4
Figure 4
Rfam-annotated sRNAs of A. dieselolei and their distributions in genus Alcanivorax. (A) IGV views on the read coverages of Rfam-annotated sRNAs. Tracks display the different experimental conditions (i.e., C for C16 (hexadecane) and N for NaAc (sodium acetate) carbon sources) and RNA-seq strategies (i.e., TEX+ and TEX- for dRNA-seq and FRG for ssRNA-seq). The reads mapped on the plus (P) and minus (M) strands of the genome are in red and black colours, respectively. (B) The homologs of Rfam-annotated sRNAs in Alcanivorax. The left part shows the 16S rRNA gene-based maximum-likelihood phylogenic tree of representative Alcanivorax species constructed using MEGA6 (www.megasoftware.net, accessed on 19 May 2022), the bootstrap values that are more than 50 are presented on the related branches. The middle part shows the distributions and identities (%) of sRNAs in different species, and the names of broadly conserved sRNAs are in red. The right part shows the names of corresponding species. (C) Neighboring gene synteny of highly conserved sRNAs. The red arrows in the middle represent the sRNAs, black for the highly conserved nearby genes and grey for the less conserved genes. The arrow direction to the left indicates genes on the minus-strand and to the right for the plus-strand. The details of the nearby genes are listed in Table S12. (D) Secondary structures and conserved features of the core sRNAs.
Figure 5
Figure 5
Distribution of sRNA homologs across different species of Alcanivorax. (A) The number (percentage) distribution of sRNA homologs across one (A. dieselolei-specific) to all 15 (broadly conserved) species of Alcanivorax. The bar with broadly conserved sRNAs is marked in red. (B) The sequence identity distribution of the 41 conserved sRNAs across different Alcanivorax species and their classifications in the reference strain B-5. The different sequence identities are shown using color gradients from yellow to red. The number (2 or 3) in the grid represents the copy number of the related sRNA in corresponding species, and the average identity of multiple copies is shown. The classifications of sRNAs are also displayed by distinct colors.
Figure 6
Figure 6
Expression of the top 50 sRNAs in alkane and non-alkane conditions. From left to right, the heatmap and colored bar charts show the expression levels in each sample of NaAc (non-alkane) or C16 (alkane) as carbon source, the differential expression of alkane vs. non-alkane conditions, the distribution of the top 50 highly expressed sRNAs in the two conditions and the classifications based on sRNA origins and locations. The sRNA names are listed behind, and the broadly conserved ones are in red.
Figure 7
Figure 7
CsrA-related sRNAs and proposed regulation mechanisms in A. dieselolei. (A,B) show the secondary structures of the CsrR1 and CsrR2 conserved regions, respectively. (C) The alignments of CsrR2 homologous sequences in different species of Alcanivorax. The potential GGA motifs are marked using asterisks with different colors, red for motifs in loops, black for motifs in single-strand regions and blue for motifs at the junctions of the stem-loop. Secondary structures were calculated using RNAfold, and sequences were aligned with DNAMAN (version 8.0). (D) The proposed regulation mechanisms of the two CsrA-related sRNAs in alkane metabolism. The detailed notes are on the bottom right corner. Abbreviations: miaA, tRNA dimethylallyltransferase (B5T_00773); hfq/Hfq, Host factor (B5T_00774); RubA, Rubredoxin-NAD(+) reductase (B5T_04349); AldH, Aldehyde dehydrogenase (B5T_00039); ExaA, PQQ-dependent dehydrogenase (B5T_01640); fdx/Fdx, Ferredoxin (B5T_03135); hpt, Hpt domain-containing protein (B5T_03136). The mRNA/protein related to alkane metabolism is underlined. The question mark represents unknown effects.
Figure 8
Figure 8
Putative relationships between the key genes in alkane metabolism and directly related sRNAs. (A) The three criteria to determine the directly related sRNAs with key genes of alkane metabolism. (B) Putative relationships between sRNAs and key genes. Each square represents a unique sRNA, and the sRNA identifiers are shown near the corresponding squares; the squares are colored according to the sRNA location-based classification. The ‘i, ii, iii’ in the squares correspond to the three criteria above. The ovals denote the mRNAs of key genes and are colored according to functions in alkane metabolism, and the related gene names are shown inside. The lines without an arrow show the matching relationships between sRNA and their targets, and the lines with arrows represent the sRNAs derived from the parental mRNAs. The cis-acting relationships (showing with wider lines) were deduced in terms of direct base-pairing for the asRNA and intra&asRNA, and the trans-acting relationships (showing with narrow lines) were inferred by IntaRNA prediction. The key genes in the top 10 most likely targets are shown with solid lines, and dotted lines show the potential targets beyond that range (top 20 to 100). The colors of lines or arrows indicate the correlationships of both of the connected ends based on Spearman correlation analyses of ssRNA-seq expression values in two carbon sources (n = 6).
Figure 9
Figure 9
Hypothesized sRNA-mediated alkane metabolic regulations in A. dieselolei B-5. The key related sRNAs (red and largest font) and their potential regulating mechanisms are shown in each dotted box. The significant expression changed sRNAs responding to the alkane, which are marked with up and down arrows before them, representing up- and down-regulated expressions, respectively. The possible regulating effects of the sRNAs are indicated above each dotted box (black and bold font). Abbreviations: RNAP, RNA polymerase; Hfq, Host factor; Fdx, Ferredoxin; RBS, ribosome binding site.

Similar articles

References

    1. Lea-Smith D.J., Biller S.J., Davey M.P., Cotton C.A., Perez Sepulveda B.M., Turchyn A.V., Scanlan D.J., Smith A.G., Chisholm S.W., Howe C.J. Contribution of cyanobacterial alkane production to the ocean hydrocarbon cycle. Proc. Natl. Acad. Sci. USA. 2015;112:13591–13596. doi: 10.1073/pnas.1507274112. - DOI - PMC - PubMed
    1. He D., Wang X., Yang Y., He R., Zhong H., Wang Y., Han B., Jin F. Hydrothermal synthesis of long-chain hydrocarbons up to C24 with NaHCO3-assisted stabilizing cobalt. Proc. Natl. Acad. Sci. USA. 2021;118:e2115059118. doi: 10.1073/pnas.2115059118. - DOI - PMC - PubMed
    1. Scoma A., Yakimov M.M., Daffonchio D., Boon N. Self-healing capacity of deep-sea ecosystems affected by petroleum hydrocarbons: Understanding microbial oil degradation at hydrocarbon seeps is key to sustainable bioremediation protocols. EMBO Rep. 2017;18:868–872. doi: 10.15252/embr.201744090. - DOI - PMC - PubMed
    1. Yakimov M.M., Bargiela R., Golyshin P.N. Calm and Frenzy: Marine obligate hydrocarbonoclastic bacteria sustain ocean wellness. Curr. Opin. Biotechnol. 2022;73:337–345. doi: 10.1016/j.copbio.2021.09.015. - DOI - PubMed
    1. Gregson B.H., Metodieva G., Metodiev M.V., McKew B.A. Differential protein expression during growth on linear versus branched alkanes in the obligate marine hydrocarbon-degrading bacterium Alcanivorax borkumensis SK2T. Environ. Microbiol. 2019;21:2347–2359. doi: 10.1111/1462-2920.14620. - DOI - PMC - PubMed

MeSH terms

Supplementary concepts