. 2022 Dec 17;23(24):16092.
doi: 10.3390/ijms232416092.

PLEKHM2 Loss of Function Impairs the Activity of iPSC-Derived Neurons via Regulation of Autophagic Flux

Affiliations

PLEKHM2 Loss of Function Impairs the Activity of iPSC-Derived Neurons via Regulation of Autophagic Flux

Hadas Ben-Zvi et al. Int J Mol Sci. .

Abstract

Pleckstrin Homology And RUN Domain Containing M2 (PLEKHM2) [delAG] mutation causes dilated cardiomyopathy with left ventricular non-compaction (DCM-LVNC), resulting in a premature death of PLEKHM2[delAG] individuals due to heart failure. PLEKHM2 is a factor involved in autophagy, a master regulator of cellular homeostasis, decomposing pathogens, proteins and other cellular components. Autophagy is mainly carried out by the lysosome, containing degradation enzymes, and by the autophagosome, which engulfs substances marked for decomposition. PLEKHM2 promotes lysosomal movement toward the cell periphery. Autophagic dysregulation is associated with neurodegenerative diseases' pathogenesis. Thus, modulation of autophagy holds considerable potential as a therapeutic target for such disorders. We hypothesized that PLEKHM2 is involved in neuronal development and function, and that mutated PLEKHM2 (PLEKHM2[delAG]) neurons will present impaired functions. Here, we studied PLEKHM2-related abnormalities in induced pluripotent stem cell (iPSC)-derived motor neurons (iMNs) as a neuronal model. PLEKHM2[delAG] iMN cultures had healthy control-like differentiation potential but exhibited reduced autophagic activity. Electrophysiological measurements revealed that PLEKHM2[delAG] iMN cultures displayed delayed functional maturation and more frequent and unsynchronized activity. This was associated with increased size and a more perinuclear lysosome cellular distribution. Thus, our results suggest that PLEKHM2 is involved in the functional development of neurons through the regulation of autophagic flux.

Keywords: DCM-LVNC; PLEKHM2; autophagosomes; autophagy; disease model; iPSCs; lysosomes; motor neurons; neurodegeneration; neurons.


Conflict of interest statement

The authors declare no conflict of interest. The funders had no role in the design of the study; in the collection, analyses, or interpretation of data; in the writing of the manuscript; or in the decision to publish the results.

Figures

Figure 1
Figure 1
PLEKHM2 protein structure in healthy individuals (top panel) and the two possible variants that are truncated as a result of AG nucleotide deletion in DCM-LVNC patients (bottom panel).
Figure 2
Figure 2
PLEKHM2 is not involved in neural differentiation potential. (A) Differentiation protocol layout, D6 neuroepithelium (NEP), D12 motor neuron progenitor cells (MNPCs), D18 immature motor neurons (iMNs) and from D30 on motor neurons (MNs). (BD) Protein expression by flow cytometry analysis. Organized by row accordingly: the pluripotency marker OCT3/4 (B), the neural progenitor cell markers SOX1 (C) and NESTIN (D). One-way ANOVA with Sidak’s multiple-comparisons test was used. Data presented as mean ± SEM n = 2–6. (E,F) ICC of MNPCs (E) and iMNs (F) for ISL1, TUJ1α (i) SOX1 and MAP2ab (ii). Scale bars—100 µm. Blue—DAPI, red—ISL1, SOX1 and green—TUJ1α, MAP2ab. (G) Specific neuronal markers in iMN cultures—MAP2ab, TUJ1α and ISL1. One-way ANOVA with Sidak’s multiple-comparisons test was used. Data presented as mean ± SEM n = 2–6.
Figure 3
Figure 3
Reduced autophagic activity trend in PLEKHM2[delAG] cultures. (AD), Autophagy flux acquired by flow cytometry analysis during four stages of differentiation using the CYTO-ID autophagy detection kit. iPSCs (A), NEP (B), MNPCs (C), and iMNs (D). Stress induction by rapamycin and chloroquine (R + CQ) treatment, unless stated otherwise. Black and empty bars represent control and PLEKHM2[delAG] cultures, respectively. Fold change calculated by median fluorescent intensity after treatment normalized to untreated samples. The dashed red line marks the 2-fold change. Two-tailed student’s t-test was employed, presenting mean ± SEM n > 3. (E) Western blot analysis of D6 culture autophagosome markers p62 and LC3B under two stress inductions, R + CQ and nutrient limited media with chloroquine (NLM + CQ). * p = 0.0155 by two-tailed student’s t-test. Bar graphs present mean ± SEM n = 5 (including 2–3 technical repetitions in at least two independent experiments for each line) (F) Representative Western blots. Autophagosomal markers, p62 and LC3B and housekeeping gene, GAPDH.
Figure 4
Figure 4
Microelectrode array (MEA) functional assay of the cultures. (A) Number of spikes fired during a 15 min recording. Based on at least four separate independent experiments (BGUi008A—2, BGUi008B—2, BGUi009—2 and BGUi010—3) * p = 0.025 by one-way ANOVA with Sidak’s multiple-comparisons test. (B) Mean firing rate * p = 0.0171 by two-tailed student’s t-test. Presenting mean ± SEM. (C) Representative raster plots during the most active week in the culture. (D) Median inter-spike interval (ISI) within bursts * p = 0.0214 by two-tailed student’s t-test. (E) Burst percentage average * p = 0.0345 by two-tailed student’s t-test. All graphs presenting mean ± SEM. (F) Synchrony index during weeks 3 and 5 * p = 0.0130, **** p < 0.0001, respectively, by two-tailed student’s t-test, showing mean ± SEM. Week 3: ncontrol = 7, nPLEKHM2[delAG] = 3. Week 5: ncontrol = 2, nPLEKHM2[delAG] = 7. (G) Protein expression of day 35 neural culture. Two-tailed student’s t-test, showing mean ± SEM, n = 2.
Figure 5
Figure 5
Lysosomal distribution. (A) Number of lysosomes within each cell. The interquartile range (IQR) is denoted by the black rectangle, white dots denote the median value * p = 0.0206 by one-way ANOVA Sidak’s multiple-comparisons test. (B) Lysosome size distribution in baseline and following stress induction. *** p < 0.007, **** p < 0.0001 by one-way ANOVA with Kruskal–Wallis multiple-comparisons test. (C) The distance of lysosomes from the nucleus is measured. * p = 0.0213, **** p < 0.0001 by one-way ANOVA with Kruskal–Wallis multiple-comparisons test. (D) Representative images of cells during basal conditions and following R + CQ treatment. White arrows point to lysosomes far from the nucleus in control cultures or perinuclear in PLEKHM2[delAG] cultures. n = 11–14 cells from two independent experiments. Scale bar—10 µm. Blue—DAPI, green—TUJ1α, red—LAMP1.
Figure 6
Figure 6
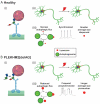
Suggested mechanism: large perinuclear lysosomes lead to abnormal electrophysiological activity in (A) healthy and (B) PLEKHM2[delAG] cells. (i) Lysosome binds to KINESIN-1 motor protein through PLEKHM2. Healthy control translation of the protein allows for the desired regulation of anterograde motion, while PLEKHM2[delAG] transcripts are translated into two shorter variants. The first skips exon 11 but all three domains are translated. Translation of the latter halts at the mutation site (AG deletion). The shorter variants probably interfere with the required anterograde motion. (ii) Lysosomal biodistribution under basal conditions and after stress induction. Translation of PLEKHM2 protein results in lysosomes spreading throughout the cell, while most remain in the soma. Applied stress signals the lysosomes to move anterogradely to the neurites in control cultures, whereas PLEKHM2[delAG] protein variants allow for a transient interaction between KINESIN-1 and the lysosome, and consequentially, a more perinuclear localization persists. Bigger lysosomes indicate either autolysosomal conformation or inactive alkalinized lysosomes. Stress induction allows a modest spreading of the lysosomes, without enlargement of the organelles. (iii) A summary of the differences recorded between the cultures. Control cultures presented a smaller average size of lysosomes which were synchronized and, after stress induction, had stimulated autophagic flux. mPLEHM2 cultures had larger lysosomes which clustered by the nucleus under basal conditions and stress induction. These cultures were unsynchronized and fired frequently. The autophagic flux registered was lower than control cultures. Figure partially created with BioRender (https://biorender.com/, accessed on 13 December 2022).

References

    1. Deter R.L., Baudhuin P., De Duve C. Participation of Lysosomes in Cellular Autophagy Induced in Rat Liver by Glucagon. J. Cell Biol. 1967;35:C11–C16. doi: 10.1083/jcb.35.2.C11. - DOI - PMC - PubMed
    1. Klionsky D.J. Autophagy: From Phenomenology to Molecular Understanding in Less Than. Nat. Rev. Mol. Cell Biol. 2007;8:931–937. doi: 10.1038/nrm2245. - DOI - PubMed
    1. Bento C.F., Puri C., Moreau K., Rubinsztein D.C. The Role of Membrane-Trafficking Small GTPases in the Regulation of Autophagy. J. Cell Sci. 2013;126:1059–1069. doi: 10.1242/jcs.123075. - DOI - PubMed
    1. Nakatogawa H., Suzuki K., Kamada Y., Ohsumi Y. Dynamics and Diversity in Autophagy Mechanisms: Lessons from Yeast. Nat. Rev. Mol. Cell Biol. 2009;10:458–467. doi: 10.1038/nrm2708. - DOI - PubMed
    1. Muhammad E., Levitas A., Singh S.R., Braiman A., Ofir R., Etzion S., Sheffield V.C., Etzion Y., Carrier L., Parvari R. PLEKHM2 Mutation Leads to Abnormal Localization of Lysosomes, Impaired Autophagy Flux and Associates with Recessive Dilated Cardiomyopathy and Left Ventricular Noncompaction. Hum. Mol. Genet. 2015;24:7227–7240. doi: 10.1093/hmg/ddv423. - DOI - PMC - PubMed

LinkOut - more resources