. 2022 Dec 17;23(24):16099.
doi: 10.3390/ijms232416099.

Photobiomodulation Attenuated Cognitive Dysfunction and Neuroinflammation in a Prenatal Valproic Acid-Induced Autism Spectrum Disorder Mouse Model

Affiliations

Photobiomodulation Attenuated Cognitive Dysfunction and Neuroinflammation in a Prenatal Valproic Acid-Induced Autism Spectrum Disorder Mouse Model

Ui-Jin Kim et al. Int J Mol Sci. .

Abstract

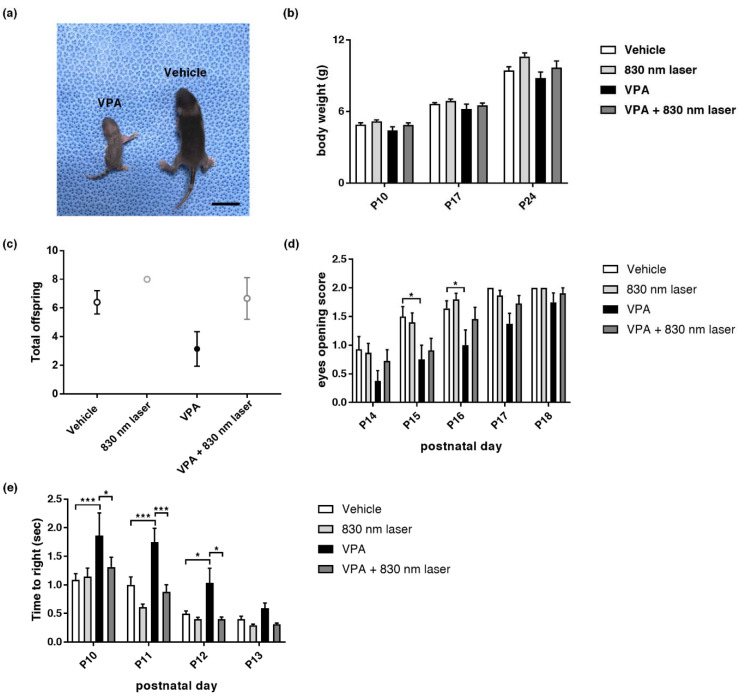
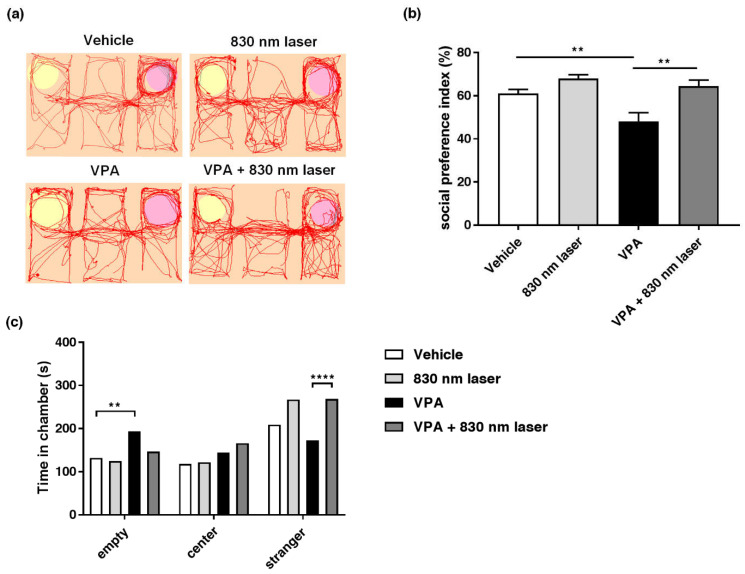
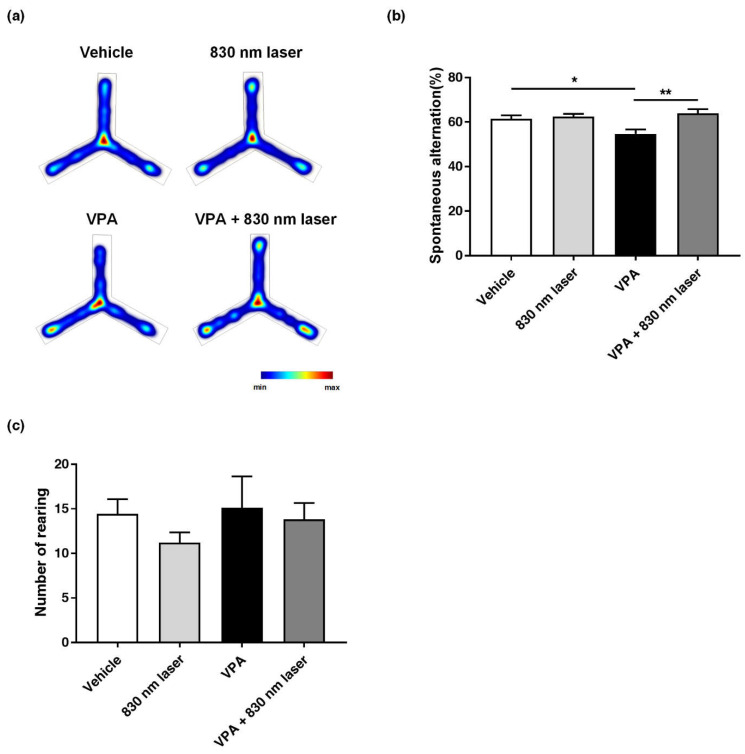
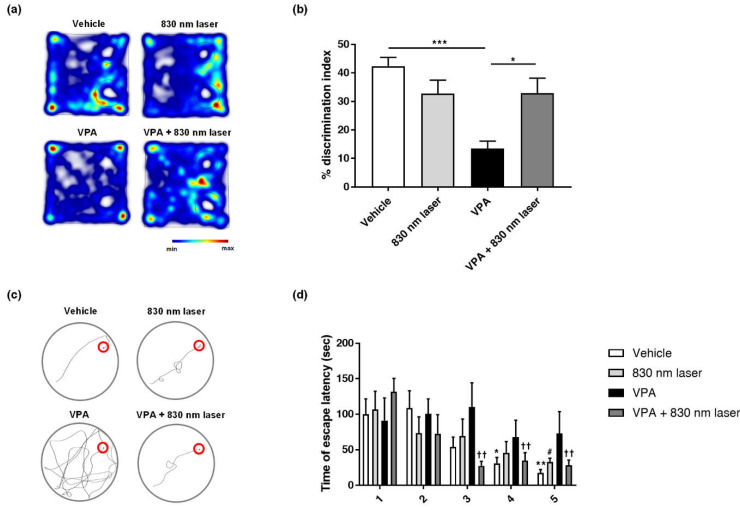
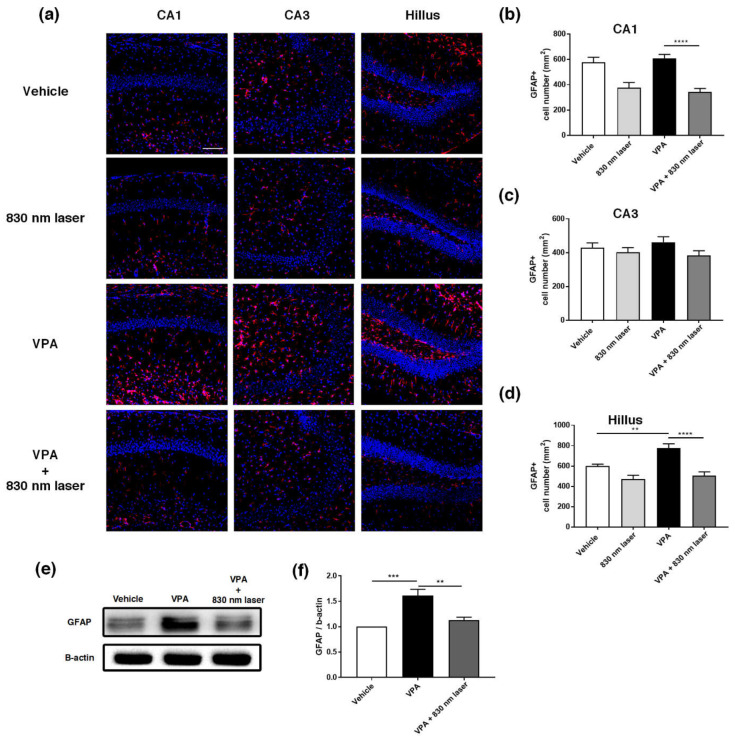
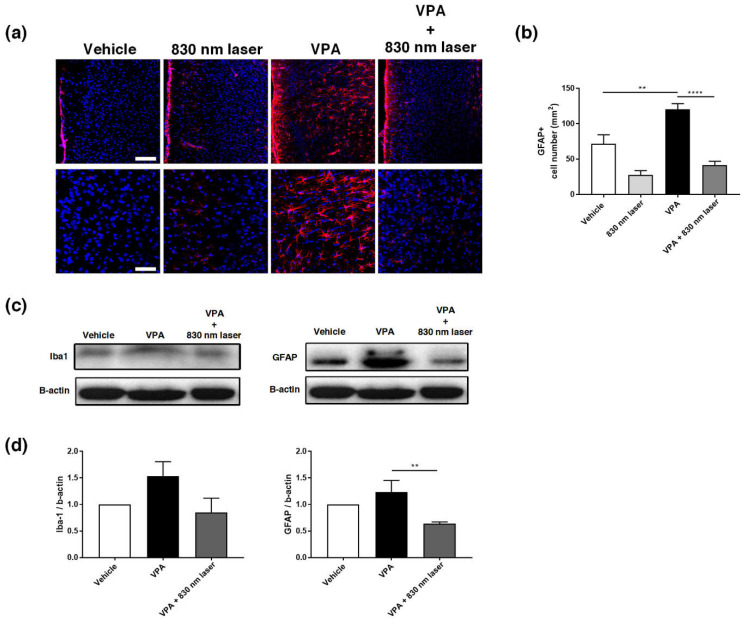
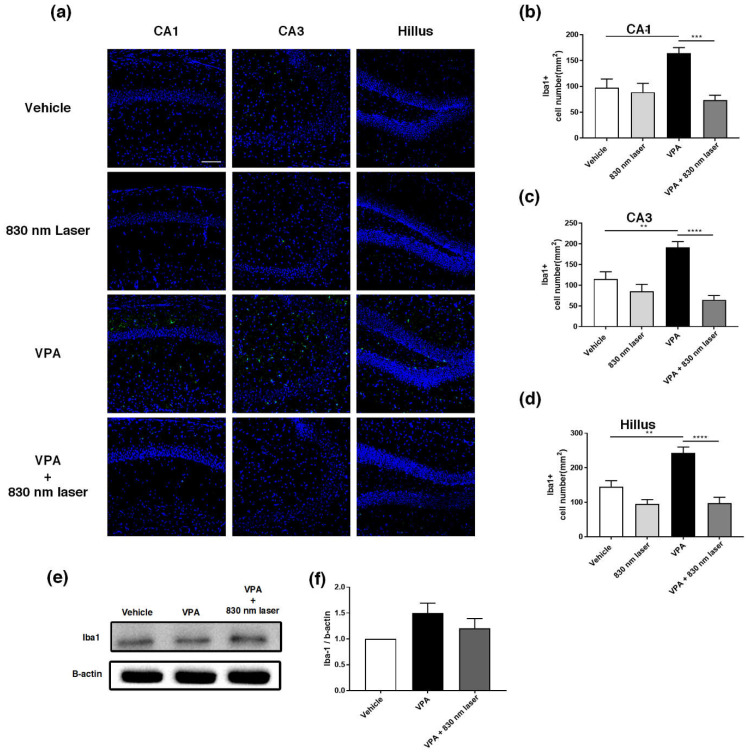
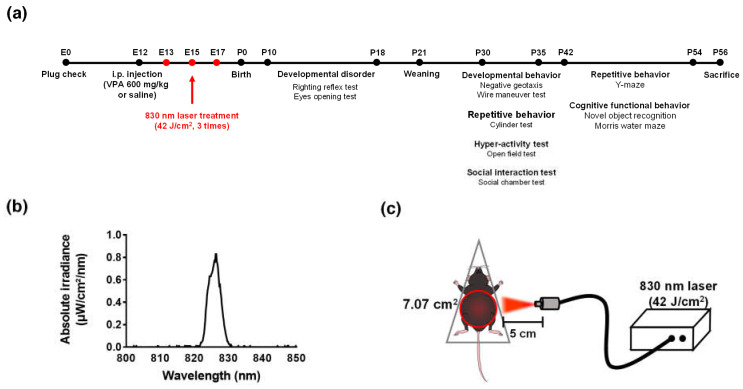
Autism spectrum disorder (ASD) is a neurodevelopmental condition characterized by social communication and interaction disorders, as well as repetitive and restrictive behaviors. To date, no effective treatment strategies have been identified. However, photobiomodulation (PBM) is emerging as a promising treatment for neurological and neuropsychiatric disorders. We used mice exposed to valproic acid (VPA) as a model of ASD and found that pathological behavioral and histological changes that may have been induced by VPA were attenuated by PBM treatment. Pregnant mice that had been exposed to VPA were treated with PBM three times. Thereafter, we evaluated the offspring for developmental disorders, motor function, hyperactivity, repetitive behaviors, and cognitive impairment. PBM attenuated many of the pathological behaviors observed in the VPA-induced ASD mouse model. In addition, pathophysiological analyses confirmed that the increase in activated microglia and astrocytes observed in the VPA-induced ASD mouse model was attenuated by PBM treatment. This suggests that PBM can counteract the behavioral changes caused by neuroinflammation in ASD. Therefore, our data show that PBM has therapeutic potential and may reduce the prevalence of neurodevelopmental disorders such as ASD.

Keywords: autism spectrum disorder; cognitive function; neuroinflammation; photobiomodulation; valproic acid.


Conflict of interest statement

The authors declare that they have no known competing financial interests or personal relationships that could have appeared to influence the work reported in this paper.

Figures

Figure 1
Figure 1
Mice exposed to valproic acid (VPA) in utero exhibited delayed development. (a) A pup exposed to VPA was compared to one exposed to the vehicle (postnatal day 9). Scale bar: 1 cm. (b) Body weight of mice exposed to VPA (in utero). (c) The number of live pups from each pregnancy on postnatal day 10. (d) Developmental delays were assessed based on the eye-opening test and (e) righting reflex. Eye opening was scored from postnatal days 14 to 18 (score: 0 = closed eyes, 1 = one eye open, 2 = both eyes open). The righting reflex was measured every day from P10 to 13. Data are means ± standard error of the mean (SEM) (vehicle: n = 14,830 nm laser: n = 15, VPA: n = 8, VPA + 830 nm laser: n = 11). * p < 0.05 and *** p < 0.001 compared to the vehicle group. * p < 0.05 and *** p < 0.001 compared to the VPA group.
Figure 2
Figure 2
Effect of laser treatment on the motor function of mice exposed to VPA in utero. (a) The effect of 830 nm laser treatment on mice exposed to VPA (in utero) was assessed using the negative geotaxis test and (b) hanging wire test. Mice were placed on the slope with their heads facing downward. The righting reflex was measured as the time taken for mice to reach the top of the slope. In the hanging wire test, the time elapsed between the holding of the wire with both forelimbs and climbing with the hind limbs was measured. Data are means ± SEM (vehicle: n = 14,830 nm laser: n = 15, VPA: n = 8, VPA + 830 nm laser: n = 11). ** p < 0.01 compared to the group exposed to VPA.
Figure 3
Figure 3
Effect of laser treatment on the social interactions of mice exposed to VPA in utero. (a) The effect of 830 nm laser treatment on mice exposed to VPA (in utero) was assessed using the three-chamber test. (b) Social preference index (%) = time spent in the stranger chamber divided by the total time spent in all chambers. (c) The bar graph indicates that mice spent time in each room, empty, center, and room with a stranger. Data are means ± SEM (vehicle: n = 9, 830 nm laser: n = 9, VPA: n = 6, VPA + 830 nm laser: n = 7). ** p < 0.01 compared to the vehicle group. **** p < 0.0001 compared to the group exposed to VPA.
Figure 4
Figure 4
Effect of laser treatment on the repetitive behavior of mice exposed to VPA in utero. The effect of 830 nm laser treatment on mice exposed to VPA (in utero) was assessed using (a,b) the Y-maze and (c) the cylinder rearing test. Spontaneous alternation (%) = total alternations/(total arm entries—2) × 100. Data are means ± SEM (vehicle: n = 14,830 nm laser: n = 15, VPA: n = 8, VPA + 830 nm laser: n = 11). * p < 0.05 compared to the vehicle group. * p < 0.05 and ** p < 0.01 compared to the group exposed to VPA.
Figure 5
Figure 5
Effect of laser treatment on the hyperactivity of mice exposed to VPA in utero. The effect of 830 nm laser treatment on mice exposed to VPA (in utero) was assessed using (ad) the open field test. Data are means ± SEM (vehicle: n = 14,830 nm laser: n = 15, VPA: n = 8, VPA + 830 nm laser: n = 11). * p < 0.05 compared to the vehicle group. * p < 0.05 compared to the group exposed to VPA.
Figure 6
Figure 6
Effect of laser treatment on the cognitive function of mice exposed to VPA in utero. The effect of 830 nm laser treatment on cognitive dysfunction in mice exposed to VPA (in utero) was assessed using (a,b) the novel object recognition test and (c,d) Morris water maze. Discrimination index (%) = time spent on the novel object divided by the total time spent exploring both objects. (b) The data show significant differences compared to the group exposed to VPA (vehicle: n = 9, 830 nm laser: n = 9, VPA: n = 6, VPA + 830 nm laser: n = 7). *** p < 0.001 compared to the vehicle group. * p < 0.05 compared to the VPA+ 830 nm laser group. (d) The data show significant differences compared to the group exposed to VPA (vehicle: n = 9, 830 nm laser: n = 9, VPA: n = 6, VPA + 830 nm laser: n = 7). * p < 0.05 and ** p < 0.01 compared to the vehicle on day 1. # p < 0.05 compared to the 830 nm laser group on day 1. †† p < 0.01 compared to the VPA + 830 nm laser group on day 1.
Figure 7
Figure 7
Immunohistochemistry and Western blotting analyses of glial fibrillary acidic protein (GFAP) expression in the hippocampus. (a) Image showing GFAP-positive cells (red) in the CA1, CA3, and hilus regions of the hippocampus. (bd) Quantification of GFAP-positive cells in the CA1, CA3, and hilus regions of the hippocampus. (e) Image of a Western blot. Full-length blots/gels are presented in Figure S1. (f) Average relative intensity values for the Western blots. The bar graph summarizes changes in the GFAP-positive cells. Nuclei were stained using 4′,6-diamidino-2-phenylindole (DAPI). Scale bar: 100 µm. Data are means ± SEM. (vehicle: n = 3, 830 nm laser: n = 3, VPA: n = 3, VPA + 830 nm laser: n = 3). ** p < 0.01 compared to the vehicle group. *** p < 0.001 and **** p < 0.0001 compared to the group exposed to VPA.
Figure 8
Figure 8
Immunohistochemistry and Western blotting analyses of GFAP expression in the medial prefrontal cortex (mPFC). (a) Image showing GFAP-positive cells (red) in the mPFC. (b) Quantification of GFAP-positive cells in the mPFC. (c) Image of a Western blot. Full-length blots/gels are presented in Figure S2. (d) Average relative intensity values for the Western blots. The bar graph summarizes changes in the GFAP-positive cells. Scale bars: 100 and 50 µm. Data are means ± SEM (vehicle: n = 3, 830 nm laser: n = 3, VPA: n = 3, VPA + 830 nm laser: n = 3). ** p < 0.01 compared to the vehicle group. **** p < 0.0001 compared to the group exposed to VPA.
Figure 9
Figure 9
Immunohistochemistry and Western blotting analyses of ionized calcium-binding adapter molecule 1 (Iba1) expression in the hippocampus. (a) Image showing Iba1-positive cells (green) in the CA1, CA3, and hilus regions of the hippocampus. (bd) Quantification of Iba1-positive cells in the CA1, CA3, and hilus regions of the hippocampus. (e) Image of a Western blot. Full-length blots/gels are presented in Figure S1. (f) Average relative intensity values for the Western blots. The bar graph summarizes changes in the Iba1-positive cells. Nuclei were stained using DAPI. Scale bar: 100 µm. Data are means ± SEM. (vehicle: n = 3, 830 nm laser: n = 3, VPA: n = 3, VPA + 830 nm laser: n = 3). ** p < 0.01 compared to the vehicle group. *** p < 0.001 and **** p < 0.0001 compared to the group exposed to VPA.
Figure 10
Figure 10
The diode laser. (a) Timetable. (b) Laser spectrum at a wavelength of 830 nm. (c) Schematic diagram showing laser irradiation of the abdomen (diameter: 7.07 cm2).

Similar articles

Cited by

References

    1. Edition F. Diagnostic and statistical manual of mental disorders. Am. Psychiatr. Assoc. 2013;21:591–643.
    1. Jęśko H., Cieślik M., Gromadzka G., Adamczyk A. Dysfunctional proteins in neuropsychiatric disorders: From neurodegeneration to autism spectrum disorders. Neurochem. Int. 2020;141:104853. doi: 10.1016/j.neuint.2020.104853. - DOI - PubMed
    1. Kern J.K., Geier D.A., Sykes L.K., Geier M.R. Evidence of neurodegeneration in autism spectrum disorder. Transl. Neurodegener. 2013;2:17. doi: 10.1186/2047-9158-2-17. - DOI - PMC - PubMed
    1. Nag H.E., Nordgren A., Anderlid B.-M., Nærland T. Reversed gender ratio of autism spectrum disorder in Smith-Magenis syndrome. Mol. Autism. 2018;9:1–9. doi: 10.1186/s13229-017-0184-2. - DOI - PMC - PubMed
    1. Pallanti S., Di Ponzio M., Grassi E., Vannini G., Cauli G. Transcranial Photobiomodulation for the Treatment of Children with Autism Spectrum Disorder (ASD): A Retrospective Study. Children. 2022;9:755. doi: 10.3390/children9050755. - DOI - PMC - PubMed